Cities with the Highest Percentage of Population with a Degree in Physical and Health Sciences in Missouri
RELATED REPORTS & OPTIONS
Physical and Health Sciences
Missouri
Compare Cities
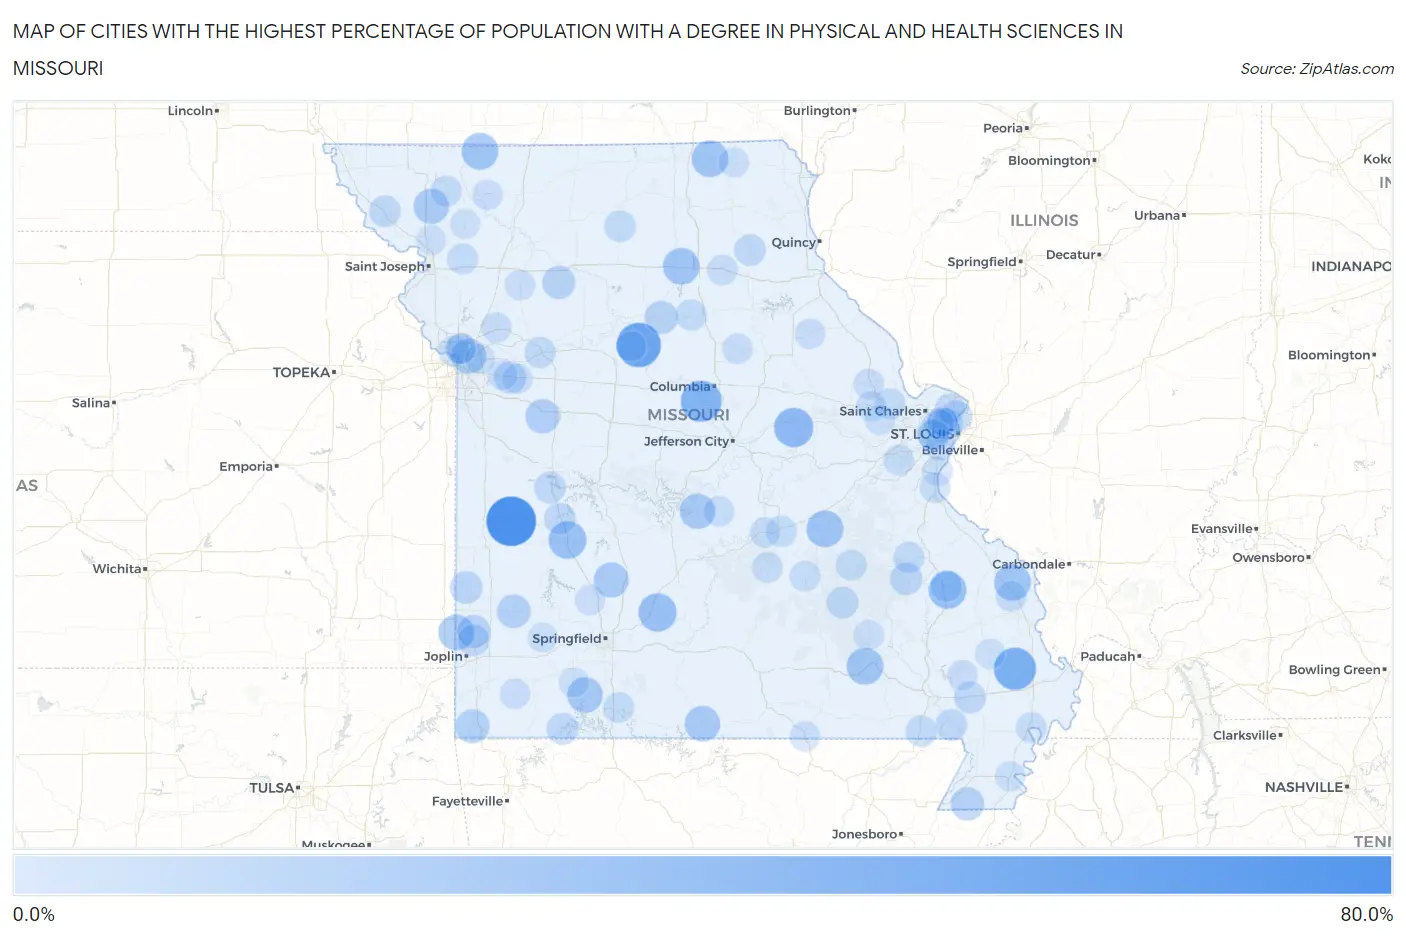
Map of Cities with the Highest Percentage of Population with a Degree in Physical and Health Sciences in Missouri
0.0%
80.0%
Cities with the Highest Percentage of Population with a Degree in Physical and Health Sciences in Missouri
| City | % Graduates | vs State | vs National | |
| 1. | Schell City | 66.7% | 2.6%(+64.1)#1 | 3.1%(+63.6)#42 |
| 2. | Gilliam | 50.0% | 2.6%(+47.4)#2 | 3.1%(+46.9)#89 |
| 3. | Vanduser | 42.9% | 2.6%(+40.3)#3 | 3.1%(+39.8)#127 |
| 4. | Lupus | 38.5% | 2.6%(+35.9)#4 | 3.1%(+35.4)#162 |
| 5. | Morrison | 33.3% | 2.6%(+30.7)#5 | 3.1%(+30.2)#218 |
| 6. | Niangua | 30.0% | 2.6%(+27.4)#6 | 3.1%(+26.9)#258 |
| 7. | Cobalt | 28.6% | 2.6%(+26.0)#7 | 3.1%(+25.5)#288 |
| 8. | Collins | 28.6% | 2.6%(+26.0)#8 | 3.1%(+25.5)#294 |
| 9. | Van Buren | 25.6% | 2.6%(+23.0)#9 | 3.1%(+22.5)#352 |
| 10. | Steelville | 25.6% | 2.6%(+23.0)#10 | 3.1%(+22.5)#353 |
| 11. | Downing | 25.0% | 2.6%(+22.4)#11 | 3.1%(+21.9)#369 |
| 12. | Callao | 25.0% | 2.6%(+22.4)#12 | 3.1%(+21.9)#371 |
| 13. | Old Appleton | 25.0% | 2.6%(+22.4)#13 | 3.1%(+21.9)#387 |
| 14. | Irena | 25.0% | 2.6%(+22.4)#14 | 3.1%(+21.9)#394 |
| 15. | Galena | 22.2% | 2.6%(+19.6)#15 | 3.1%(+19.1)#458 |
| 16. | Waco | 22.2% | 2.6%(+19.6)#16 | 3.1%(+19.1)#462 |
| 17. | Gainesville | 21.6% | 2.6%(+19.0)#17 | 3.1%(+18.5)#482 |
| 18. | Tarsney Lakes | 21.4% | 2.6%(+18.8)#18 | 3.1%(+18.3)#491 |
| 19. | Brumley | 21.1% | 2.6%(+18.5)#19 | 3.1%(+18.0)#504 |
| 20. | Barnard | 20.8% | 2.6%(+18.2)#20 | 3.1%(+17.7)#512 |
| 21. | Halfway | 20.0% | 2.6%(+17.4)#21 | 3.1%(+16.9)#550 |
| 22. | Randolph | 20.0% | 2.6%(+17.4)#22 | 3.1%(+16.9)#556 |
| 23. | Centerview | 17.6% | 2.6%(+15.0)#23 | 3.1%(+14.5)#660 |
| 24. | Ginger Blue | 16.7% | 2.6%(+14.1)#24 | 3.1%(+13.6)#742 |
| 25. | Golden City | 16.0% | 2.6%(+13.4)#25 | 3.1%(+12.9)#784 |
| 26. | Stanton | 15.7% | 2.6%(+13.1)#26 | 3.1%(+12.6)#805 |
| 27. | Hornersville | 15.0% | 2.6%(+12.4)#27 | 3.1%(+11.9)#869 |
| 28. | Salisbury | 14.7% | 2.6%(+12.1)#28 | 3.1%(+11.6)#905 |
| 29. | Ludlow | 14.3% | 2.6%(+11.7)#29 | 3.1%(+11.2)#967 |
| 30. | Hanley Hills | 14.0% | 2.6%(+11.4)#30 | 3.1%(+10.9)#995 |
| 31. | Neck City | 13.8% | 2.6%(+11.2)#31 | 3.1%(+10.7)#1,011 |
| 32. | Liberal | 12.2% | 2.6%(+9.64)#32 | 3.1%(+9.15)#1,189 |
| 33. | Pilot Knob | 12.2% | 2.6%(+9.64)#33 | 3.1%(+9.15)#1,190 |
| 34. | Oak Grove | 11.0% | 2.6%(+8.44)#34 | 3.1%(+7.94)#1,371 |
| 35. | Bunker | 10.5% | 2.6%(+7.93)#35 | 3.1%(+7.43)#1,468 |
| 36. | Osceola | 10.3% | 2.6%(+7.71)#36 | 3.1%(+7.21)#1,524 |
| 37. | Emerald Beach | 10.3% | 2.6%(+7.66)#37 | 3.1%(+7.16)#1,547 |
| 38. | Oronogo | 10.2% | 2.6%(+7.56)#38 | 3.1%(+7.06)#1,570 |
| 39. | Mound City | 10.1% | 2.6%(+7.45)#39 | 3.1%(+6.95)#1,588 |
| 40. | Qulin | 10.0% | 2.6%(+7.40)#40 | 3.1%(+6.90)#1,593 |
| 41. | Deepwater | 10.0% | 2.6%(+7.40)#41 | 3.1%(+6.90)#1,603 |
| 42. | Bethel | 10.0% | 2.6%(+7.40)#42 | 3.1%(+6.90)#1,618 |
| 43. | Dudley | 10.0% | 2.6%(+7.40)#43 | 3.1%(+6.90)#1,621 |
| 44. | Riverview | 9.8% | 2.6%(+7.19)#44 | 3.1%(+6.69)#1,653 |
| 45. | Frontenac | 9.7% | 2.6%(+7.11)#45 | 3.1%(+6.62)#1,671 |
| 46. | Browning | 9.5% | 2.6%(+6.92)#46 | 3.1%(+6.42)#1,722 |
| 47. | Bismarck | 9.1% | 2.6%(+6.55)#47 | 3.1%(+6.05)#1,822 |
| 48. | Neelyville | 9.1% | 2.6%(+6.49)#48 | 3.1%(+5.99)#1,854 |
| 49. | Lexington | 9.0% | 2.6%(+6.39)#49 | 3.1%(+5.89)#1,895 |
| 50. | Uplands Park | 8.8% | 2.6%(+6.22)#50 | 3.1%(+5.72)#1,946 |
| 51. | Huntsville | 8.8% | 2.6%(+6.20)#51 | 3.1%(+5.70)#1,956 |
| 52. | Fredericktown | 8.8% | 2.6%(+6.15)#52 | 3.1%(+5.65)#1,963 |
| 53. | Huntleigh | 8.4% | 2.6%(+5.80)#53 | 3.1%(+5.30)#2,083 |
| 54. | Josephville | 8.0% | 2.6%(+5.44)#54 | 3.1%(+4.94)#2,217 |
| 55. | Clarksdale | 7.7% | 2.6%(+5.09)#55 | 3.1%(+4.59)#2,379 |
| 56. | Conception Junction | 7.7% | 2.6%(+5.09)#56 | 3.1%(+4.59)#2,387 |
| 57. | Viburnum | 7.6% | 2.6%(+5.03)#57 | 3.1%(+4.53)#2,413 |
| 58. | Rolla | 7.6% | 2.6%(+4.96)#58 | 3.1%(+4.46)#2,448 |
| 59. | Merriam Woods | 7.5% | 2.6%(+4.93)#59 | 3.1%(+4.43)#2,458 |
| 60. | Salem | 7.5% | 2.6%(+4.88)#60 | 3.1%(+4.38)#2,480 |
| 61. | Houston Lake | 7.1% | 2.6%(+4.54)#61 | 3.1%(+4.04)#2,693 |
| 62. | Oak Ridge | 7.1% | 2.6%(+4.54)#62 | 3.1%(+4.04)#2,696 |
| 63. | Edgar Springs | 7.1% | 2.6%(+4.54)#63 | 3.1%(+4.04)#2,703 |
| 64. | Oakview | 7.1% | 2.6%(+4.47)#64 | 3.1%(+3.97)#2,741 |
| 65. | New Madrid | 6.9% | 2.6%(+4.30)#65 | 3.1%(+3.80)#2,835 |
| 66. | Lake Tekakwitha | 6.9% | 2.6%(+4.30)#66 | 3.1%(+3.80)#2,846 |
| 67. | Herculaneum | 6.9% | 2.6%(+4.29)#67 | 3.1%(+3.79)#2,850 |
| 68. | Excelsior Springs | 6.7% | 2.6%(+4.14)#68 | 3.1%(+3.64)#2,939 |
| 69. | Clarence | 6.7% | 2.6%(+4.07)#69 | 3.1%(+3.57)#2,982 |
| 70. | Centralia | 6.7% | 2.6%(+4.05)#70 | 3.1%(+3.55)#3,005 |
| 71. | Iberia | 6.5% | 2.6%(+3.92)#71 | 3.1%(+3.42)#3,073 |
| 72. | Grantwood Village | 6.3% | 2.6%(+3.75)#72 | 3.1%(+3.25)#3,187 |
| 73. | Kingston | 6.2% | 2.6%(+3.65)#73 | 3.1%(+3.15)#3,266 |
| 74. | Bates City | 6.2% | 2.6%(+3.65)#74 | 3.1%(+3.15)#3,271 |
| 75. | Black Jack | 6.2% | 2.6%(+3.64)#75 | 3.1%(+3.14)#3,279 |
| 76. | Troy | 6.2% | 2.6%(+3.57)#76 | 3.1%(+3.07)#3,336 |
| 77. | Thayer | 6.1% | 2.6%(+3.54)#77 | 3.1%(+3.04)#3,356 |
| 78. | Vandalia | 6.1% | 2.6%(+3.46)#78 | 3.1%(+2.96)#3,403 |
| 79. | Morrisville | 6.1% | 2.6%(+3.46)#79 | 3.1%(+2.96)#3,411 |
| 80. | Fairview | 6.1% | 2.6%(+3.46)#80 | 3.1%(+2.96)#3,414 |
| 81. | Ellington | 6.0% | 2.6%(+3.38)#81 | 3.1%(+2.88)#3,469 |
| 82. | Gladstone | 5.7% | 2.6%(+3.11)#82 | 3.1%(+2.61)#3,708 |
| 83. | Foristell | 5.5% | 2.6%(+2.93)#83 | 3.1%(+2.43)#3,866 |
| 84. | Albany | 5.5% | 2.6%(+2.90)#84 | 3.1%(+2.40)#3,891 |
| 85. | Slater | 5.5% | 2.6%(+2.87)#85 | 3.1%(+2.37)#3,923 |
| 86. | Puxico | 5.5% | 2.6%(+2.85)#86 | 3.1%(+2.35)#3,942 |
| 87. | Doolittle | 5.5% | 2.6%(+2.85)#87 | 3.1%(+2.35)#3,943 |
| 88. | Overland | 5.4% | 2.6%(+2.80)#88 | 3.1%(+2.30)#4,003 |
| 89. | King City | 5.3% | 2.6%(+2.72)#89 | 3.1%(+2.22)#4,083 |
| 90. | Hayti | 5.3% | 2.6%(+2.66)#90 | 3.1%(+2.16)#4,136 |
| 91. | Memphis | 5.2% | 2.6%(+2.61)#91 | 3.1%(+2.11)#4,215 |
| 92. | Bel Ridge | 5.2% | 2.6%(+2.59)#92 | 3.1%(+2.10)#4,223 |
| 93. | Advance | 5.2% | 2.6%(+2.58)#93 | 3.1%(+2.08)#4,241 |
| 94. | Savannah | 5.1% | 2.6%(+2.52)#94 | 3.1%(+2.02)#4,325 |
| 95. | New Melle | 5.1% | 2.6%(+2.51)#95 | 3.1%(+2.01)#4,340 |
| 96. | Grain Valley | 5.1% | 2.6%(+2.51)#96 | 3.1%(+2.01)#4,343 |
| 97. | Imperial | 5.1% | 2.6%(+2.47)#97 | 3.1%(+1.97)#4,378 |
| 98. | Sugar Creek | 5.0% | 2.6%(+2.38)#98 | 3.1%(+1.88)#4,477 |
| 99. | Crane | 5.0% | 2.6%(+2.35)#99 | 3.1%(+1.85)#4,506 |
| 100. | Miller | 4.9% | 2.6%(+2.34)#100 | 3.1%(+1.84)#4,522 |
Common Questions
What are the Top 10 Cities with the Highest Percentage of Population with a Degree in Physical and Health Sciences in Missouri?
Top 10 Cities with the Highest Percentage of Population with a Degree in Physical and Health Sciences in Missouri are:
#1
66.7%
#2
50.0%
#3
42.9%
#4
38.5%
#5
33.3%
#6
30.0%
#7
28.6%
#8
28.6%
#9
25.6%
#10
25.6%
What city has the Highest Percentage of Population with a Degree in Physical and Health Sciences in Missouri?
Schell City has the Highest Percentage of Population with a Degree in Physical and Health Sciences in Missouri with 66.7%.
What is the Percentage of Population with a Degree in Physical and Health Sciences in the State of Missouri?
Percentage of Population with a Degree in Physical and Health Sciences in Missouri is 2.6%.
What is the Percentage of Population with a Degree in Physical and Health Sciences in the United States?
Percentage of Population with a Degree in Physical and Health Sciences in the United States is 3.1%.