Zip Codes with the Highest Percentage of Population with a Degree in Physical and Health Sciences in San Leandro, CA
RELATED REPORTS & OPTIONS
Physical and Health Sciences
San Leandro
Compare Zip Codes
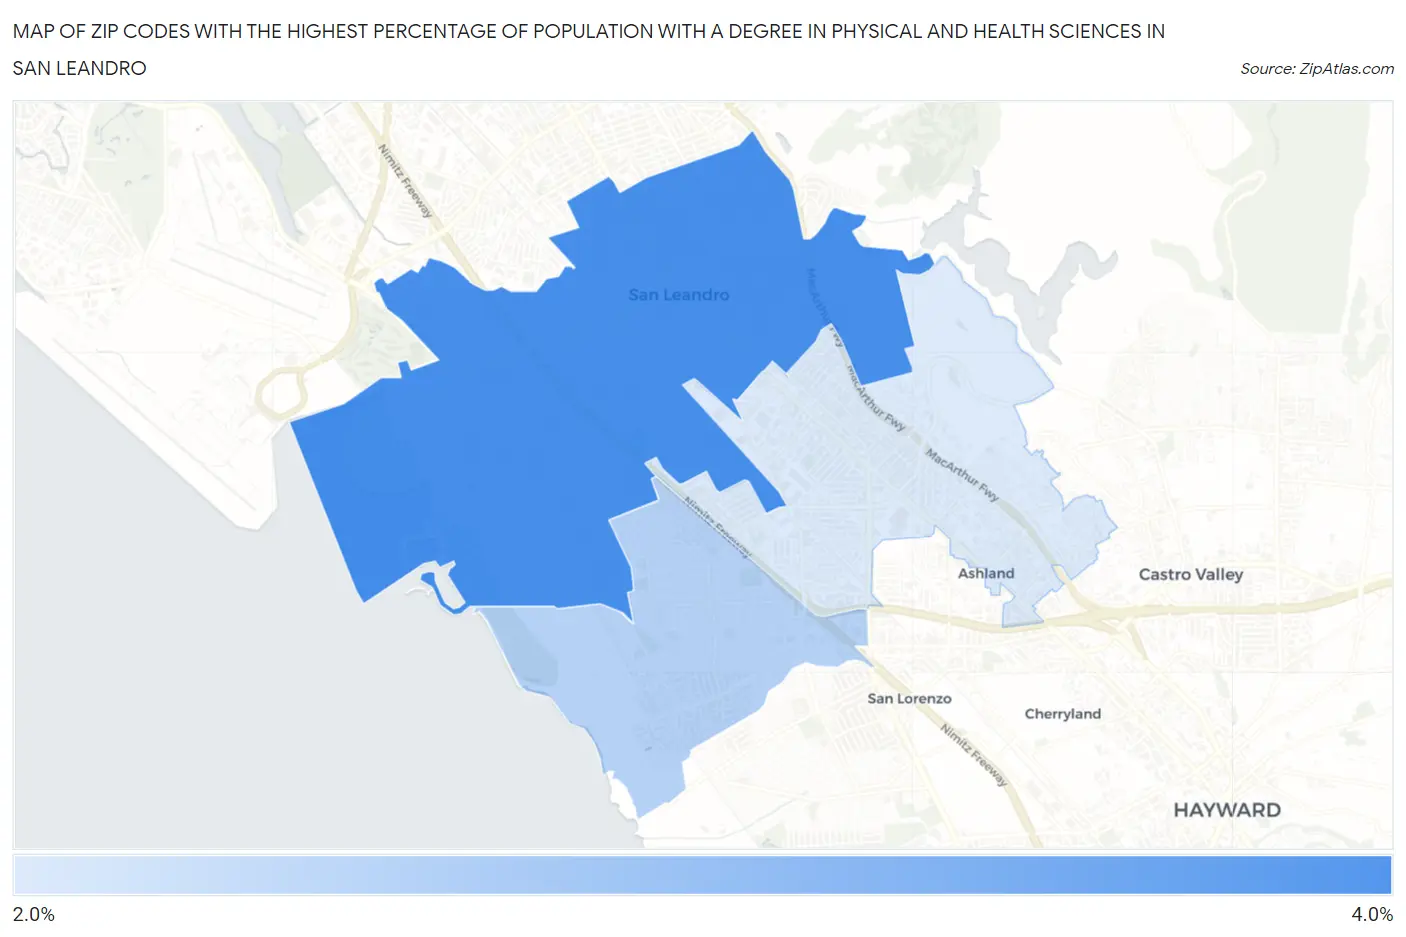
Map of Zip Codes with the Highest Percentage of Population with a Degree in Physical and Health Sciences in San Leandro
2.5%
3.7%
Zip Codes with the Highest Percentage of Population with a Degree in Physical and Health Sciences in San Leandro, CA
| Zip Code | % Graduates | vs State | vs National | |
| 1. | 94577 | 3.7% | 3.1%(+0.550)#434 | 3.1%(+0.565)#7,834 |
| 2. | 94579 | 2.8% | 3.1%(-0.335)#711 | 3.1%(-0.320)#11,425 |
| 3. | 94578 | 2.5% | 3.1%(-0.650)#823 | 3.1%(-0.635)#12,890 |
1
Common Questions
What are the Top Zip Codes with the Highest Percentage of Population with a Degree in Physical and Health Sciences in San Leandro, CA?
Top Zip Codes with the Highest Percentage of Population with a Degree in Physical and Health Sciences in San Leandro, CA are:
What zip code has the Highest Percentage of Population with a Degree in Physical and Health Sciences in San Leandro, CA?
94577 has the Highest Percentage of Population with a Degree in Physical and Health Sciences in San Leandro, CA with 3.7%.
What is the Percentage of Population with a Degree in Physical and Health Sciences in San Leandro, CA?
Percentage of Population with a Degree in Physical and Health Sciences in San Leandro is 3.1%.
What is the Percentage of Population with a Degree in Physical and Health Sciences in California?
Percentage of Population with a Degree in Physical and Health Sciences in California is 3.1%.
What is the Percentage of Population with a Degree in Physical and Health Sciences in the United States?
Percentage of Population with a Degree in Physical and Health Sciences in the United States is 3.1%.