Zip Codes with the Highest Percentage of Population with a Degree in Physical and Health Sciences in San Clemente, CA
RELATED REPORTS & OPTIONS
Physical and Health Sciences
San Clemente
Compare Zip Codes
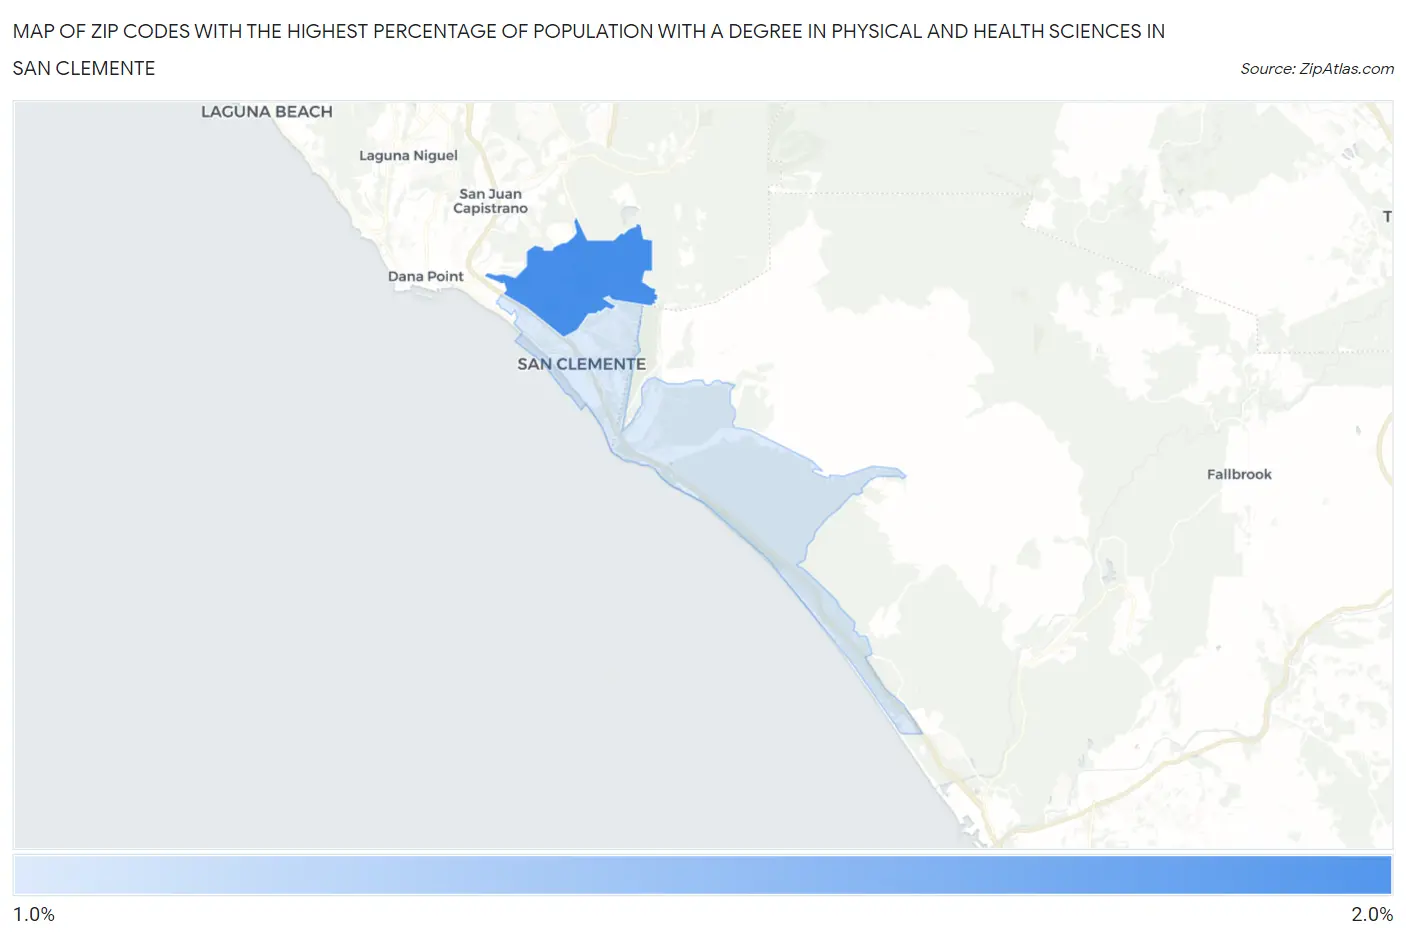
Map of Zip Codes with the Highest Percentage of Population with a Degree in Physical and Health Sciences in San Clemente
1.3%
1.6%
Zip Codes with the Highest Percentage of Population with a Degree in Physical and Health Sciences in San Clemente, CA
| Zip Code | % Graduates | vs State | vs National | |
| 1. | 92673 | 1.6% | 3.1%(-1.48)#1,127 | 3.1%(-1.46)#16,719 |
| 2. | 92672 | 1.3% | 3.1%(-1.80)#1,207 | 3.1%(-1.78)#18,040 |
1
Common Questions
What are the Top Zip Codes with the Highest Percentage of Population with a Degree in Physical and Health Sciences in San Clemente, CA?
Top Zip Codes with the Highest Percentage of Population with a Degree in Physical and Health Sciences in San Clemente, CA are:
What zip code has the Highest Percentage of Population with a Degree in Physical and Health Sciences in San Clemente, CA?
92673 has the Highest Percentage of Population with a Degree in Physical and Health Sciences in San Clemente, CA with 1.6%.
What is the Percentage of Population with a Degree in Physical and Health Sciences in San Clemente, CA?
Percentage of Population with a Degree in Physical and Health Sciences in San Clemente is 1.5%.
What is the Percentage of Population with a Degree in Physical and Health Sciences in California?
Percentage of Population with a Degree in Physical and Health Sciences in California is 3.1%.
What is the Percentage of Population with a Degree in Physical and Health Sciences in the United States?
Percentage of Population with a Degree in Physical and Health Sciences in the United States is 3.1%.