Cities with the Highest Percentage of Population with a Degree in Physical and Health Sciences in Delaware
RELATED REPORTS & OPTIONS
Physical and Health Sciences
Delaware
Compare Cities
Map of Cities with the Highest Percentage of Population with a Degree in Physical and Health Sciences in Delaware
0.0%
20.0%
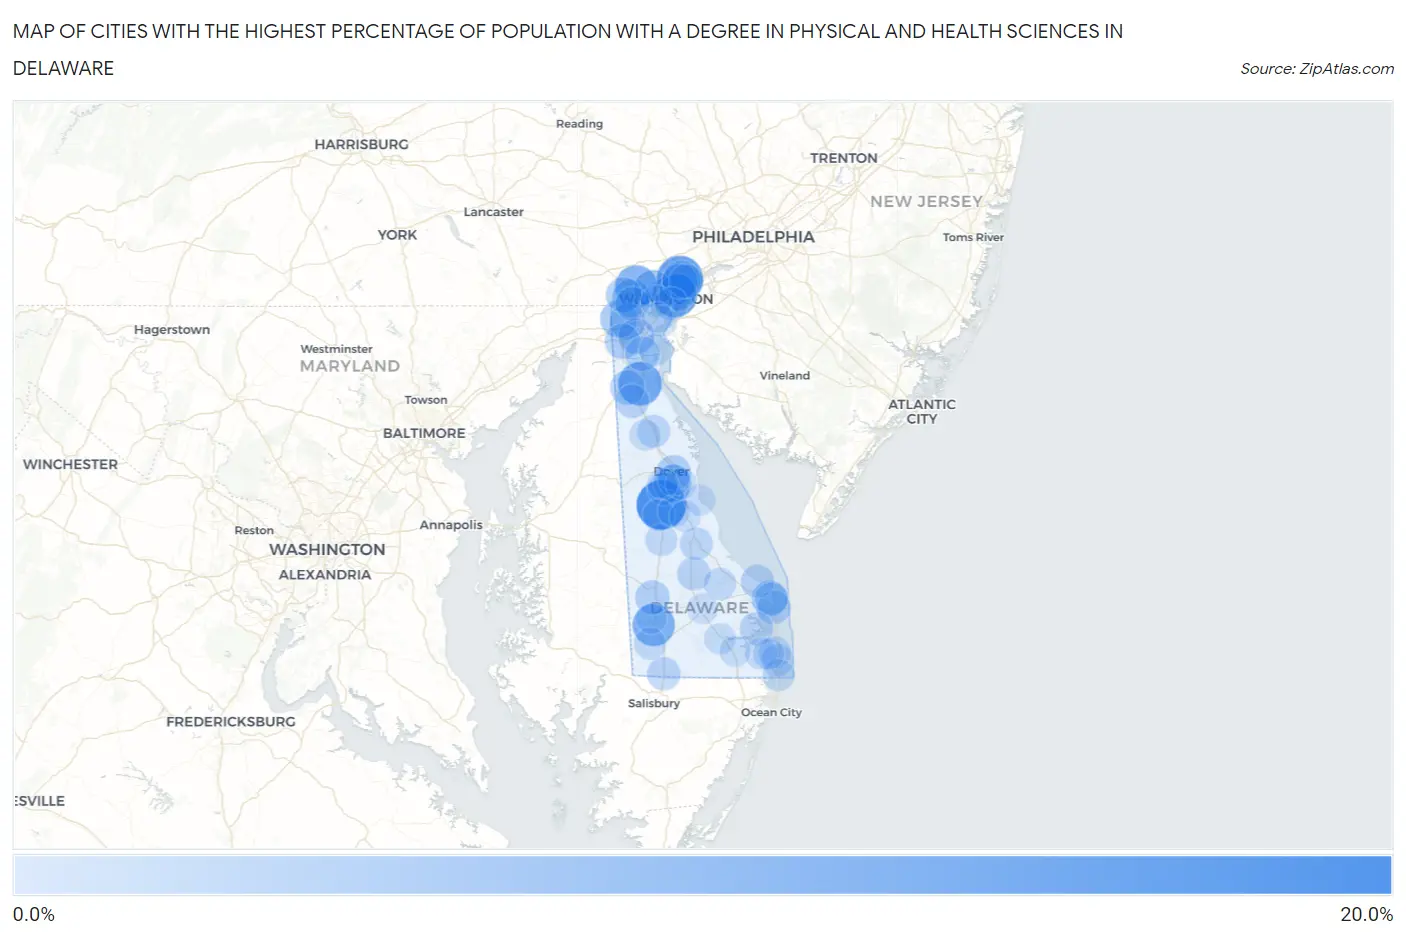
Cities with the Highest Percentage of Population with a Degree in Physical and Health Sciences in Delaware
| City | % Graduates | vs State | vs National | |
| 1. | Viola | 17.6% | 4.1%(+13.5)#1 | 3.1%(+14.5)#662 |
| 2. | Arden | 14.4% | 4.1%(+10.3)#2 | 3.1%(+11.3)#929 |
| 3. | Edgemoor | 13.0% | 4.1%(+8.88)#3 | 3.1%(+9.90)#1,105 |
| 4. | Odessa | 12.2% | 4.1%(+8.09)#4 | 3.1%(+9.11)#1,195 |
| 5. | Blades | 10.9% | 4.1%(+6.79)#5 | 3.1%(+7.81)#1,384 |
| 6. | Hockessin | 10.6% | 4.1%(+6.46)#6 | 3.1%(+7.49)#1,445 |
| 7. | Ardentown | 7.3% | 4.1%(+3.16)#7 | 3.1%(+4.19)#2,596 |
| 8. | Highland Acres | 6.6% | 4.1%(+2.44)#8 | 3.1%(+3.47)#3,046 |
| 9. | Pike Creek | 6.5% | 4.1%(+2.36)#9 | 3.1%(+3.38)#3,092 |
| 10. | Greenville | 6.4% | 4.1%(+2.29)#10 | 3.1%(+3.31)#3,148 |
| 11. | Newark | 6.2% | 4.1%(+2.11)#11 | 3.1%(+3.13)#3,284 |
| 12. | Bellefonte | 6.0% | 4.1%(+1.91)#12 | 3.1%(+2.94)#3,434 |
| 13. | Rehoboth Beach | 5.7% | 4.1%(+1.55)#13 | 3.1%(+2.58)#3,733 |
| 14. | Brookside | 5.4% | 4.1%(+1.32)#14 | 3.1%(+2.34)#3,955 |
| 15. | Bear | 5.0% | 4.1%(+0.853)#15 | 3.1%(+1.88)#4,478 |
| 16. | North Star | 4.9% | 4.1%(+0.736)#16 | 3.1%(+1.76)#4,631 |
| 17. | Ardencroft | 4.6% | 4.1%(+0.463)#17 | 3.1%(+1.49)#5,011 |
| 18. | Glasgow | 4.6% | 4.1%(+0.437)#18 | 3.1%(+1.46)#5,040 |
| 19. | Dover | 4.3% | 4.1%(+0.157)#19 | 3.1%(+1.18)#5,498 |
| 20. | Middletown | 4.0% | 4.1%(-0.131)#20 | 3.1%(+0.893)#5,993 |
| 21. | St Georges | 3.9% | 4.1%(-0.177)#21 | 3.1%(+0.848)#6,082 |
| 22. | Bridgeville | 3.8% | 4.1%(-0.320)#22 | 3.1%(+0.705)#6,359 |
| 23. | Claymont | 3.7% | 4.1%(-0.405)#23 | 3.1%(+0.620)#6,528 |
| 24. | Pike Creek Valley | 3.4% | 4.1%(-0.684)#24 | 3.1%(+0.340)#7,172 |
| 25. | Dewey Beach | 3.4% | 4.1%(-0.705)#25 | 3.1%(+0.319)#7,228 |
| 26. | Townsend | 3.1% | 4.1%(-0.974)#26 | 3.1%(+0.050)#7,899 |
| 27. | Delmar | 3.1% | 4.1%(-1.05)#27 | 3.1%(-0.023)#8,076 |
| 28. | Lewes | 2.9% | 4.1%(-1.22)#28 | 3.1%(-0.195)#8,574 |
| 29. | Long Neck | 2.9% | 4.1%(-1.26)#29 | 3.1%(-0.236)#8,676 |
| 30. | Wilmington | 2.9% | 4.1%(-1.26)#30 | 3.1%(-0.241)#8,690 |
| 31. | Ellendale | 2.8% | 4.1%(-1.35)#31 | 3.1%(-0.322)#8,961 |
| 32. | Milford | 2.6% | 4.1%(-1.55)#32 | 3.1%(-0.525)#9,587 |
| 33. | Henlopen Acres | 2.5% | 4.1%(-1.62)#33 | 3.1%(-0.600)#9,816 |
| 34. | Smyrna | 2.4% | 4.1%(-1.70)#34 | 3.1%(-0.678)#10,027 |
| 35. | Camden | 2.4% | 4.1%(-1.72)#35 | 3.1%(-0.693)#10,067 |
| 36. | South Bethany | 2.1% | 4.1%(-2.05)#36 | 3.1%(-1.03)#11,059 |
| 37. | Bethany Beach | 2.0% | 4.1%(-2.13)#37 | 3.1%(-1.11)#11,311 |
| 38. | Kent Acres | 2.0% | 4.1%(-2.14)#38 | 3.1%(-1.12)#11,346 |
| 39. | Harrington | 2.0% | 4.1%(-2.17)#39 | 3.1%(-1.15)#11,427 |
| 40. | Delaware City | 2.0% | 4.1%(-2.17)#40 | 3.1%(-1.15)#11,431 |
| 41. | Bethel | 1.9% | 4.1%(-2.20)#41 | 3.1%(-1.18)#11,526 |
| 42. | Milton | 1.9% | 4.1%(-2.20)#42 | 3.1%(-1.18)#11,529 |
| 43. | Millville | 1.9% | 4.1%(-2.21)#43 | 3.1%(-1.18)#11,539 |
| 44. | Fenwick Island | 1.9% | 4.1%(-2.25)#44 | 3.1%(-1.23)#11,685 |
| 45. | Felton | 1.7% | 4.1%(-2.38)#45 | 3.1%(-1.36)#12,077 |
| 46. | Riverview | 1.5% | 4.1%(-2.63)#46 | 3.1%(-1.60)#12,740 |
| 47. | Millsboro | 1.4% | 4.1%(-2.76)#47 | 3.1%(-1.74)#13,094 |
| 48. | Elsmere | 1.3% | 4.1%(-2.81)#48 | 3.1%(-1.79)#13,208 |
| 49. | New Castle | 1.3% | 4.1%(-2.85)#49 | 3.1%(-1.82)#13,296 |
| 50. | Clayton | 1.2% | 4.1%(-2.88)#50 | 3.1%(-1.85)#13,369 |
| 51. | Frederica | 1.1% | 4.1%(-3.00)#51 | 3.1%(-1.98)#13,675 |
| 52. | Bowers | 1.1% | 4.1%(-3.05)#52 | 3.1%(-2.02)#13,785 |
| 53. | Ocean View | 1.0% | 4.1%(-3.09)#53 | 3.1%(-2.07)#13,897 |
| 54. | Dover Base Housing | 0.99% | 4.1%(-3.14)#54 | 3.1%(-2.11)#13,992 |
| 55. | Dagsboro | 0.93% | 4.1%(-3.19)#55 | 3.1%(-2.17)#14,120 |
| 56. | Wyoming | 0.91% | 4.1%(-3.21)#56 | 3.1%(-2.19)#14,155 |
| 57. | Wilmington Manor | 0.69% | 4.1%(-3.44)#57 | 3.1%(-2.41)#14,558 |
| 58. | Georgetown | 0.68% | 4.1%(-3.44)#58 | 3.1%(-2.42)#14,562 |
| 59. | Seaford | 0.46% | 4.1%(-3.66)#59 | 3.1%(-2.64)#14,823 |
1
Common Questions
What are the Top 10 Cities with the Highest Percentage of Population with a Degree in Physical and Health Sciences in Delaware?
Top 10 Cities with the Highest Percentage of Population with a Degree in Physical and Health Sciences in Delaware are:
#1
17.6%
#2
14.4%
#3
13.0%
#4
12.2%
#5
10.9%
#6
10.6%
#7
7.3%
#8
6.6%
#9
6.5%
#10
6.4%
What city has the Highest Percentage of Population with a Degree in Physical and Health Sciences in Delaware?
Viola has the Highest Percentage of Population with a Degree in Physical and Health Sciences in Delaware with 17.6%.
What is the Percentage of Population with a Degree in Physical and Health Sciences in the State of Delaware?
Percentage of Population with a Degree in Physical and Health Sciences in Delaware is 4.1%.
What is the Percentage of Population with a Degree in Physical and Health Sciences in the United States?
Percentage of Population with a Degree in Physical and Health Sciences in the United States is 3.1%.