Zip Codes with the Highest Percentage of Population Employed in Computer & Mathematics in Malibu, CA
RELATED REPORTS & OPTIONS
Computer & Mathematics
Malibu
Compare Zip Codes
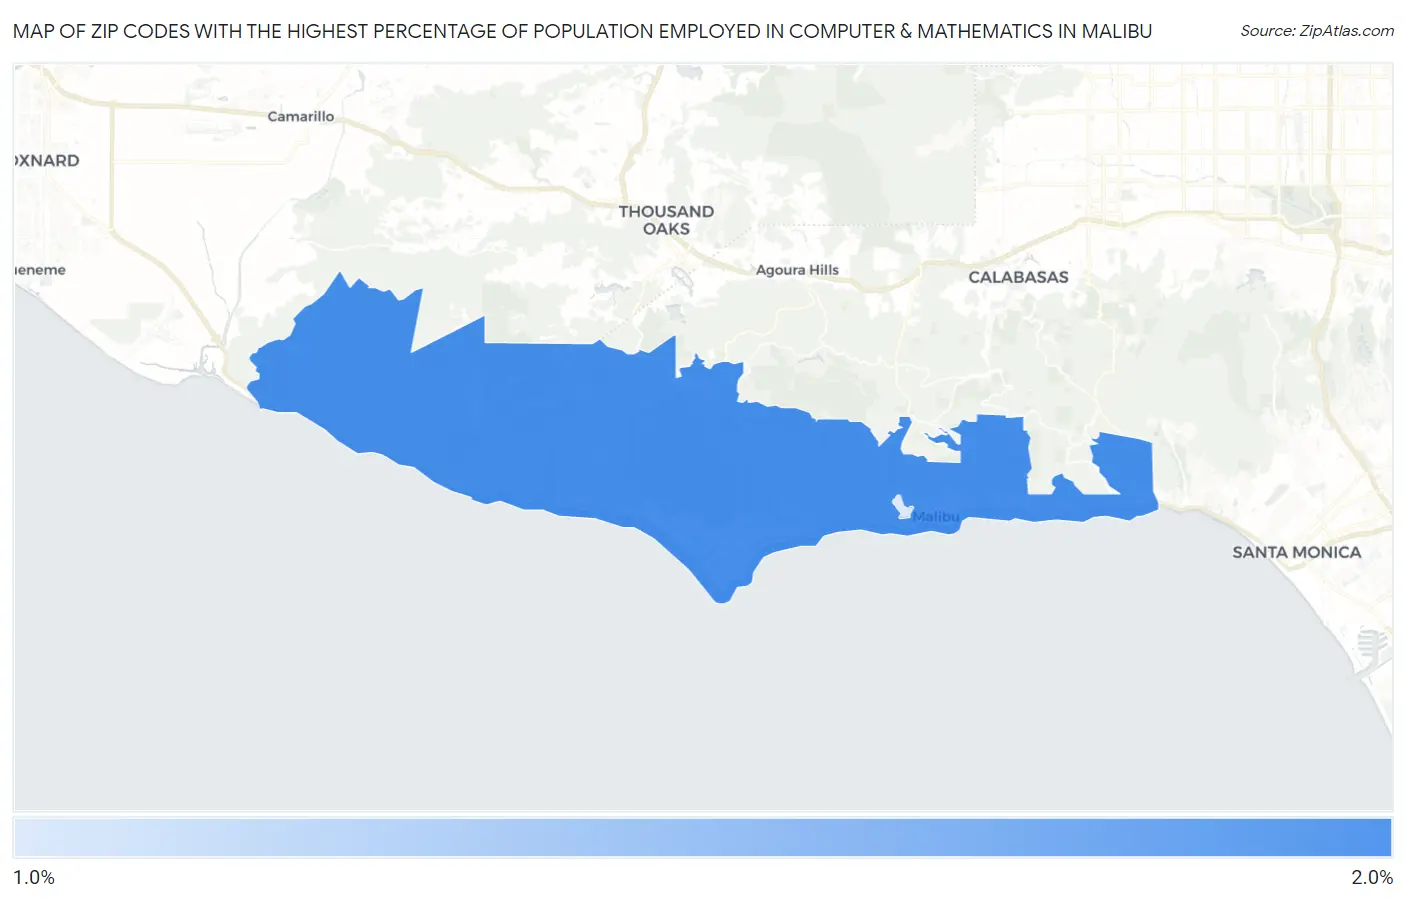
Map of Zip Codes with the Highest Percentage of Population Employed in Computer & Mathematics in Malibu
1.3%
1.6%
Zip Codes with the Highest Percentage of Population Employed in Computer & Mathematics in Malibu, CA
| Zip Code | % Employed | vs State | vs National | |
| 1. | 90265 | 1.6% | 4.1%(-2.51)#989 | 3.5%(-1.93)#13,824 |
| 2. | 90263 | 1.3% | 4.1%(-2.85)#1,078 | 3.5%(-2.27)#15,802 |
1
Common Questions
What are the Top Zip Codes with the Highest Percentage of Population Employed in Computer & Mathematics in Malibu, CA?
Top Zip Codes with the Highest Percentage of Population Employed in Computer & Mathematics in Malibu, CA are:
What zip code has the Highest Percentage of Population Employed in Computer & Mathematics in Malibu, CA?
90265 has the Highest Percentage of Population Employed in Computer & Mathematics in Malibu, CA with 1.6%.
What is the Percentage of Population Employed in Computer & Mathematics in Malibu, CA?
Percentage of Population Employed in Computer & Mathematics in Malibu is 1.4%.
What is the Percentage of Population Employed in Computer & Mathematics in California?
Percentage of Population Employed in Computer & Mathematics in California is 4.1%.
What is the Percentage of Population Employed in Computer & Mathematics in the United States?
Percentage of Population Employed in Computer & Mathematics in the United States is 3.5%.