Lemoore Station, CA Map & Demographics
Lemoore Station Map
Lemoore Station Overview
$24,771
PER CAPITA INCOME
$63,954
AVG FAMILY INCOME
$63,870
AVG HOUSEHOLD INCOME
9.9%
WAGE / INCOME GAP [ % ]
90.1¢/ $1
WAGE / INCOME GAP [ $ ]
0.30
INEQUALITY / GINI INDEX
6,403
TOTAL POPULATION
3,895
MALE POPULATION
2,508
FEMALE POPULATION
155.30
MALES / 100 FEMALES
64.39
FEMALES / 100 MALES
23.4
MEDIAN AGE
3.3
AVG FAMILY SIZE
3.2
AVG HOUSEHOLD SIZE
3,751
LABOR FORCE [ PEOPLE ]
80.9%
PERCENT IN LABOR FORCE
8.9%
UNEMPLOYMENT RATE
Income in Lemoore Station
Income Overview in Lemoore Station
Per Capita Income in Lemoore Station is $24,771, while median incomes of families and households are $63,954 and $63,870 respectively.
| Characteristic | Number | Measure |
| Per Capita Income | 6,403 | $24,771 |
| Median Family Income | 1,395 | $63,954 |
| Mean Family Income | 1,395 | $72,884 |
| Median Household Income | 1,444 | $63,870 |
| Mean Household Income | 1,444 | $72,759 |
| Income Deficit | 1,395 | $0 |
| Wage / Income Gap (%) | 6,403 | 9.94% |
| Wage / Income Gap ($) | 6,403 | 90.06¢ per $1 |
| Gini / Inequality Index | 6,403 | 0.30 |
Earnings by Sex in Lemoore Station
Average Earnings in Lemoore Station are $30,609, $31,185 for men and $28,086 for women, a difference of 9.9%.
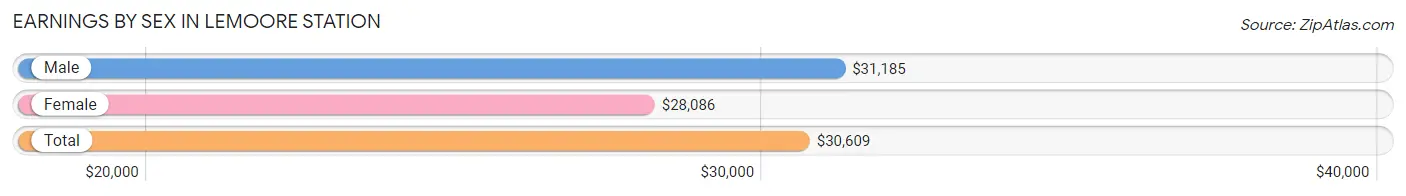
| Sex | Number | Average Earnings |
| Male | 2,790 (71.8%) | $31,185 |
| Female | 1,096 (28.2%) | $28,086 |
| Total | 3,886 (100.0%) | $30,609 |
Earnings by Sex by Income Bracket in Lemoore Station
The most common earnings brackets in Lemoore Station are $25,000 to $29,999 for men (702 | 25.2%) and $25,000 to $29,999 for women (165 | 15.0%).
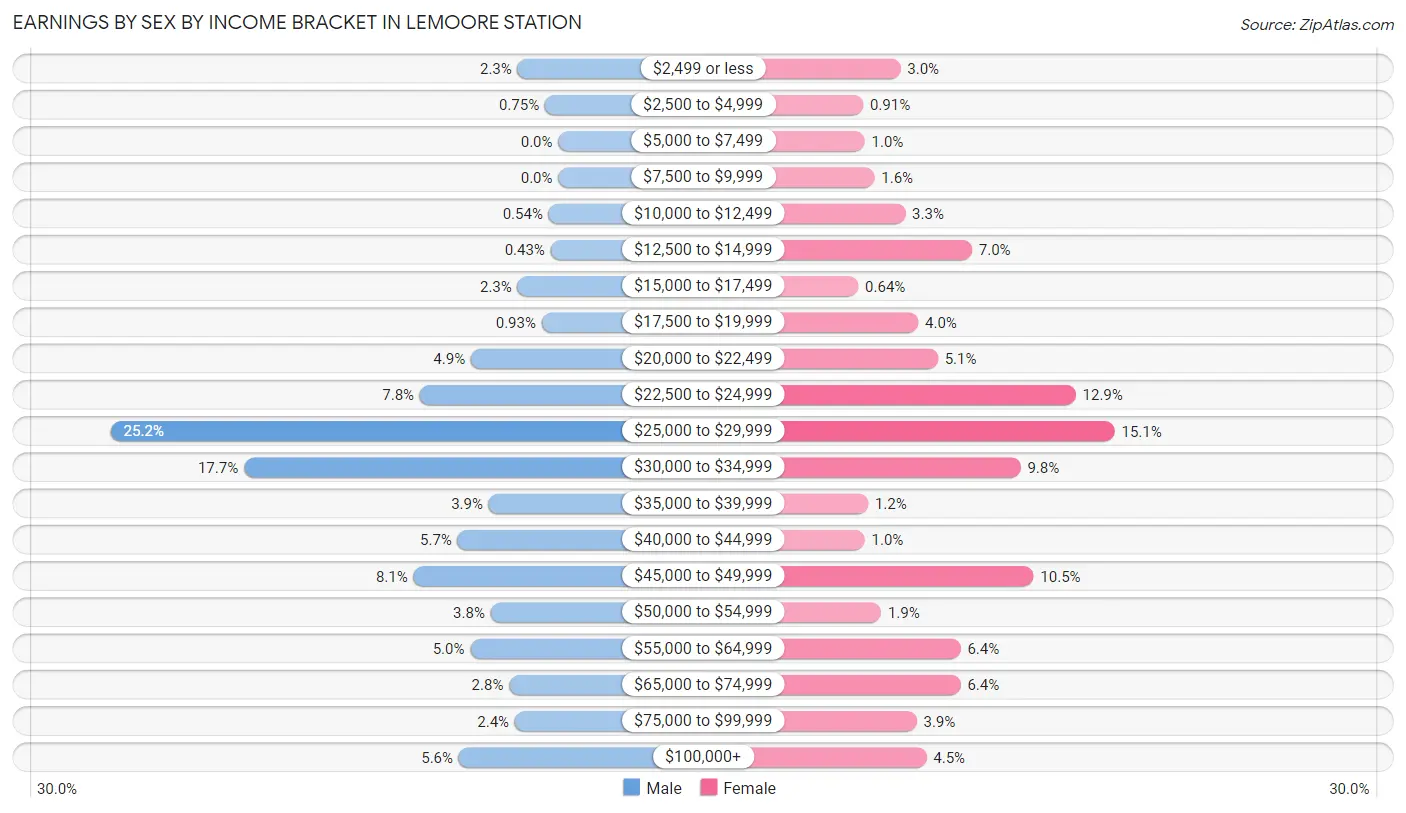
| Income | Male | Female |
| $2,499 or less | 64 (2.3%) | 33 (3.0%) |
| $2,500 to $4,999 | 21 (0.7%) | 10 (0.9%) |
| $5,000 to $7,499 | 0 (0.0%) | 11 (1.0%) |
| $7,500 to $9,999 | 0 (0.0%) | 17 (1.5%) |
| $10,000 to $12,499 | 15 (0.5%) | 36 (3.3%) |
| $12,500 to $14,999 | 12 (0.4%) | 77 (7.0%) |
| $15,000 to $17,499 | 64 (2.3%) | 7 (0.6%) |
| $17,500 to $19,999 | 26 (0.9%) | 44 (4.0%) |
| $20,000 to $22,499 | 137 (4.9%) | 56 (5.1%) |
| $22,500 to $24,999 | 217 (7.8%) | 141 (12.9%) |
| $25,000 to $29,999 | 702 (25.2%) | 165 (15.0%) |
| $30,000 to $34,999 | 493 (17.7%) | 107 (9.8%) |
| $35,000 to $39,999 | 109 (3.9%) | 13 (1.2%) |
| $40,000 to $44,999 | 158 (5.7%) | 11 (1.0%) |
| $45,000 to $49,999 | 227 (8.1%) | 115 (10.5%) |
| $50,000 to $54,999 | 106 (3.8%) | 21 (1.9%) |
| $55,000 to $64,999 | 138 (5.0%) | 70 (6.4%) |
| $65,000 to $74,999 | 77 (2.8%) | 70 (6.4%) |
| $75,000 to $99,999 | 68 (2.4%) | 43 (3.9%) |
| $100,000+ | 156 (5.6%) | 49 (4.5%) |
| Total | 2,790 (100.0%) | 1,096 (100.0%) |
Earnings by Sex by Educational Attainment in Lemoore Station
Average earnings in Lemoore Station are $43,813 for men and $31,858 for women, a difference of 27.3%. Men with an educational attainment of graduate degree enjoy the highest average annual earnings of $122,206, while those with high school diploma education earn the least with $37,344. Women with an educational attainment of high school diploma earn the most with the average annual earnings of $45,822, while those with college or associate's degree education have the smallest earnings of $29,444.
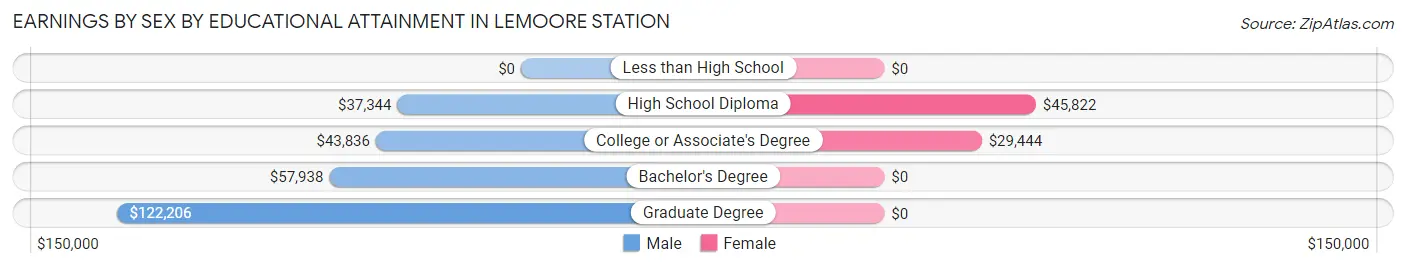
| Educational Attainment | Male Income | Female Income |
| Less than High School | - | - |
| High School Diploma | $37,344 | $45,822 |
| College or Associate's Degree | $43,836 | $29,444 |
| Bachelor's Degree | $57,938 | $0 |
| Graduate Degree | $122,206 | $0 |
| Total | $43,813 | $31,858 |
Family Income in Lemoore Station
Family Income Brackets in Lemoore Station
According to the Lemoore Station family income data, there are 583 families falling into the $50,000 to $74,999 income range, which is the most common income bracket and makes up 41.8% of all families. Conversely, the less than $10,000 income bracket is the least frequent group with only 24 families (1.7%) belonging to this category.
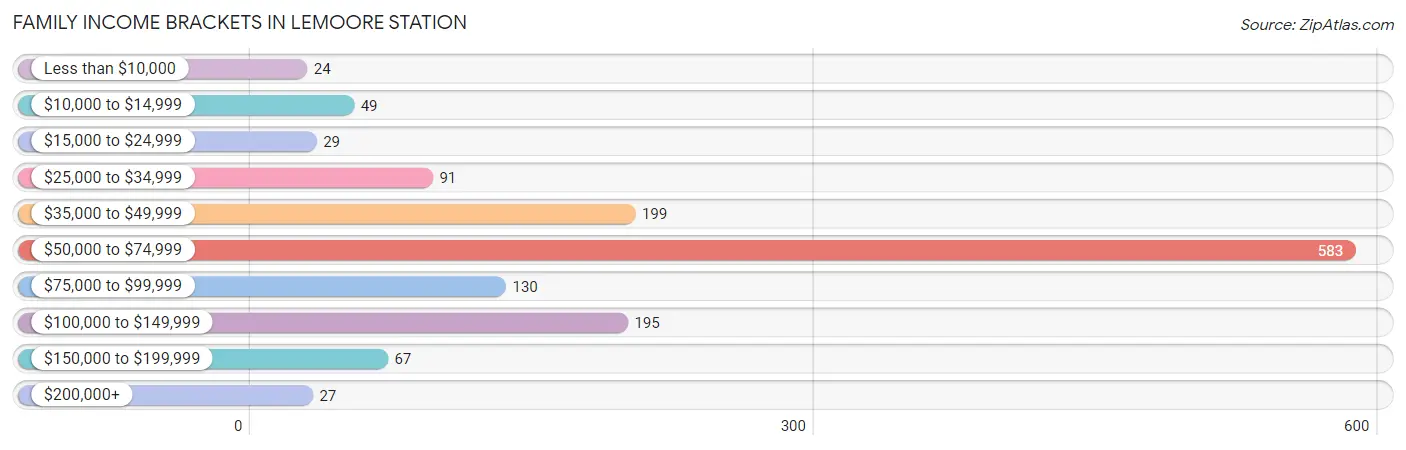
| Income Bracket | # Families | % Families |
| Less than $10,000 | 24 | 1.7% |
| $10,000 to $14,999 | 49 | 3.5% |
| $15,000 to $24,999 | 29 | 2.1% |
| $25,000 to $34,999 | 91 | 6.5% |
| $35,000 to $49,999 | 199 | 14.3% |
| $50,000 to $74,999 | 583 | 41.8% |
| $75,000 to $99,999 | 130 | 9.3% |
| $100,000 to $149,999 | 195 | 14.0% |
| $150,000 to $199,999 | 67 | 4.8% |
| $200,000+ | 27 | 1.9% |
Family Income by Famaliy Size in Lemoore Station
4-person families (370 | 26.5%) account for the highest median family income in Lemoore Station with $80,357 per family, while 2-person families (439 | 31.5%) have the highest median income of $32,780 per family member.
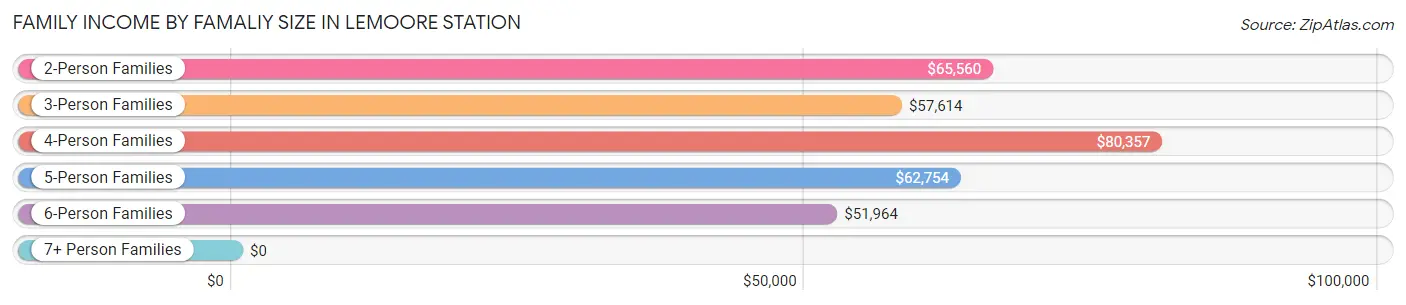
| Income Bracket | # Families | Median Income |
| 2-Person Families | 439 (31.5%) | $65,560 |
| 3-Person Families | 379 (27.2%) | $57,614 |
| 4-Person Families | 370 (26.5%) | $80,357 |
| 5-Person Families | 125 (9.0%) | $62,754 |
| 6-Person Families | 82 (5.9%) | $51,964 |
| 7+ Person Families | 0 (0.0%) | $0 |
| Total | 1,395 (100.0%) | $63,954 |
Family Income by Number of Earners in Lemoore Station
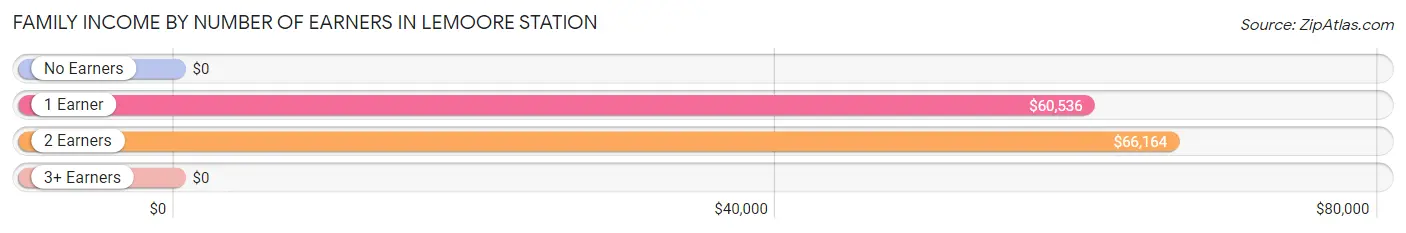
| Number of Earners | # Families | Median Income |
| No Earners | 47 (3.4%) | $0 |
| 1 Earner | 645 (46.2%) | $60,536 |
| 2 Earners | 703 (50.4%) | $66,164 |
| 3+ Earners | 0 (0.0%) | $0 |
| Total | 1,395 (100.0%) | $63,954 |
Household Income in Lemoore Station
Household Income Brackets in Lemoore Station
With 583 households falling in the category, the $50,000 to $74,999 income range is the most frequent in Lemoore Station, accounting for 40.4% of all households. In contrast, only 25 households (1.7%) fall into the less than $10,000 income bracket, making it the least populous group.
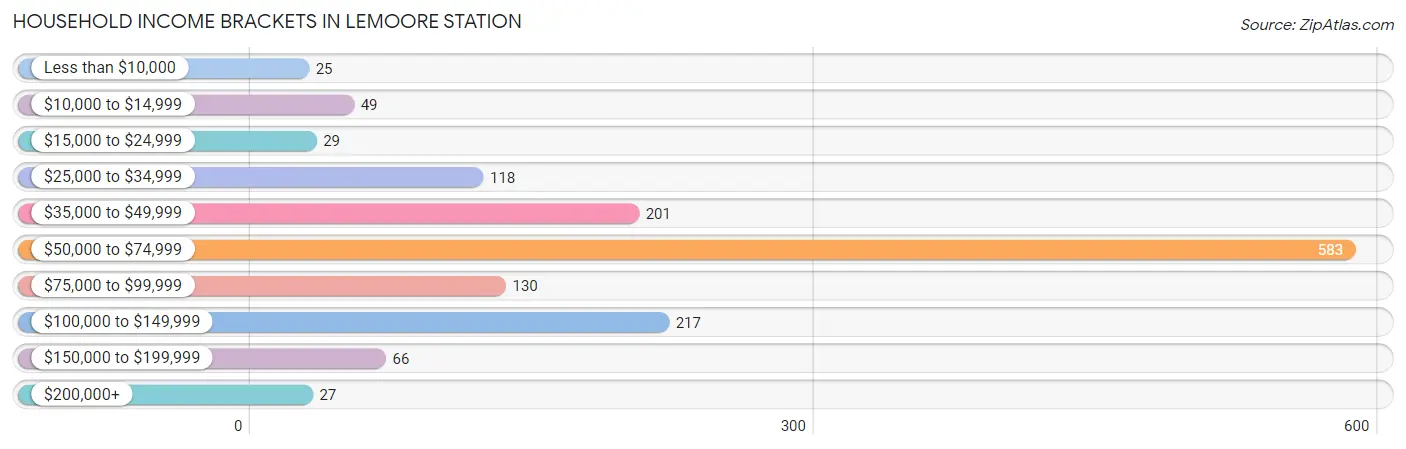
| Income Bracket | # Households | % Households |
| Less than $10,000 | 25 | 1.7% |
| $10,000 to $14,999 | 49 | 3.4% |
| $15,000 to $24,999 | 29 | 2.0% |
| $25,000 to $34,999 | 118 | 8.2% |
| $35,000 to $49,999 | 201 | 13.9% |
| $50,000 to $74,999 | 583 | 40.4% |
| $75,000 to $99,999 | 130 | 9.0% |
| $100,000 to $149,999 | 217 | 15.0% |
| $150,000 to $199,999 | 66 | 4.6% |
| $200,000+ | 27 | 1.9% |
Household Income by Householder Age in Lemoore Station
The median household income in Lemoore Station is $63,870, with the highest median household income of $117,574 found in the 45 to 64 years age bracket for the primary householder. A total of 146 households (10.1%) fall into this category.
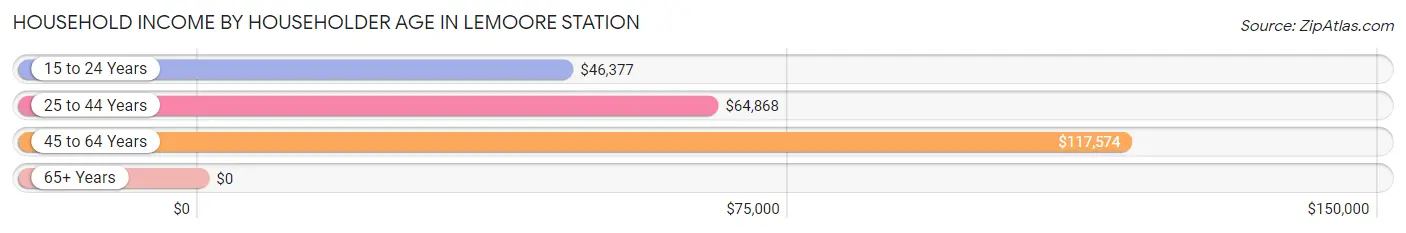
| Income Bracket | # Households | Median Income |
| 15 to 24 Years | 239 (16.6%) | $46,377 |
| 25 to 44 Years | 1,059 (73.3%) | $64,868 |
| 45 to 64 Years | 146 (10.1%) | $117,574 |
| 65+ Years | 0 (0.0%) | $0 |
| Total | 1,444 (100.0%) | $63,870 |
Poverty in Lemoore Station
Income Below Poverty by Sex and Age in Lemoore Station
With 14.4% poverty level for males and 5.8% for females among the residents of Lemoore Station, 6 to 11 year old males and 55 to 64 year old females are the most vulnerable to poverty, with 194 males (43.9%) and 32 females (69.6%) in their respective age groups living below the poverty level.
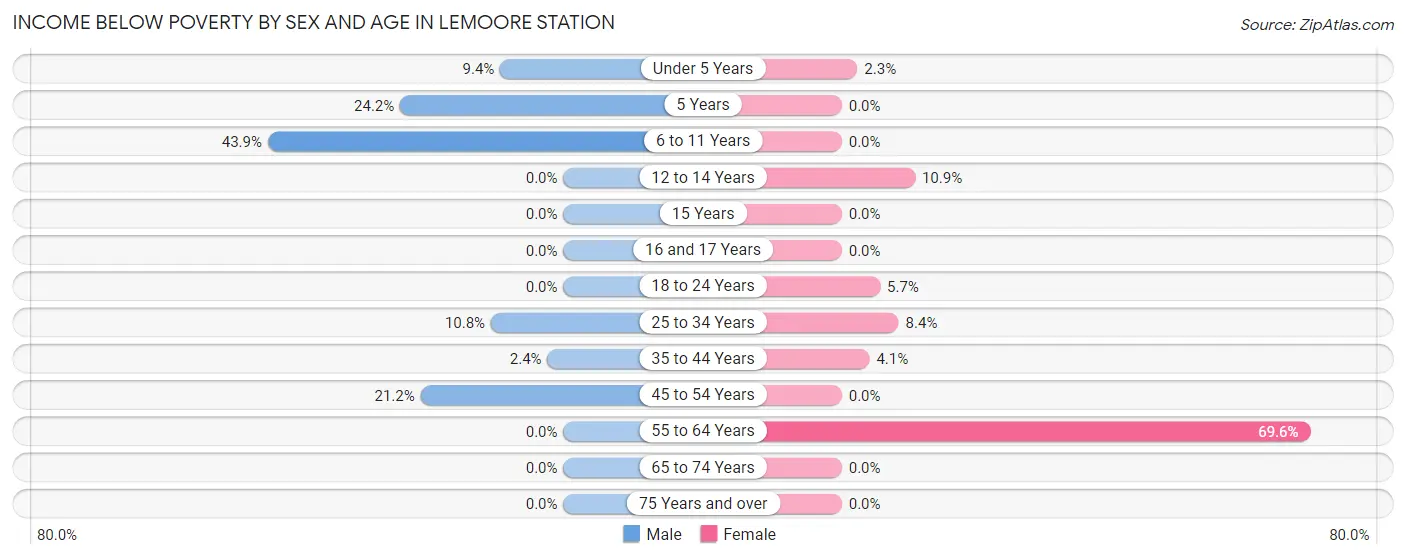
| Age Bracket | Male | Female |
| Under 5 Years | 45 (9.4%) | 9 (2.3%) |
| 5 Years | 8 (24.2%) | 0 (0.0%) |
| 6 to 11 Years | 194 (43.9%) | 0 (0.0%) |
| 12 to 14 Years | 0 (0.0%) | 10 (10.9%) |
| 15 Years | 0 (0.0%) | 0 (0.0%) |
| 16 and 17 Years | 0 (0.0%) | 0 (0.0%) |
| 18 to 24 Years | 0 (0.0%) | 17 (5.7%) |
| 25 to 34 Years | 57 (10.7%) | 45 (8.4%) |
| 35 to 44 Years | 11 (2.4%) | 17 (4.1%) |
| 45 to 54 Years | 28 (21.2%) | 0 (0.0%) |
| 55 to 64 Years | 0 (0.0%) | 32 (69.6%) |
| 65 to 74 Years | 0 (0.0%) | 0 (0.0%) |
| 75 Years and over | 0 (0.0%) | 0 (0.0%) |
| Total | 343 (14.4%) | 130 (5.8%) |
Income Above Poverty by Sex and Age in Lemoore Station
According to the poverty statistics in Lemoore Station, males aged 12 to 14 years and females aged 5 years are the age groups that are most secure financially, with 100.0% of males and 100.0% of females in these age groups living above the poverty line.
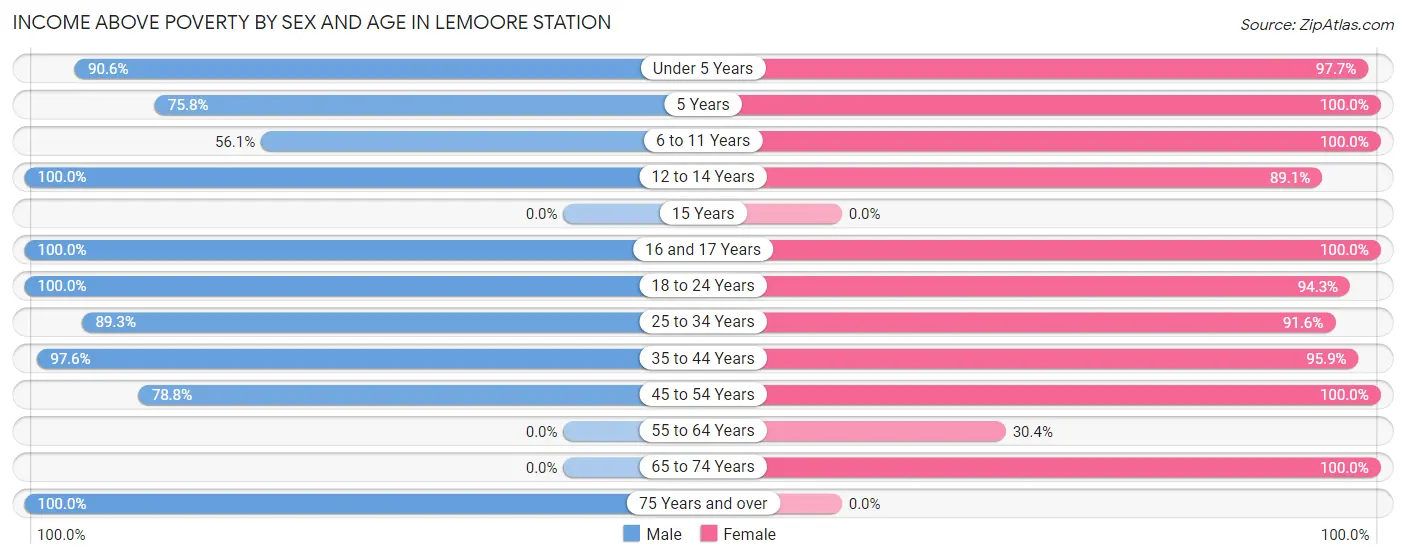
| Age Bracket | Male | Female |
| Under 5 Years | 435 (90.6%) | 379 (97.7%) |
| 5 Years | 25 (75.8%) | 46 (100.0%) |
| 6 to 11 Years | 248 (56.1%) | 215 (100.0%) |
| 12 to 14 Years | 47 (100.0%) | 82 (89.1%) |
| 15 Years | 0 (0.0%) | 0 (0.0%) |
| 16 and 17 Years | 43 (100.0%) | 11 (100.0%) |
| 18 to 24 Years | 208 (100.0%) | 282 (94.3%) |
| 25 to 34 Years | 473 (89.2%) | 488 (91.6%) |
| 35 to 44 Years | 455 (97.6%) | 397 (95.9%) |
| 45 to 54 Years | 104 (78.8%) | 192 (100.0%) |
| 55 to 64 Years | 0 (0.0%) | 14 (30.4%) |
| 65 to 74 Years | 0 (0.0%) | 9 (100.0%) |
| 75 Years and over | 7 (100.0%) | 0 (0.0%) |
| Total | 2,045 (85.6%) | 2,115 (94.2%) |
Income Below Poverty Among Married-Couple Families in Lemoore Station
The poverty statistics for married-couple families in Lemoore Station show that 3.2% or 41 of the total 1,267 families live below the poverty line. Families with 3 or 4 children have the highest poverty rate of 18.8%, comprising of 39 families. On the other hand, families with no children have the lowest poverty rate of 0.0%, which includes 0 families.
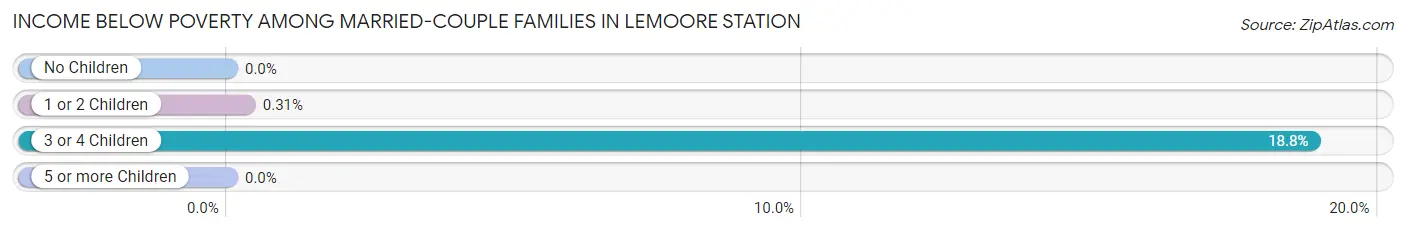
| Children | Above Poverty | Below Poverty |
| No Children | 420 (100.0%) | 0 (0.0%) |
| 1 or 2 Children | 638 (99.7%) | 2 (0.3%) |
| 3 or 4 Children | 168 (81.2%) | 39 (18.8%) |
| 5 or more Children | 0 (0.0%) | 0 (0.0%) |
| Total | 1,226 (96.8%) | 41 (3.2%) |
Income Below Poverty Among Single-Parent Households in Lemoore Station
According to the poverty data in Lemoore Station, 100.0% or 27 single-father households and 63.4% or 64 single-mother households are living below the poverty line. Among single-father households, those with 1 or 2 children have the highest poverty rate, with 27 households (100.0%) experiencing poverty. Likewise, among single-mother households, those with 1 or 2 children have the highest poverty rate, with 64 households (63.4%) falling below the poverty line.
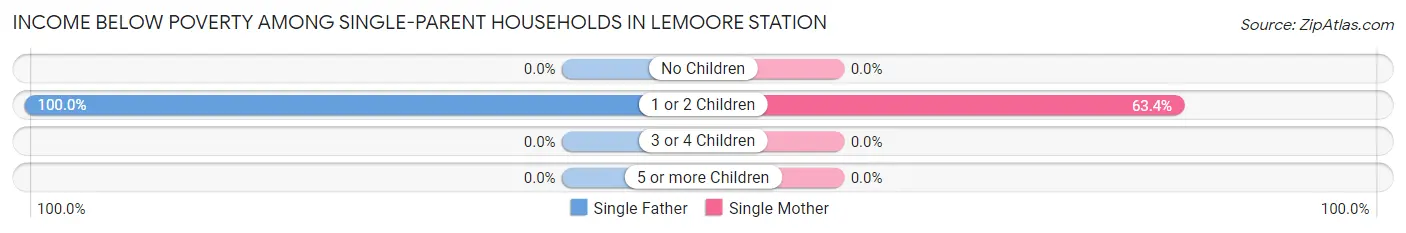
| Children | Single Father | Single Mother |
| No Children | 0 (0.0%) | 0 (0.0%) |
| 1 or 2 Children | 27 (100.0%) | 64 (63.4%) |
| 3 or 4 Children | 0 (0.0%) | 0 (0.0%) |
| 5 or more Children | 0 (0.0%) | 0 (0.0%) |
| Total | 27 (100.0%) | 64 (63.4%) |
Income Below Poverty Among Married-Couple vs Single-Parent Households in Lemoore Station
The poverty data for Lemoore Station shows that 41 of the married-couple family households (3.2%) and 91 of the single-parent households (71.1%) are living below the poverty level. Within the married-couple family households, those with 3 or 4 children have the highest poverty rate, with 39 households (18.8%) falling below the poverty line. Among the single-parent households, those with 1 or 2 children have the highest poverty rate, with 91 household (71.1%) living below poverty.
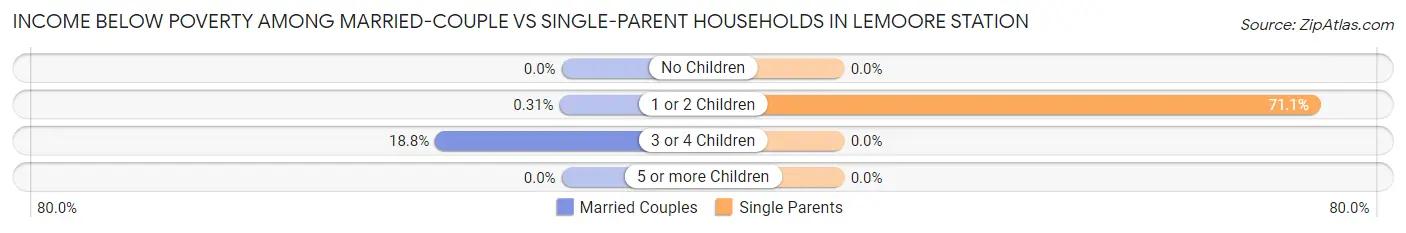
| Children | Married-Couple Families | Single-Parent Households |
| No Children | 0 (0.0%) | 0 (0.0%) |
| 1 or 2 Children | 2 (0.3%) | 91 (71.1%) |
| 3 or 4 Children | 39 (18.8%) | 0 (0.0%) |
| 5 or more Children | 0 (0.0%) | 0 (0.0%) |
| Total | 41 (3.2%) | 91 (71.1%) |
Race in Lemoore Station
The most populous races in Lemoore Station are White / Caucasian (3,572 | 55.8%), Hispanic or Latino (1,424 | 22.2%), and Black / African American (1,118 | 17.5%).
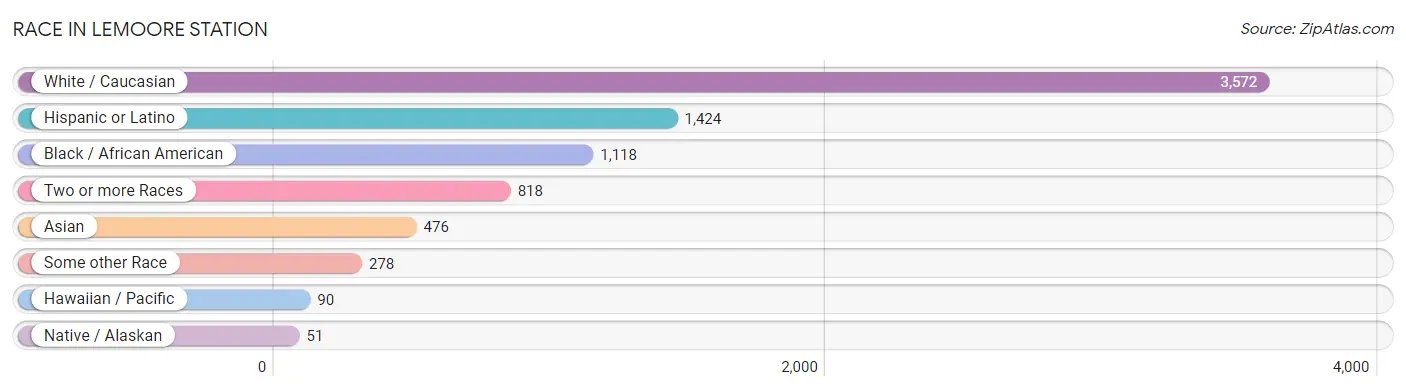
| Race | # Population | % Population |
| Asian | 476 | 7.4% |
| Black / African American | 1,118 | 17.5% |
| Hawaiian / Pacific | 90 | 1.4% |
| Hispanic or Latino | 1,424 | 22.2% |
| Native / Alaskan | 51 | 0.8% |
| White / Caucasian | 3,572 | 55.8% |
| Two or more Races | 818 | 12.8% |
| Some other Race | 278 | 4.3% |
| Total | 6,403 | 100.0% |
Ancestry in Lemoore Station
The most populous ancestries reported in Lemoore Station are Mexican (932 | 14.6%), English (575 | 9.0%), German (451 | 7.0%), European (387 | 6.0%), and Korean (343 | 5.4%), together accounting for 42.0% of all Lemoore Station residents.
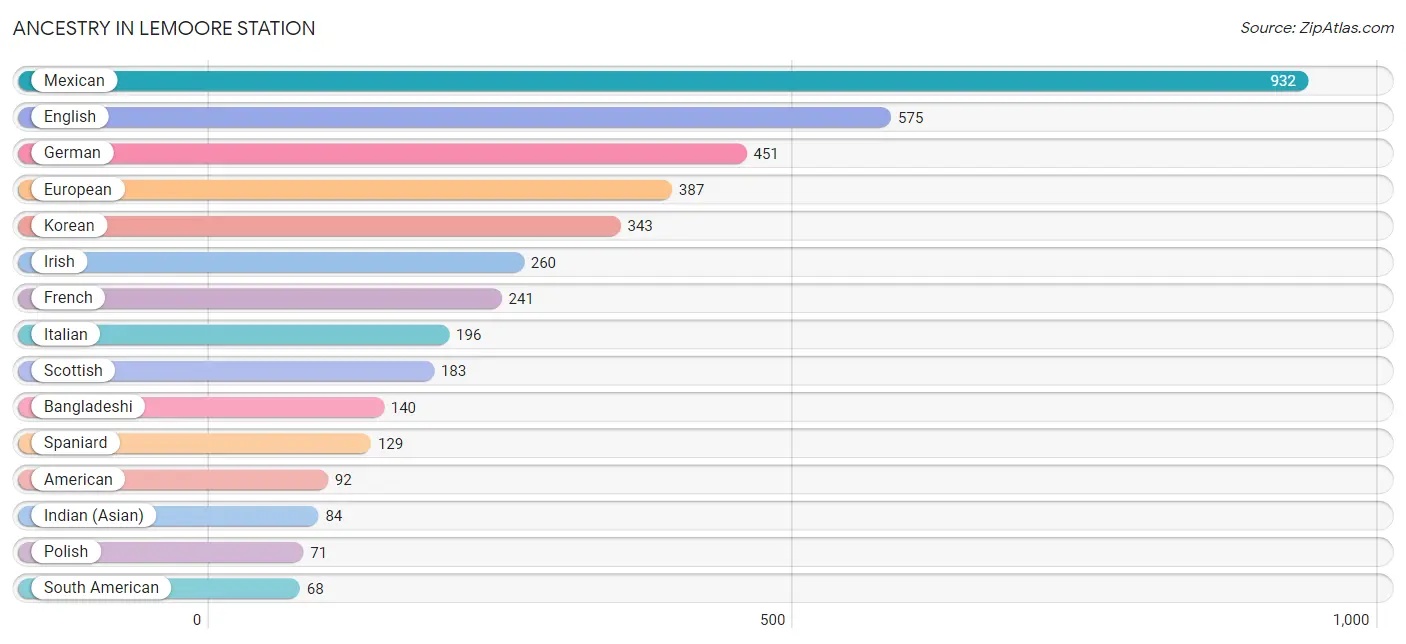
| Ancestry | # Population | % Population |
| American | 92 | 1.4% |
| Bangladeshi | 140 | 2.2% |
| Bhutanese | 50 | 0.8% |
| British | 16 | 0.3% |
| British West Indian | 26 | 0.4% |
| Burmese | 5 | 0.1% |
| Colombian | 32 | 0.5% |
| Danish | 38 | 0.6% |
| Dominican | 59 | 0.9% |
| Dutch | 54 | 0.8% |
| English | 575 | 9.0% |
| European | 387 | 6.0% |
| Finnish | 11 | 0.2% |
| French | 241 | 3.8% |
| German | 451 | 7.0% |
| Greek | 64 | 1.0% |
| Guamanian / Chamorro | 64 | 1.0% |
| Hungarian | 5 | 0.1% |
| Indian (Asian) | 84 | 1.3% |
| Irish | 260 | 4.1% |
| Iroquois | 18 | 0.3% |
| Italian | 196 | 3.1% |
| Japanese | 8 | 0.1% |
| Korean | 343 | 5.4% |
| Mexican | 932 | 14.6% |
| Mexican American Indian | 51 | 0.8% |
| Nigerian | 20 | 0.3% |
| Norwegian | 65 | 1.0% |
| Pakistani | 16 | 0.3% |
| Peruvian | 36 | 0.6% |
| Polish | 71 | 1.1% |
| Portuguese | 46 | 0.7% |
| Puerto Rican | 62 | 1.0% |
| Russian | 28 | 0.4% |
| Scandinavian | 7 | 0.1% |
| Scotch-Irish | 16 | 0.3% |
| Scottish | 183 | 2.9% |
| Slovak | 12 | 0.2% |
| South American | 68 | 1.1% |
| Spaniard | 129 | 2.0% |
| Spanish | 68 | 1.1% |
| Sri Lankan | 31 | 0.5% |
| Subsaharan African | 48 | 0.7% |
| Swedish | 13 | 0.2% |
| Swiss | 38 | 0.6% |
| Welsh | 29 | 0.4% |
| Zimbabwean | 28 | 0.4% | View All 47 Rows |
Immigrants in Lemoore Station
The most numerous immigrant groups reported in Lemoore Station came from Latin America (152 | 2.4%), Africa (92 | 1.4%), Peru (83 | 1.3%), South America (83 | 1.3%), and South Africa (59 | 0.9%), together accounting for 7.3% of all Lemoore Station residents.
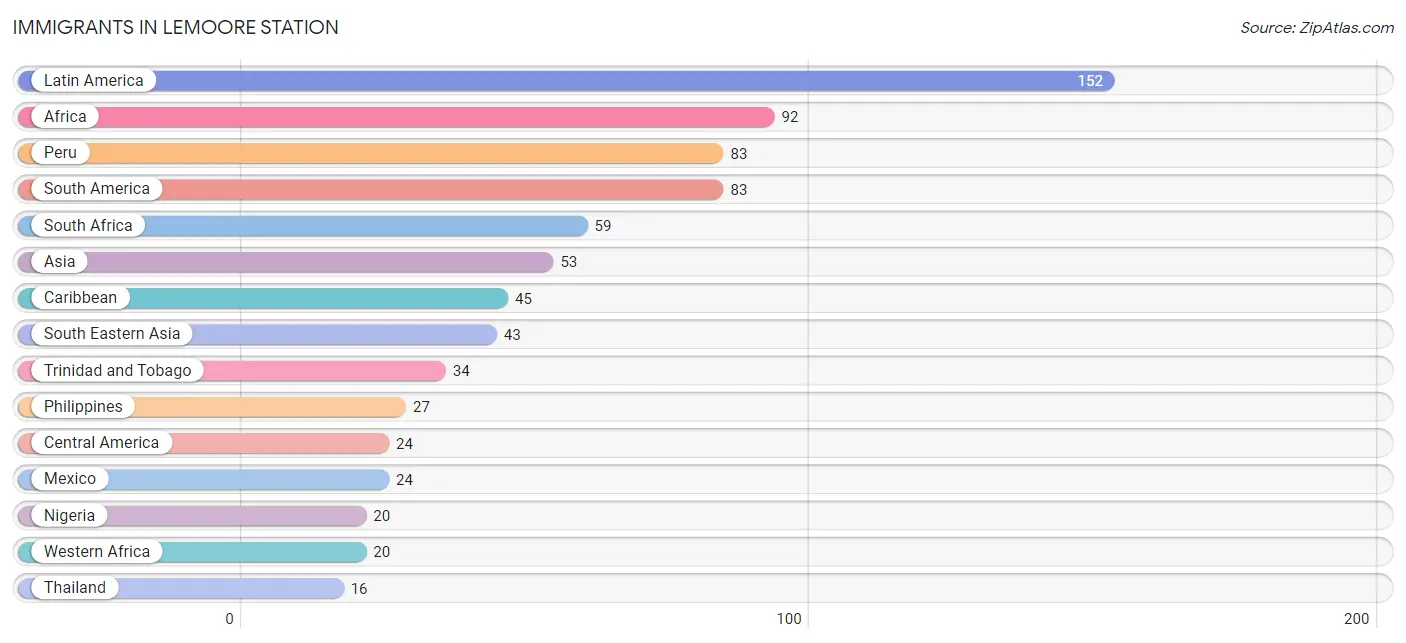
| Immigration Origin | # Population | % Population |
| Africa | 92 | 1.4% |
| Asia | 53 | 0.8% |
| Caribbean | 45 | 0.7% |
| Central America | 24 | 0.4% |
| Eastern Africa | 13 | 0.2% |
| Eastern Asia | 10 | 0.2% |
| Europe | 11 | 0.2% |
| Germany | 11 | 0.2% |
| Japan | 10 | 0.2% |
| Latin America | 152 | 2.4% |
| Mexico | 24 | 0.4% |
| Nigeria | 20 | 0.3% |
| Peru | 83 | 1.3% |
| Philippines | 27 | 0.4% |
| South Africa | 59 | 0.9% |
| South America | 83 | 1.3% |
| South Eastern Asia | 43 | 0.7% |
| Thailand | 16 | 0.3% |
| Trinidad and Tobago | 34 | 0.5% |
| Western Africa | 20 | 0.3% |
| Western Europe | 11 | 0.2% |
| Zimbabwe | 13 | 0.2% | View All 22 Rows |
Sex and Age in Lemoore Station
Sex and Age in Lemoore Station
The most populous age groups in Lemoore Station are 20 to 24 Years (1,020 | 26.2%) for men and 25 to 29 Years (448 | 17.9%) for women.
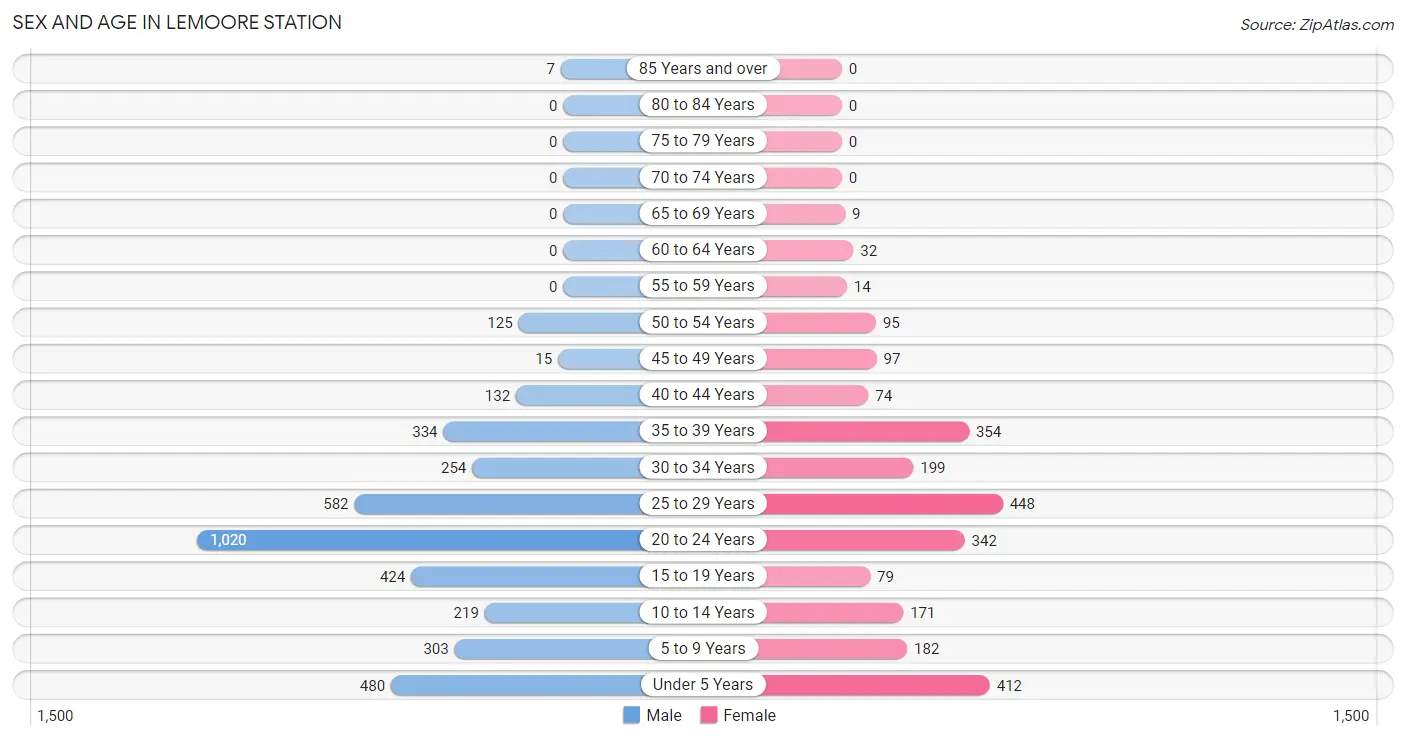
| Age Bracket | Male | Female |
| Under 5 Years | 480 (12.3%) | 412 (16.4%) |
| 5 to 9 Years | 303 (7.8%) | 182 (7.3%) |
| 10 to 14 Years | 219 (5.6%) | 171 (6.8%) |
| 15 to 19 Years | 424 (10.9%) | 79 (3.2%) |
| 20 to 24 Years | 1,020 (26.2%) | 342 (13.6%) |
| 25 to 29 Years | 582 (14.9%) | 448 (17.9%) |
| 30 to 34 Years | 254 (6.5%) | 199 (7.9%) |
| 35 to 39 Years | 334 (8.6%) | 354 (14.1%) |
| 40 to 44 Years | 132 (3.4%) | 74 (2.9%) |
| 45 to 49 Years | 15 (0.4%) | 97 (3.9%) |
| 50 to 54 Years | 125 (3.2%) | 95 (3.8%) |
| 55 to 59 Years | 0 (0.0%) | 14 (0.6%) |
| 60 to 64 Years | 0 (0.0%) | 32 (1.3%) |
| 65 to 69 Years | 0 (0.0%) | 9 (0.4%) |
| 70 to 74 Years | 0 (0.0%) | 0 (0.0%) |
| 75 to 79 Years | 0 (0.0%) | 0 (0.0%) |
| 80 to 84 Years | 0 (0.0%) | 0 (0.0%) |
| 85 Years and over | 7 (0.2%) | 0 (0.0%) |
| Total | 3,895 (100.0%) | 2,508 (100.0%) |
Families and Households in Lemoore Station
Median Family Size in Lemoore Station
The median family size in Lemoore Station is 3.27 persons per family, with married-couple families (1,267 | 90.8%) accounting for the largest median family size of 3.32 persons per family. On the other hand, single male/father families (27 | 1.9%) represent the smallest median family size with 2.44 persons per family.
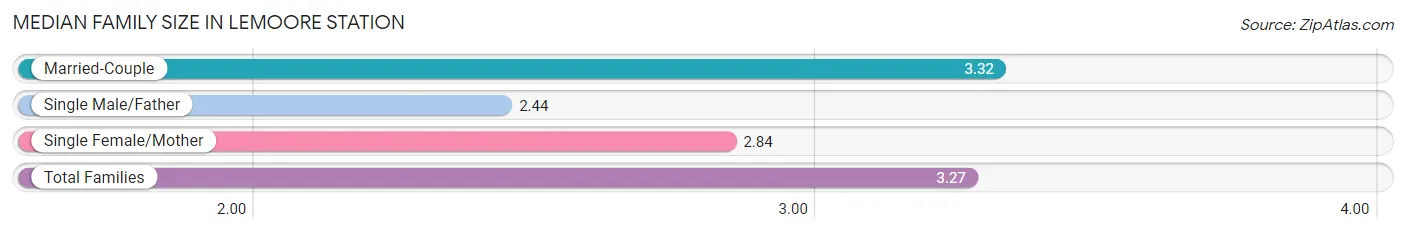
| Family Type | # Families | Family Size |
| Married-Couple | 1,267 (90.8%) | 3.32 |
| Single Male/Father | 27 (1.9%) | 2.44 |
| Single Female/Mother | 101 (7.2%) | 2.84 |
| Total Families | 1,395 (100.0%) | 3.27 |
Median Household Size in Lemoore Station
The median household size in Lemoore Station is 3.23 persons per household, with married-couple households (1,267 | 87.7%) accounting for the largest median household size of 3.34 persons per household. non-family households (49 | 3.4%) represent the smallest median household size with 1.53 persons per household.
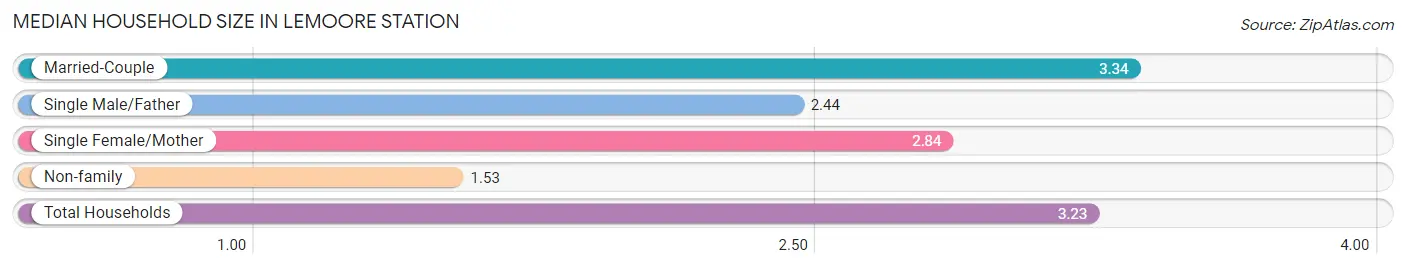
| Household Type | # Households | Household Size |
| Married-Couple | 1,267 (87.7%) | 3.34 |
| Single Male/Father | 27 (1.9%) | 2.44 |
| Single Female/Mother | 101 (7.0%) | 2.84 |
| Non-family | 49 (3.4%) | 1.53 |
| Total Households | 1,444 (100.0%) | 3.23 |
Household Size by Marriage Status in Lemoore Station
Out of a total of 1,444 households in Lemoore Station, 1,395 (96.6%) are family households, while 49 (3.4%) are nonfamily households. The most numerous type of family households are 2-person households, comprising 439, and the most common type of nonfamily households are 1-person households, comprising 42.
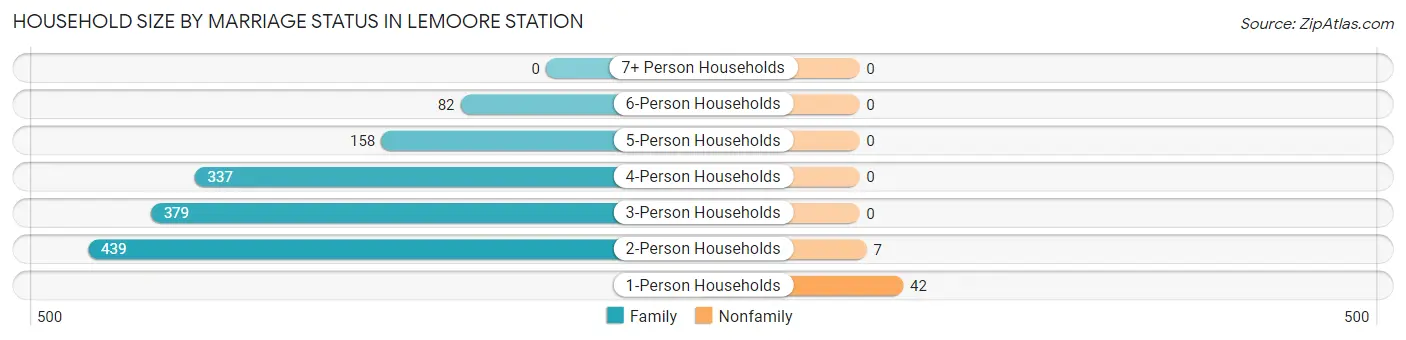
| Household Size | Family Households | Nonfamily Households |
| 1-Person Households | - | 42 (2.9%) |
| 2-Person Households | 439 (30.4%) | 7 (0.5%) |
| 3-Person Households | 379 (26.3%) | 0 (0.0%) |
| 4-Person Households | 337 (23.3%) | 0 (0.0%) |
| 5-Person Households | 158 (10.9%) | 0 (0.0%) |
| 6-Person Households | 82 (5.7%) | 0 (0.0%) |
| 7+ Person Households | 0 (0.0%) | 0 (0.0%) |
| Total | 1,395 (96.6%) | 49 (3.4%) |
Female Fertility in Lemoore Station
Fertility by Age in Lemoore Station
Average fertility rate in Lemoore Station is 93.0 births per 1,000 women. Women in the age bracket of 20 to 34 years have the highest fertility rate with 156.0 births per 1,000 women. Women in the age bracket of 20 to 34 years acount for 100.0% of all women with births.
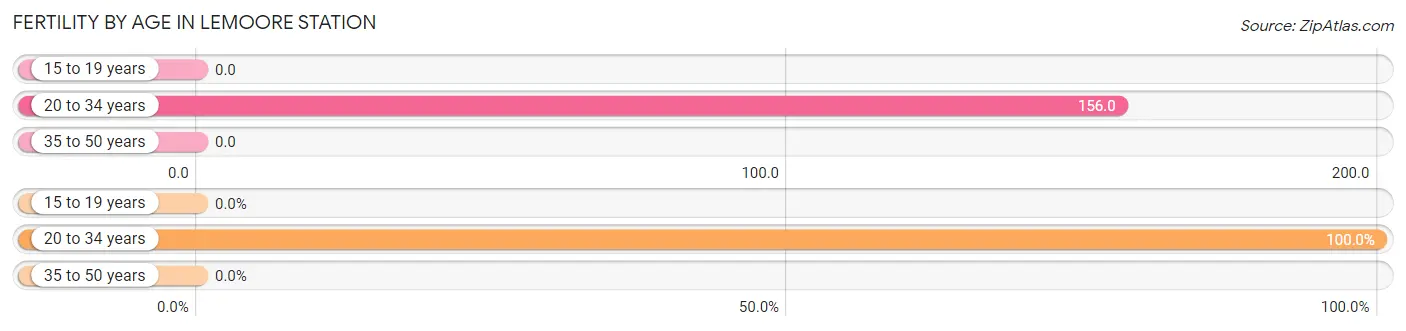
| Age Bracket | Women with Births | Births / 1,000 Women |
| 15 to 19 years | 0 (0.0%) | 0.0 |
| 20 to 34 years | 154 (100.0%) | 156.0 |
| 35 to 50 years | 0 (0.0%) | 0.0 |
| Total | 154 (100.0%) | 93.0 |
Fertility by Age by Marriage Status in Lemoore Station
92.9% of women with births (154) in Lemoore Station are married. The highest percentage of unmarried women with births falls into 20 to 34 years age bracket with 7.1% of them unmarried at the time of birth, while the lowest percentage of unmarried women with births belong to 20 to 34 years age bracket with 7.1% of them unmarried.
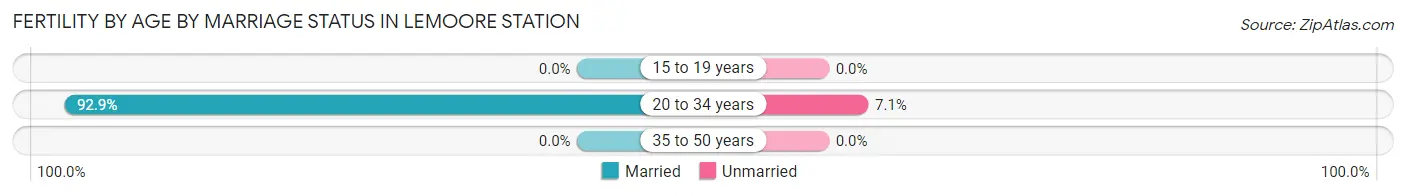
| Age Bracket | Married | Unmarried |
| 15 to 19 years | 0 (0.0%) | 0 (0.0%) |
| 20 to 34 years | 143 (92.9%) | 11 (7.1%) |
| 35 to 50 years | 0 (0.0%) | 0 (0.0%) |
| Total | 143 (92.9%) | 11 (7.1%) |
Fertility by Education in Lemoore Station
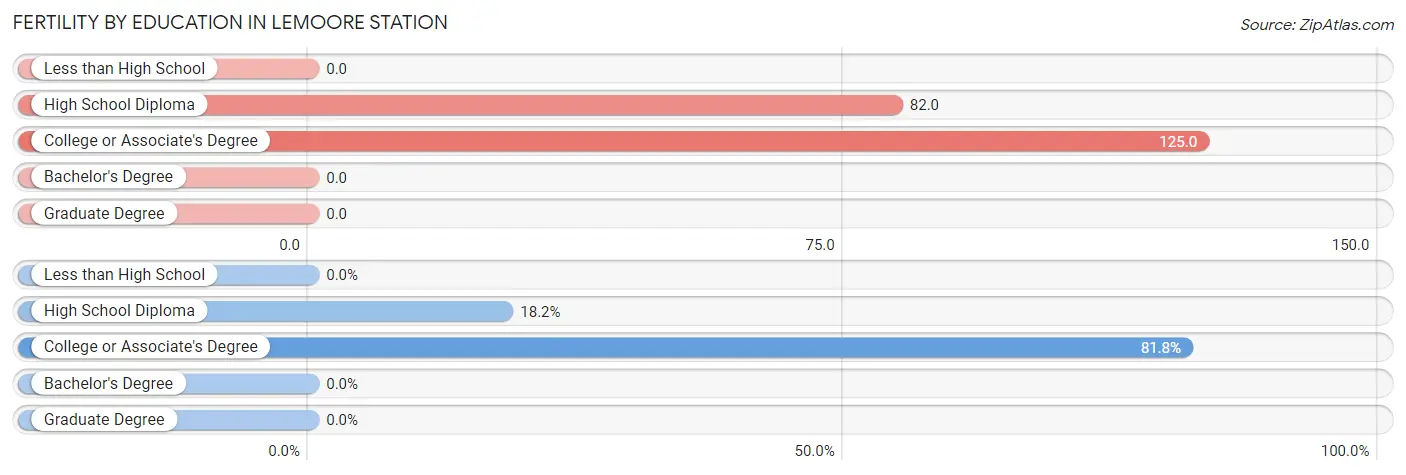
| Educational Attainment | Women with Births | Births / 1,000 Women |
| Less than High School | 0 (0.0%) | 0.0 |
| High School Diploma | 28 (18.2%) | 82.0 |
| College or Associate's Degree | 126 (81.8%) | 125.0 |
| Bachelor's Degree | 0 (0.0%) | 0.0 |
| Graduate Degree | 0 (0.0%) | 0.0 |
| Total | 154 (100.0%) | 93.0 |
Fertility by Education by Marriage Status in Lemoore Station
7.1% of women with births in Lemoore Station are unmarried. Women with the educational attainment of high school diploma are most likely to be married with 100.0% of them married at childbirth, while women with the educational attainment of college or associate's degree are least likely to be married with 8.7% of them unmarried at childbirth.
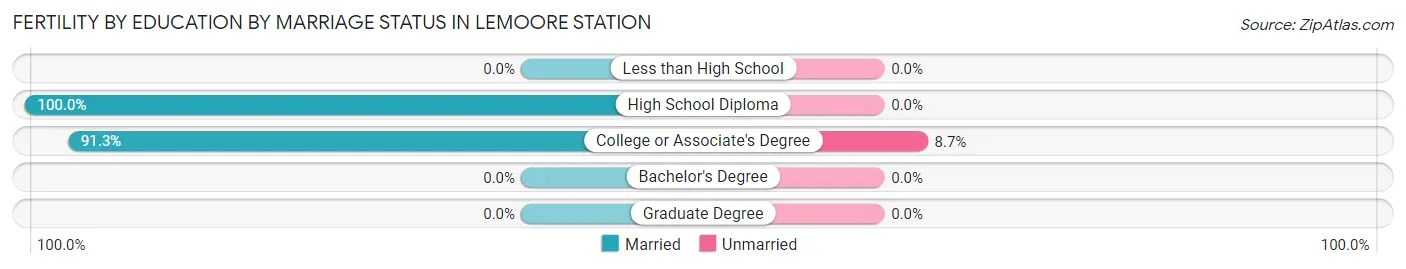
| Educational Attainment | Married | Unmarried |
| Less than High School | 0 (0.0%) | 0 (0.0%) |
| High School Diploma | 28 (100.0%) | 0 (0.0%) |
| College or Associate's Degree | 115 (91.3%) | 11 (8.7%) |
| Bachelor's Degree | 0 (0.0%) | 0 (0.0%) |
| Graduate Degree | 0 (0.0%) | 0 (0.0%) |
| Total | 143 (92.9%) | 11 (7.1%) |
Employment Characteristics in Lemoore Station
Employment by Class of Employer in Lemoore Station
Among the 3,610 employed individuals in Lemoore Station, federal government employees (3,023 | 83.7%), private company employees (356 | 9.9%), and self-employed (not incorporated) (121 | 3.4%) make up the most common classes of employment.
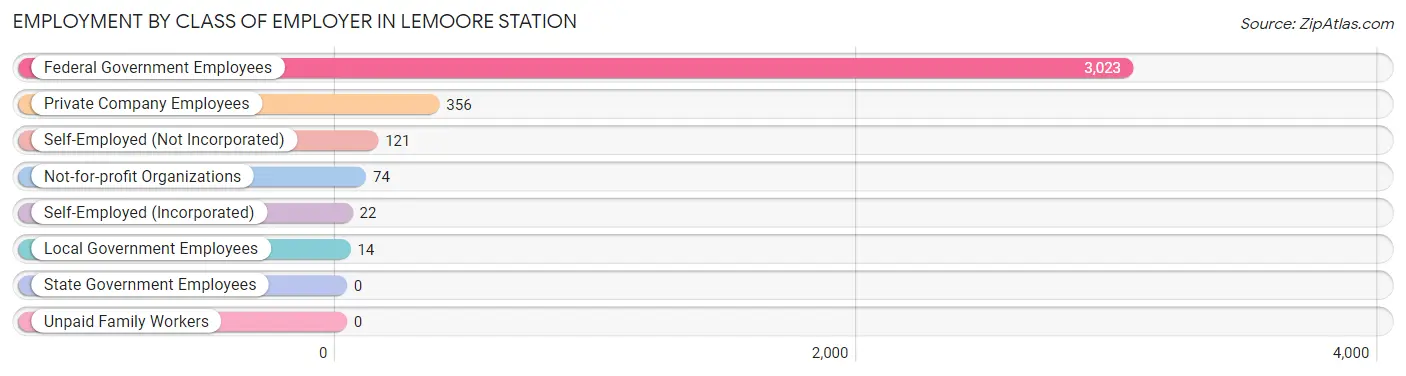
| Employer Class | # Employees | % Employees |
| Private Company Employees | 356 | 9.9% |
| Self-Employed (Incorporated) | 22 | 0.6% |
| Self-Employed (Not Incorporated) | 121 | 3.4% |
| Not-for-profit Organizations | 74 | 2.1% |
| Local Government Employees | 14 | 0.4% |
| State Government Employees | 0 | 0.0% |
| Federal Government Employees | 3,023 | 83.7% |
| Unpaid Family Workers | 0 | 0.0% |
| Total | 3,610 | 100.0% |
Employment Status by Age in Lemoore Station
According to the labor force statistics for Lemoore Station, out of the total population over 16 years of age (4,636), 80.9% or 3,751 individuals are in the labor force, with 8.9% or 334 of them unemployed. The age group with the highest labor force participation rate is 55 to 59 years, with 100.0% or 14 individuals in the labor force. Within the labor force, the 35 to 44 years age range has the highest percentage of unemployed individuals, with 27.2% or 161 of them being unemployed.
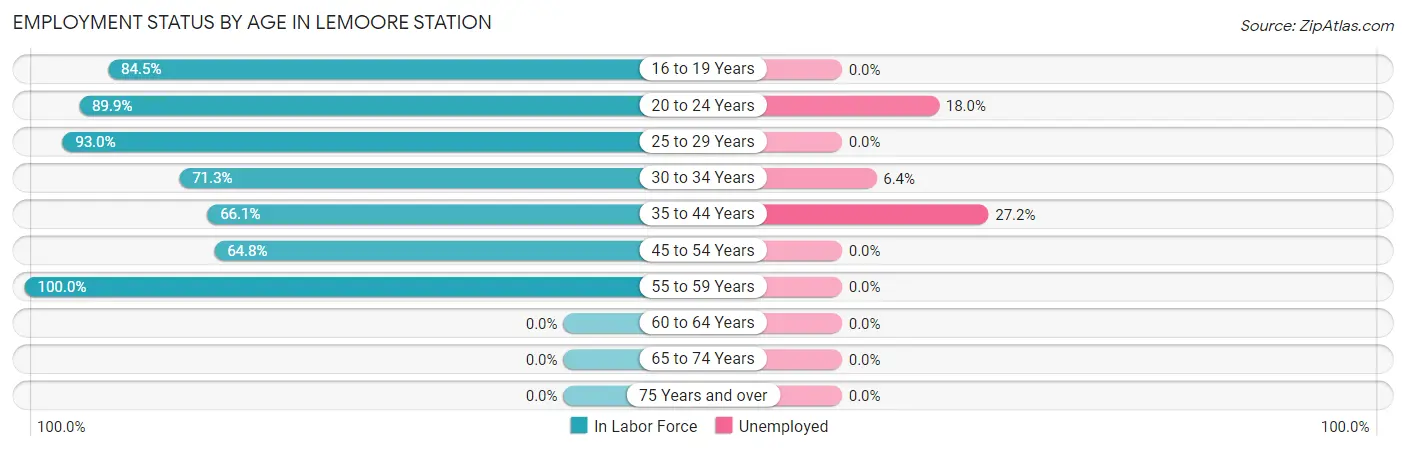
| Age Bracket | In Labor Force | Unemployed |
| 16 to 19 Years | 425 (84.5%) | 0 (0.0%) |
| 20 to 24 Years | 1,224 (89.9%) | 220 (18.0%) |
| 25 to 29 Years | 958 (93.0%) | 0 (0.0%) |
| 30 to 34 Years | 323 (71.3%) | 21 (6.4%) |
| 35 to 44 Years | 591 (66.1%) | 161 (27.2%) |
| 45 to 54 Years | 215 (64.8%) | 0 (0.0%) |
| 55 to 59 Years | 14 (100.0%) | 0 (0.0%) |
| 60 to 64 Years | 0 (0.0%) | 0 (0.0%) |
| 65 to 74 Years | 0 (0.0%) | 0 (0.0%) |
| 75 Years and over | 0 (0.0%) | 0 (0.0%) |
| Total | 3,751 (80.9%) | 334 (8.9%) |
Employment Status by Educational Attainment in Lemoore Station
According to labor force statistics for Lemoore Station, 76.3% of individuals (2,102) out of the total population between 25 and 64 years of age (2,755) are in the labor force, with 6.9% or 145 of them being unemployed. The group with the highest labor force participation rate are those with the educational attainment of college / associate degree, with 79.1% or 1,202 individuals in the labor force. Within the labor force, individuals with college / associate degree education have the highest percentage of unemployment, with 10.6% or 127 of them being unemployed.
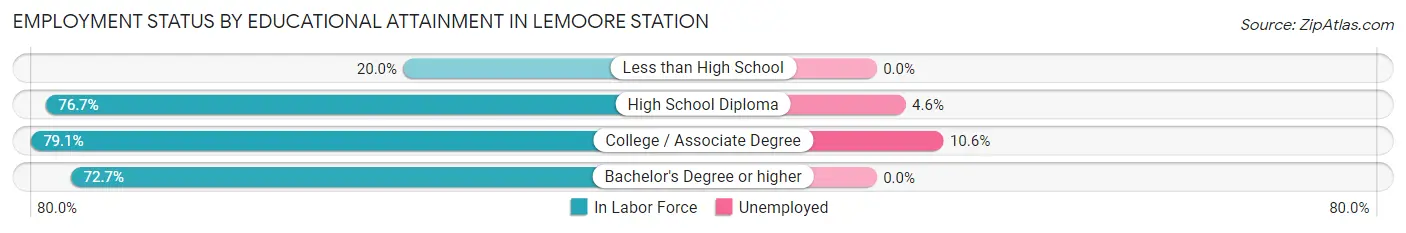
| Educational Attainment | In Labor Force | Unemployed |
| Less than High School | 10 (20.0%) | 0 (0.0%) |
| High School Diploma | 542 (76.7%) | 33 (4.6%) |
| College / Associate Degree | 1,202 (79.1%) | 161 (10.6%) |
| Bachelor's Degree or higher | 348 (72.7%) | 0 (0.0%) |
| Total | 2,102 (76.3%) | 190 (6.9%) |
Employment Occupations by Sex in Lemoore Station
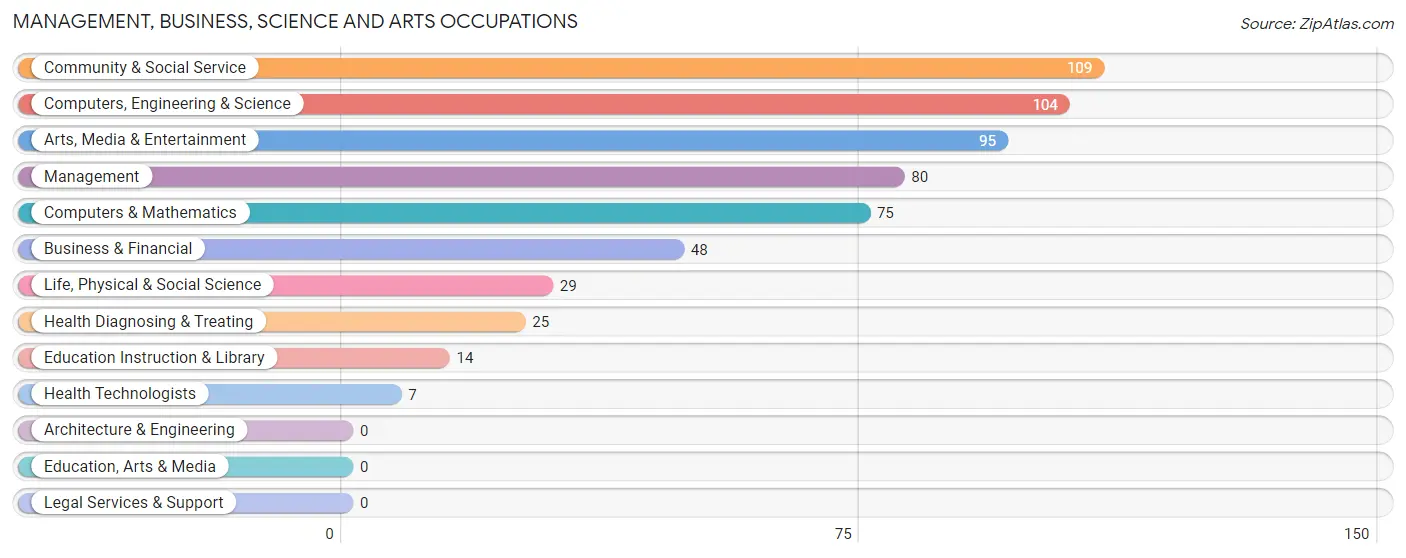
Management, Business, Science and Arts Occupations
The most common Management, Business, Science and Arts occupations in Lemoore Station are Community & Social Service (109 | 12.9%), Computers, Engineering & Science (104 | 12.3%), Arts, Media & Entertainment (95 | 11.3%), Management (80 | 9.5%), and Computers & Mathematics (75 | 8.9%).
Management, Business, Science and Arts Occupations by Sex
Within the Management, Business, Science and Arts occupations in Lemoore Station, the most male-oriented occupations are Computers & Mathematics (73.3%), Computers, Engineering & Science (52.9%), and Management (42.5%), while the most female-oriented occupations are Business & Financial (100.0%), Life, Physical & Social Science (100.0%), and Community & Social Service (100.0%).
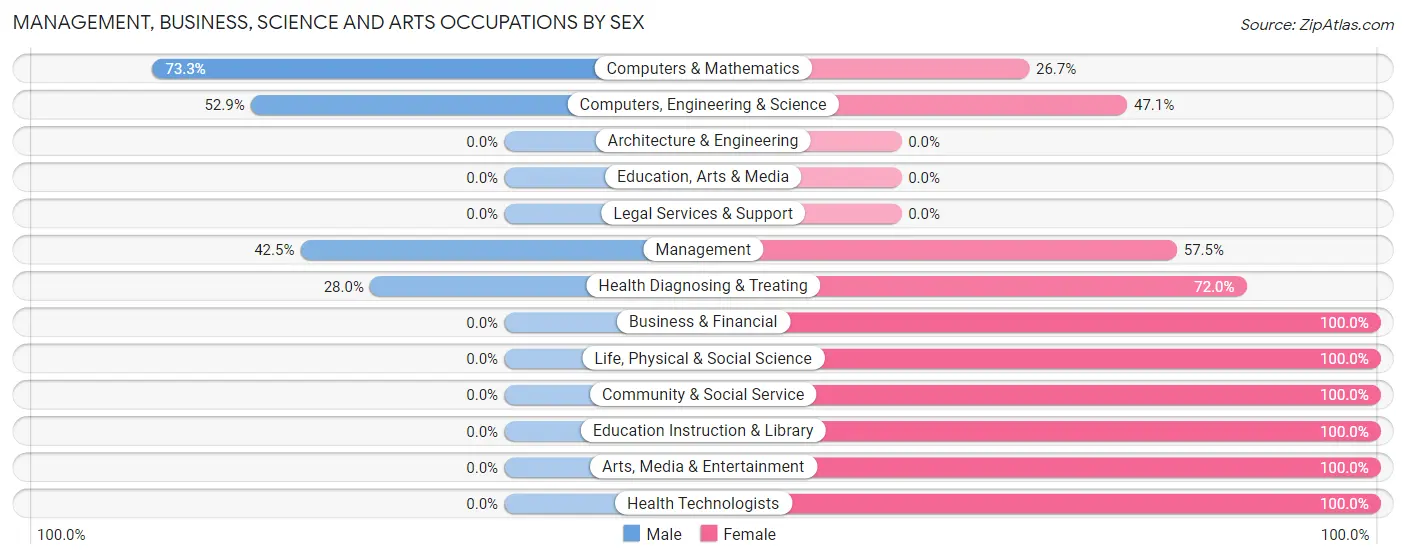
| Occupation | Male | Female |
| Management | 34 (42.5%) | 46 (57.5%) |
| Business & Financial | 0 (0.0%) | 48 (100.0%) |
| Computers, Engineering & Science | 55 (52.9%) | 49 (47.1%) |
| Computers & Mathematics | 55 (73.3%) | 20 (26.7%) |
| Architecture & Engineering | 0 (0.0%) | 0 (0.0%) |
| Life, Physical & Social Science | 0 (0.0%) | 29 (100.0%) |
| Community & Social Service | 0 (0.0%) | 109 (100.0%) |
| Education, Arts & Media | 0 (0.0%) | 0 (0.0%) |
| Legal Services & Support | 0 (0.0%) | 0 (0.0%) |
| Education Instruction & Library | 0 (0.0%) | 14 (100.0%) |
| Arts, Media & Entertainment | 0 (0.0%) | 95 (100.0%) |
| Health Diagnosing & Treating | 7 (28.0%) | 18 (72.0%) |
| Health Technologists | 0 (0.0%) | 7 (100.0%) |
| Total (Category) | 96 (26.2%) | 270 (73.8%) |
| Total (Overall) | 253 (30.0%) | 590 (70.0%) |
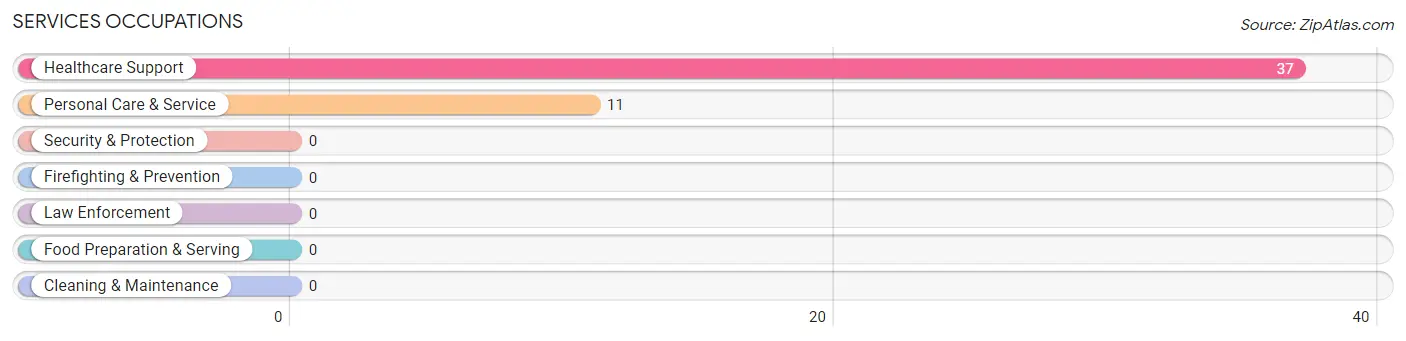
Services Occupations
The most common Services occupations in Lemoore Station are Healthcare Support (37 | 4.4%), and Personal Care & Service (11 | 1.3%).
Services Occupations by Sex
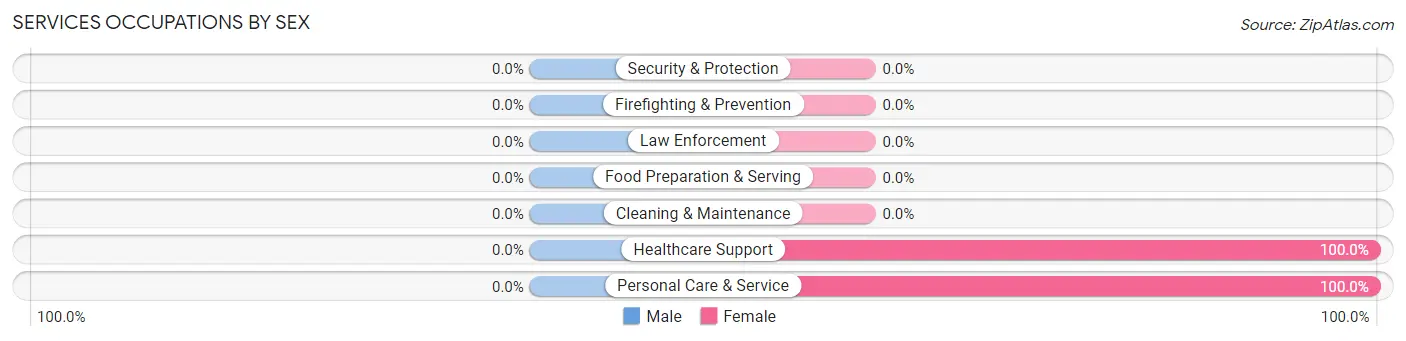
| Occupation | Male | Female |
| Healthcare Support | 0 (0.0%) | 37 (100.0%) |
| Security & Protection | 0 (0.0%) | 0 (0.0%) |
| Firefighting & Prevention | 0 (0.0%) | 0 (0.0%) |
| Law Enforcement | 0 (0.0%) | 0 (0.0%) |
| Food Preparation & Serving | 0 (0.0%) | 0 (0.0%) |
| Cleaning & Maintenance | 0 (0.0%) | 0 (0.0%) |
| Personal Care & Service | 0 (0.0%) | 11 (100.0%) |
| Total (Category) | 0 (0.0%) | 48 (100.0%) |
| Total (Overall) | 253 (30.0%) | 590 (70.0%) |
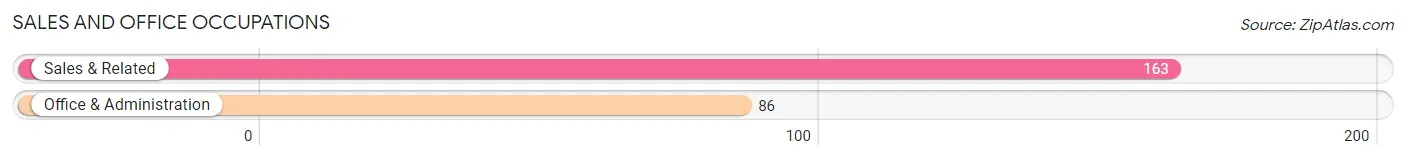
Sales and Office Occupations
The most common Sales and Office occupations in Lemoore Station are Sales & Related (163 | 19.3%), and Office & Administration (86 | 10.2%).
Sales and Office Occupations by Sex
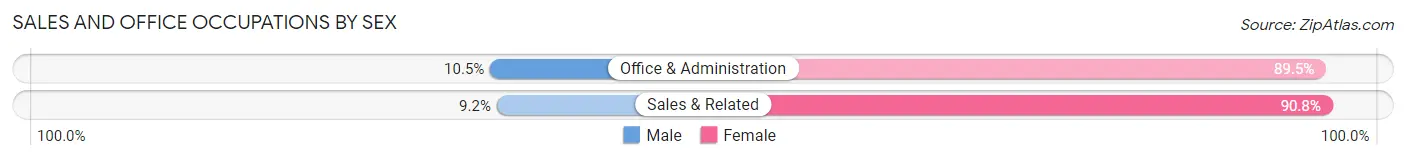
| Occupation | Male | Female |
| Sales & Related | 15 (9.2%) | 148 (90.8%) |
| Office & Administration | 9 (10.5%) | 77 (89.5%) |
| Total (Category) | 24 (9.6%) | 225 (90.4%) |
| Total (Overall) | 253 (30.0%) | 590 (70.0%) |
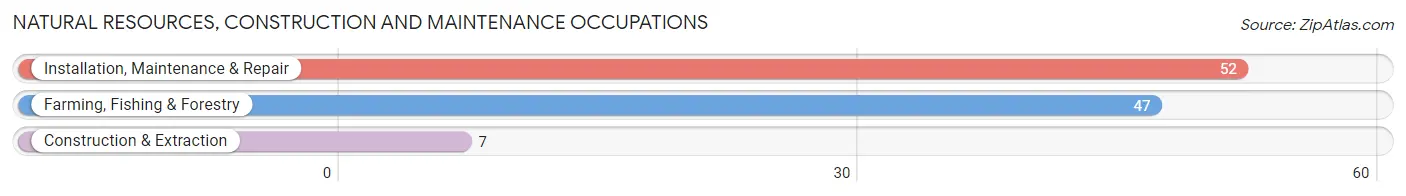
Natural Resources, Construction and Maintenance Occupations
The most common Natural Resources, Construction and Maintenance occupations in Lemoore Station are Installation, Maintenance & Repair (52 | 6.2%), Farming, Fishing & Forestry (47 | 5.6%), and Construction & Extraction (7 | 0.8%).
Natural Resources, Construction and Maintenance Occupations by Sex
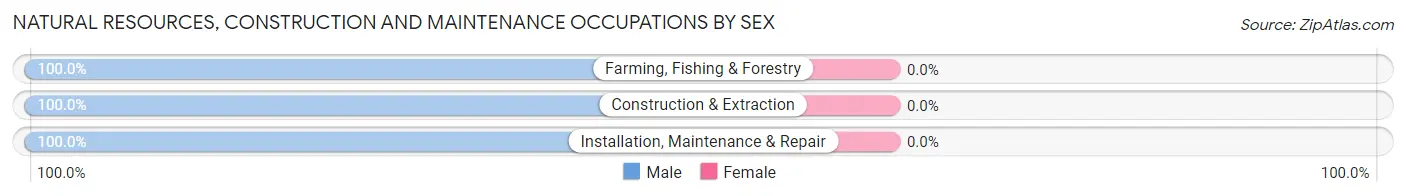
| Occupation | Male | Female |
| Farming, Fishing & Forestry | 47 (100.0%) | 0 (0.0%) |
| Construction & Extraction | 7 (100.0%) | 0 (0.0%) |
| Installation, Maintenance & Repair | 52 (100.0%) | 0 (0.0%) |
| Total (Category) | 106 (100.0%) | 0 (0.0%) |
| Total (Overall) | 253 (30.0%) | 590 (70.0%) |
Production, Transportation and Moving Occupations
The most common Production, Transportation and Moving occupations in Lemoore Station are Production (47 | 5.6%), and Material Moving (27 | 3.2%).
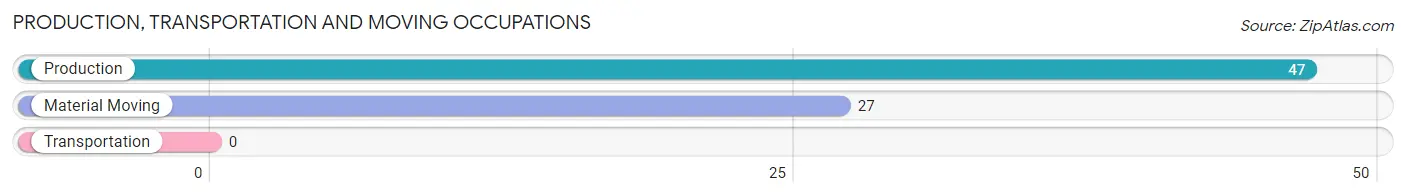
Production, Transportation and Moving Occupations by Sex
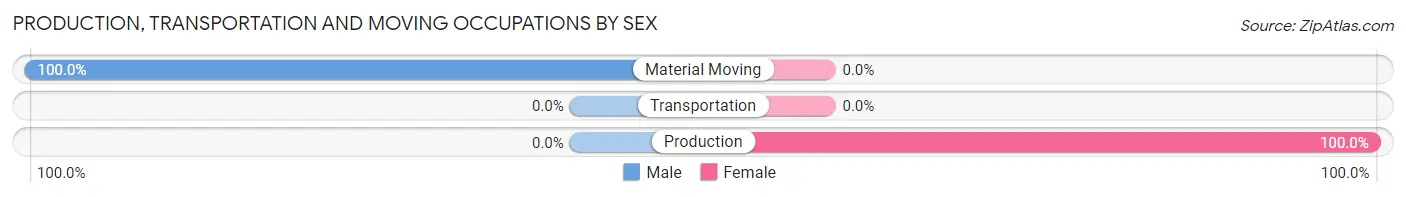
| Occupation | Male | Female |
| Production | 0 (0.0%) | 47 (100.0%) |
| Transportation | 0 (0.0%) | 0 (0.0%) |
| Material Moving | 27 (100.0%) | 0 (0.0%) |
| Total (Category) | 27 (36.5%) | 47 (63.5%) |
| Total (Overall) | 253 (30.0%) | 590 (70.0%) |
Employment Industries by Sex in Lemoore Station
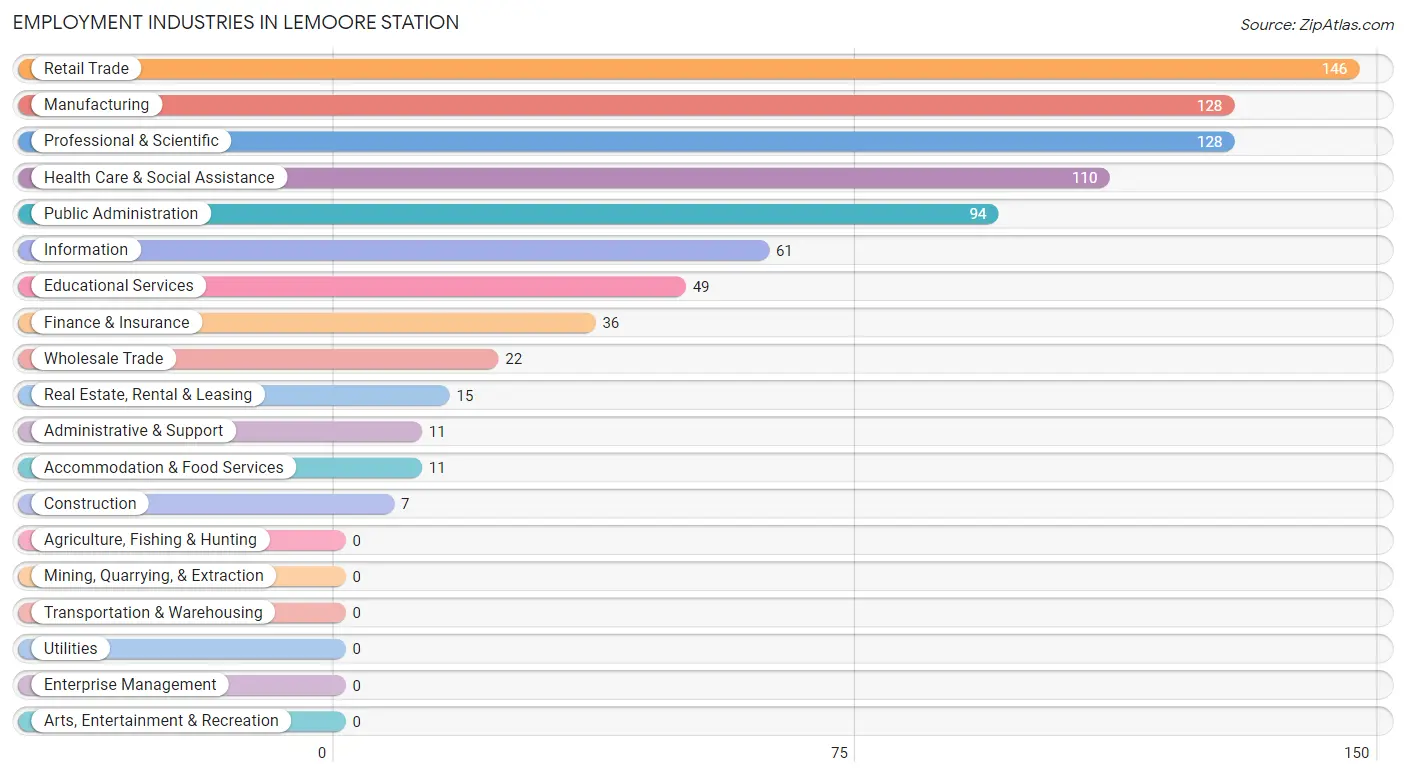
Employment Industries in Lemoore Station
The major employment industries in Lemoore Station include Retail Trade (146 | 17.3%), Manufacturing (128 | 15.2%), Professional & Scientific (128 | 15.2%), Health Care & Social Assistance (110 | 13.1%), and Public Administration (94 | 11.2%).
Employment Industries by Sex in Lemoore Station
The Lemoore Station industries that see more men than women are Construction (100.0%), Real Estate, Rental & Leasing (100.0%), and Educational Services (71.4%), whereas the industries that tend to have a higher number of women are Wholesale Trade (100.0%), Information (100.0%), and Finance & Insurance (100.0%).
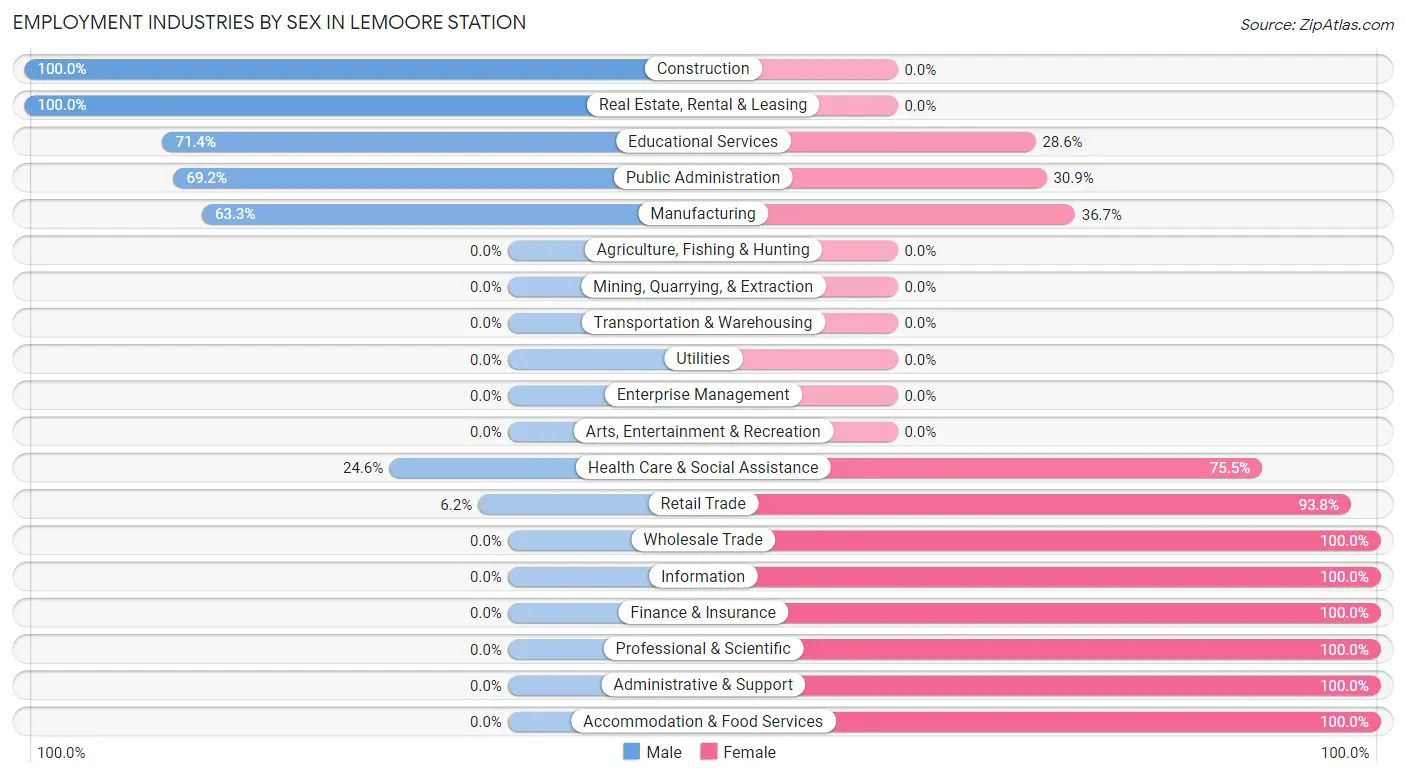
| Industry | Male | Female |
| Agriculture, Fishing & Hunting | 0 (0.0%) | 0 (0.0%) |
| Mining, Quarrying, & Extraction | 0 (0.0%) | 0 (0.0%) |
| Construction | 7 (100.0%) | 0 (0.0%) |
| Manufacturing | 81 (63.3%) | 47 (36.7%) |
| Wholesale Trade | 0 (0.0%) | 22 (100.0%) |
| Retail Trade | 9 (6.2%) | 137 (93.8%) |
| Transportation & Warehousing | 0 (0.0%) | 0 (0.0%) |
| Utilities | 0 (0.0%) | 0 (0.0%) |
| Information | 0 (0.0%) | 61 (100.0%) |
| Finance & Insurance | 0 (0.0%) | 36 (100.0%) |
| Real Estate, Rental & Leasing | 15 (100.0%) | 0 (0.0%) |
| Professional & Scientific | 0 (0.0%) | 128 (100.0%) |
| Enterprise Management | 0 (0.0%) | 0 (0.0%) |
| Administrative & Support | 0 (0.0%) | 11 (100.0%) |
| Educational Services | 35 (71.4%) | 14 (28.6%) |
| Health Care & Social Assistance | 27 (24.5%) | 83 (75.4%) |
| Arts, Entertainment & Recreation | 0 (0.0%) | 0 (0.0%) |
| Accommodation & Food Services | 0 (0.0%) | 11 (100.0%) |
| Public Administration | 65 (69.2%) | 29 (30.8%) |
| Total | 253 (30.0%) | 590 (70.0%) |
Education in Lemoore Station
School Enrollment in Lemoore Station
The most common levels of schooling among the 1,613 students in Lemoore Station are college / undergraduate (474 | 29.4%), elementary school (463 | 28.7%), and middle school (257 | 15.9%).
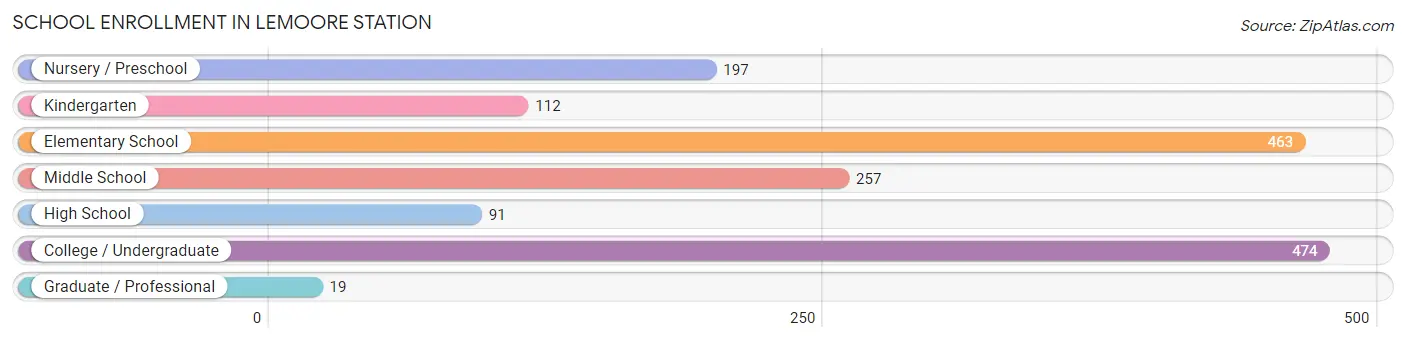
| School Level | # Students | % Students |
| Nursery / Preschool | 197 | 12.2% |
| Kindergarten | 112 | 6.9% |
| Elementary School | 463 | 28.7% |
| Middle School | 257 | 15.9% |
| High School | 91 | 5.6% |
| College / Undergraduate | 474 | 29.4% |
| Graduate / Professional | 19 | 1.2% |
| Total | 1,613 | 100.0% |
School Enrollment by Age by Funding Source in Lemoore Station
Out of a total of 1,613 students who are enrolled in schools in Lemoore Station, 103 (6.4%) attend a private institution, while the remaining 1,510 (93.6%) are enrolled in public schools. The age group of 20 to 24 year olds has the highest likelihood of being enrolled in private schools, with 31 (24.4% in the age bracket) enrolled. Conversely, the age group of 5 to 9 year old has the lowest likelihood of being enrolled in a private school, with 468 (100.0% in the age bracket) attending a public institution.
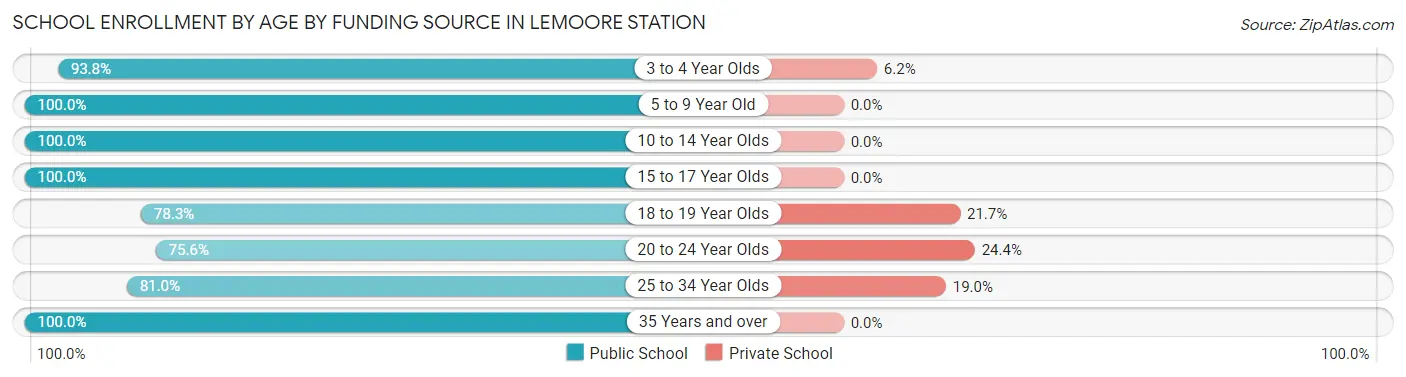
| Age Bracket | Public School | Private School |
| 3 to 4 Year Olds | 182 (93.8%) | 12 (6.2%) |
| 5 to 9 Year Old | 468 (100.0%) | 0 (0.0%) |
| 10 to 14 Year Olds | 381 (100.0%) | 0 (0.0%) |
| 15 to 17 Year Olds | 54 (100.0%) | 0 (0.0%) |
| 18 to 19 Year Olds | 47 (78.3%) | 13 (21.7%) |
| 20 to 24 Year Olds | 96 (75.6%) | 31 (24.4%) |
| 25 to 34 Year Olds | 200 (81.0%) | 47 (19.0%) |
| 35 Years and over | 82 (100.0%) | 0 (0.0%) |
| Total | 1,510 (93.6%) | 103 (6.4%) |
Educational Attainment by Field of Study in Lemoore Station
Business (89 | 15.8%), liberal arts & history (68 | 12.1%), arts & humanities (54 | 9.6%), visual & performing arts (52 | 9.2%), and science & technology (48 | 8.5%) are the most common fields of study among 564 individuals in Lemoore Station who have obtained a bachelor's degree or higher.
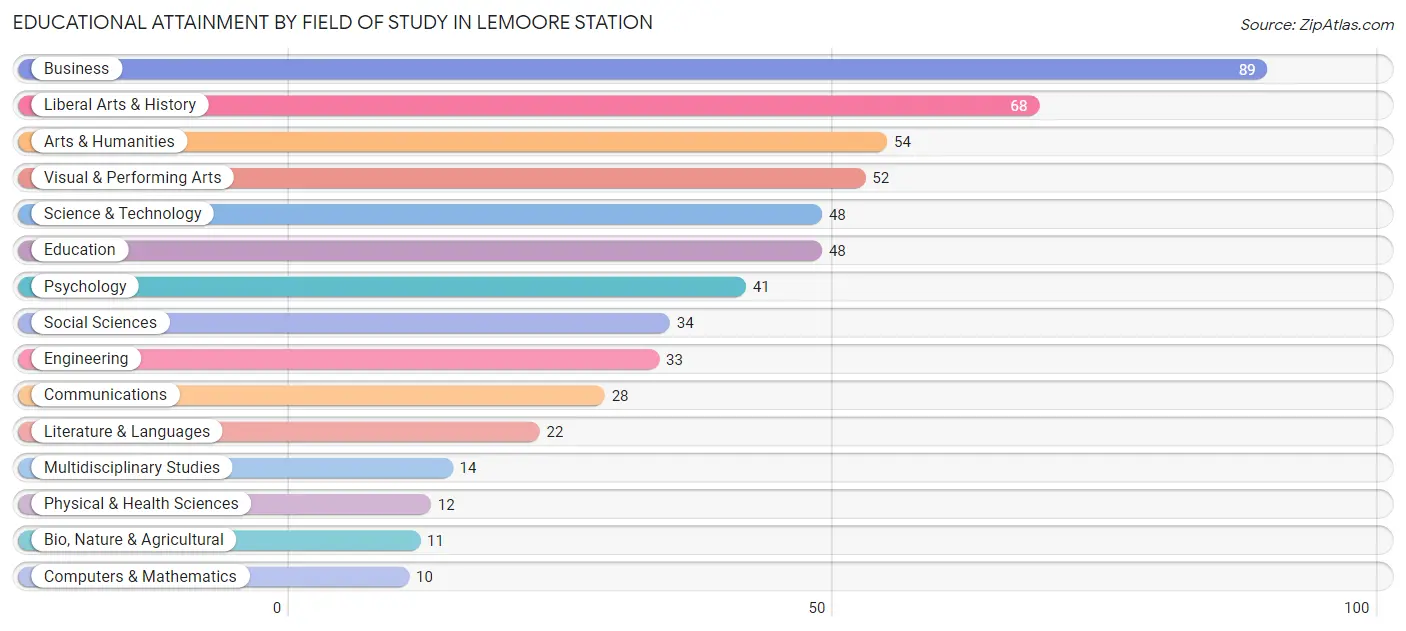
| Field of Study | # Graduates | % Graduates |
| Computers & Mathematics | 10 | 1.8% |
| Bio, Nature & Agricultural | 11 | 1.9% |
| Physical & Health Sciences | 12 | 2.1% |
| Psychology | 41 | 7.3% |
| Social Sciences | 34 | 6.0% |
| Engineering | 33 | 5.9% |
| Multidisciplinary Studies | 14 | 2.5% |
| Science & Technology | 48 | 8.5% |
| Business | 89 | 15.8% |
| Education | 48 | 8.5% |
| Literature & Languages | 22 | 3.9% |
| Liberal Arts & History | 68 | 12.1% |
| Visual & Performing Arts | 52 | 9.2% |
| Communications | 28 | 5.0% |
| Arts & Humanities | 54 | 9.6% |
| Total | 564 | 100.0% |
Transportation & Commute in Lemoore Station
Vehicle Availability by Sex in Lemoore Station
The most prevalent vehicle ownership categories in Lemoore Station are males with 2 vehicles (847, accounting for 70.3%) and females with 2 vehicles (507, making up 128.5%).
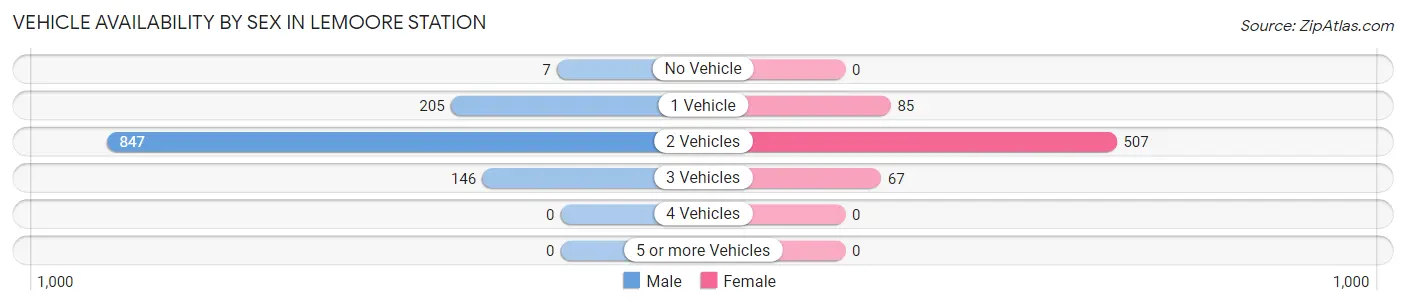
| Vehicles Available | Male | Female |
| No Vehicle | 7 (0.6%) | 0 (0.0%) |
| 1 Vehicle | 205 (17.0%) | 85 (12.9%) |
| 2 Vehicles | 847 (70.3%) | 507 (76.9%) |
| 3 Vehicles | 146 (12.1%) | 67 (10.2%) |
| 4 Vehicles | 0 (0.0%) | 0 (0.0%) |
| 5 or more Vehicles | 0 (0.0%) | 0 (0.0%) |
| Total | 1,205 (100.0%) | 659 (100.0%) |
Commute Time in Lemoore Station
The most frequently occuring commute durations in Lemoore Station are 5 to 9 minutes (788 commuters, 23.1%), 15 to 19 minutes (761 commuters, 22.3%), and 20 to 24 minutes (647 commuters, 19.0%).
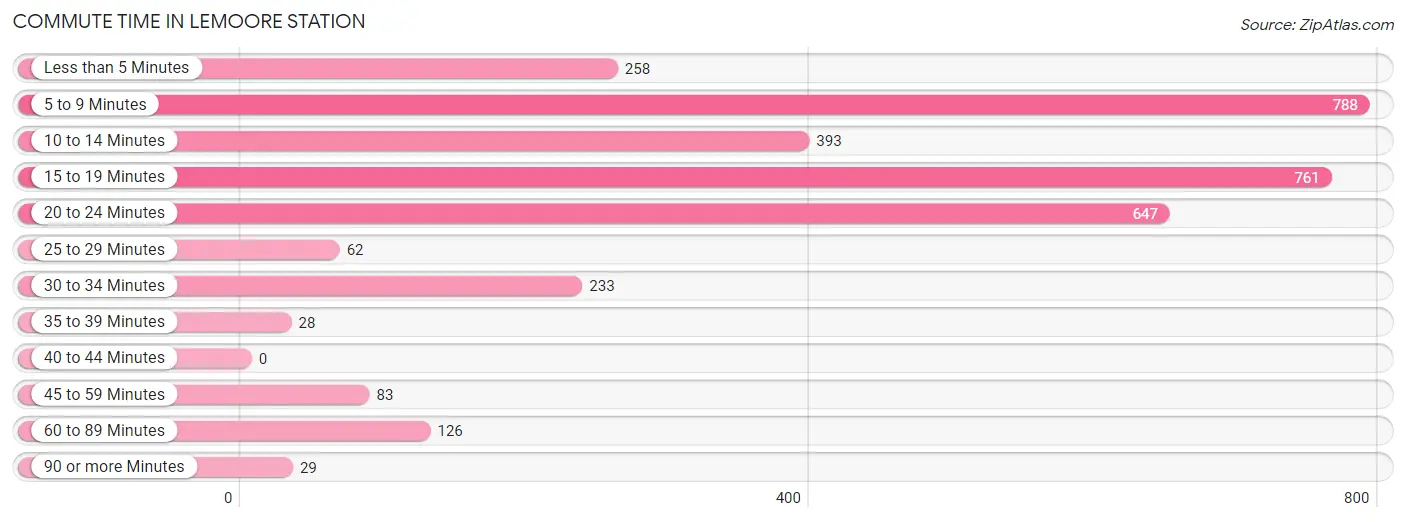
| Commute Time | # Commuters | % Commuters |
| Less than 5 Minutes | 258 | 7.6% |
| 5 to 9 Minutes | 788 | 23.1% |
| 10 to 14 Minutes | 393 | 11.5% |
| 15 to 19 Minutes | 761 | 22.3% |
| 20 to 24 Minutes | 647 | 19.0% |
| 25 to 29 Minutes | 62 | 1.8% |
| 30 to 34 Minutes | 233 | 6.8% |
| 35 to 39 Minutes | 28 | 0.8% |
| 40 to 44 Minutes | 0 | 0.0% |
| 45 to 59 Minutes | 83 | 2.4% |
| 60 to 89 Minutes | 126 | 3.7% |
| 90 or more Minutes | 29 | 0.9% |
Commute Time by Sex in Lemoore Station
The most common commute times in Lemoore Station are 15 to 19 minutes (747 commuters, 27.5%) for males and 5 to 9 minutes (210 commuters, 30.2%) for females.
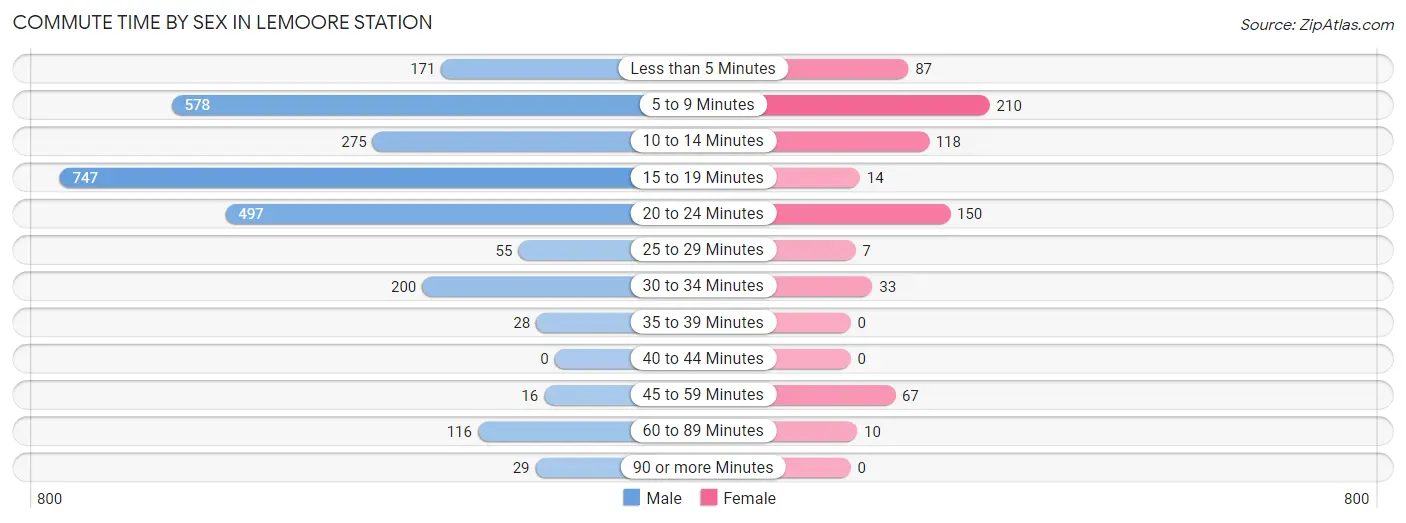
| Commute Time | Male | Female |
| Less than 5 Minutes | 171 (6.3%) | 87 (12.5%) |
| 5 to 9 Minutes | 578 (21.3%) | 210 (30.2%) |
| 10 to 14 Minutes | 275 (10.1%) | 118 (17.0%) |
| 15 to 19 Minutes | 747 (27.5%) | 14 (2.0%) |
| 20 to 24 Minutes | 497 (18.3%) | 150 (21.5%) |
| 25 to 29 Minutes | 55 (2.0%) | 7 (1.0%) |
| 30 to 34 Minutes | 200 (7.4%) | 33 (4.7%) |
| 35 to 39 Minutes | 28 (1.0%) | 0 (0.0%) |
| 40 to 44 Minutes | 0 (0.0%) | 0 (0.0%) |
| 45 to 59 Minutes | 16 (0.6%) | 67 (9.6%) |
| 60 to 89 Minutes | 116 (4.3%) | 10 (1.4%) |
| 90 or more Minutes | 29 (1.1%) | 0 (0.0%) |
Time of Departure to Work by Sex in Lemoore Station
The most frequent times of departure to work in Lemoore Station are 7:00 AM to 7:29 AM (540, 19.9%) for males and 7:30 AM to 7:59 AM (142, 20.4%) for females.
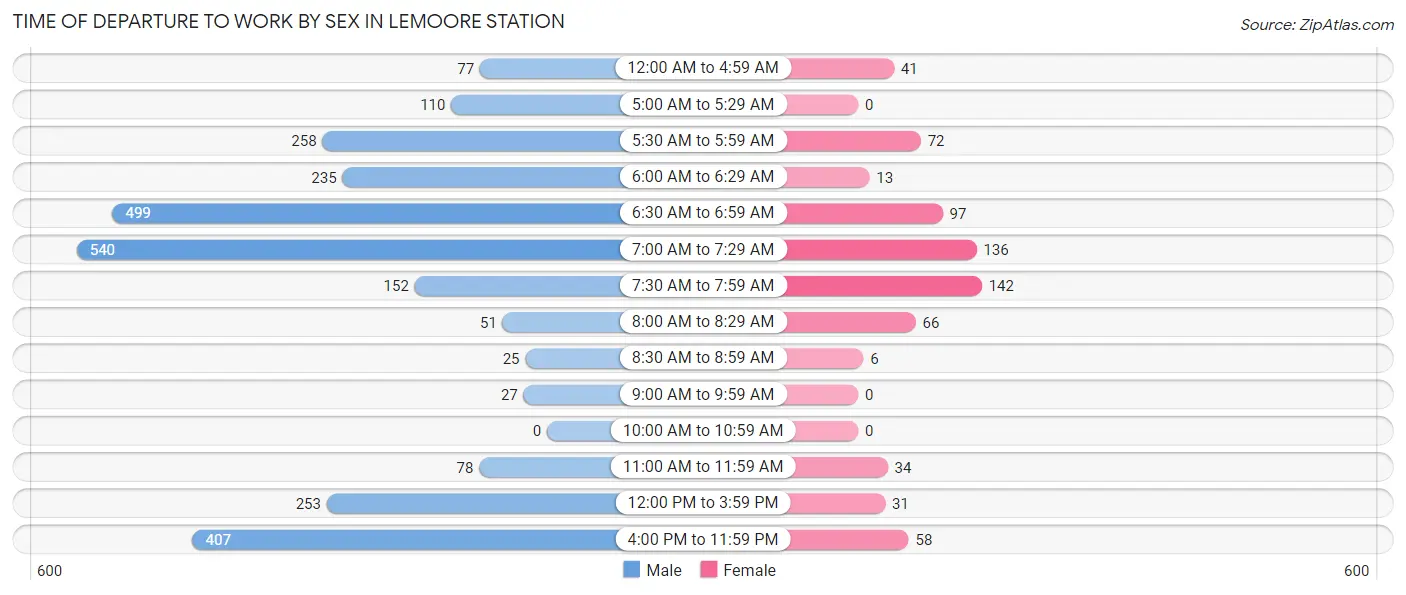
| Time of Departure | Male | Female |
| 12:00 AM to 4:59 AM | 77 (2.8%) | 41 (5.9%) |
| 5:00 AM to 5:29 AM | 110 (4.1%) | 0 (0.0%) |
| 5:30 AM to 5:59 AM | 258 (9.5%) | 72 (10.3%) |
| 6:00 AM to 6:29 AM | 235 (8.7%) | 13 (1.9%) |
| 6:30 AM to 6:59 AM | 499 (18.4%) | 97 (13.9%) |
| 7:00 AM to 7:29 AM | 540 (19.9%) | 136 (19.5%) |
| 7:30 AM to 7:59 AM | 152 (5.6%) | 142 (20.4%) |
| 8:00 AM to 8:29 AM | 51 (1.9%) | 66 (9.5%) |
| 8:30 AM to 8:59 AM | 25 (0.9%) | 6 (0.9%) |
| 9:00 AM to 9:59 AM | 27 (1.0%) | 0 (0.0%) |
| 10:00 AM to 10:59 AM | 0 (0.0%) | 0 (0.0%) |
| 11:00 AM to 11:59 AM | 78 (2.9%) | 34 (4.9%) |
| 12:00 PM to 3:59 PM | 253 (9.3%) | 31 (4.4%) |
| 4:00 PM to 11:59 PM | 407 (15.0%) | 58 (8.3%) |
| Total | 2,712 (100.0%) | 696 (100.0%) |
Housing Occupancy in Lemoore Station
Occupancy by Ownership in Lemoore Station
Of the total 1,444 dwellings in Lemoore Station, owner-occupied units account for 0 (0.0%), while renter-occupied units make up 1,444 (100.0%).
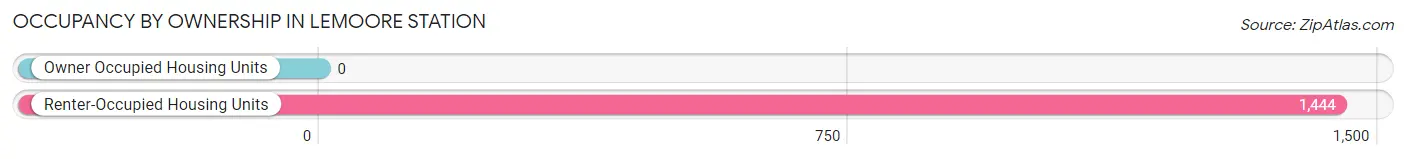
| Occupancy | # Housing Units | % Housing Units |
| Owner Occupied Housing Units | 0 | 0.0% |
| Renter-Occupied Housing Units | 1,444 | 100.0% |
| Total Occupied Housing Units | 1,444 | 100.0% |
Occupancy by Household Size in Lemoore Station
| Household Size | # Housing Units | % Housing Units |
| 1-Person Household | 42 | 2.9% |
| 2-Person Household | 446 | 30.9% |
| 3-Person Household | 379 | 26.3% |
| 4+ Person Household | 577 | 40.0% |
| Total Housing Units | 1,444 | 100.0% |
Occupancy by Ownership by Household Size in Lemoore Station
| Household Size | Owner-occupied | Renter-occupied |
| 1-Person Household | 0 (0.0%) | 42 (100.0%) |
| 2-Person Household | 0 (0.0%) | 446 (100.0%) |
| 3-Person Household | 0 (0.0%) | 379 (100.0%) |
| 4+ Person Household | 0 (0.0%) | 577 (100.0%) |
| Total Housing Units | 0 (0.0%) | 1,444 (100.0%) |
Occupancy by Educational Attainment in Lemoore Station
| Household Size | Owner-occupied | Renter-occupied |
| Less than High School | 0 (0.0%) | 0 (0.0%) |
| High School Diploma | 0 (0.0%) | 354 (100.0%) |
| College/Associate Degree | 0 (0.0%) | 862 (100.0%) |
| Bachelor's Degree or higher | 0 (0.0%) | 228 (100.0%) |
Occupancy by Age of Householder in Lemoore Station
| Age Bracket | # Households | % Households |
| Under 35 Years | 753 | 52.1% |
| 35 to 44 Years | 545 | 37.7% |
| 45 to 54 Years | 100 | 6.9% |
| 55 to 64 Years | 46 | 3.2% |
| 65 to 74 Years | 0 | 0.0% |
| 75 to 84 Years | 0 | 0.0% |
| 85 Years and Over | 0 | 0.0% |
| Total | 1,444 | 100.0% |
Housing Finances in Lemoore Station
Median Income by Occupancy in Lemoore Station
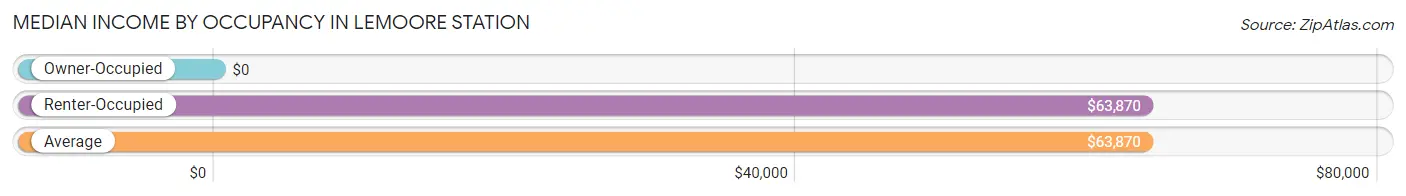
| Occupancy Type | # Households | Median Income |
| Owner-Occupied | 0 (0.0%) | $0 |
| Renter-Occupied | 1,444 (100.0%) | $63,870 |
| Average | 1,444 (100.0%) | $63,870 |
Occupancy by Householder Income Bracket in Lemoore Station
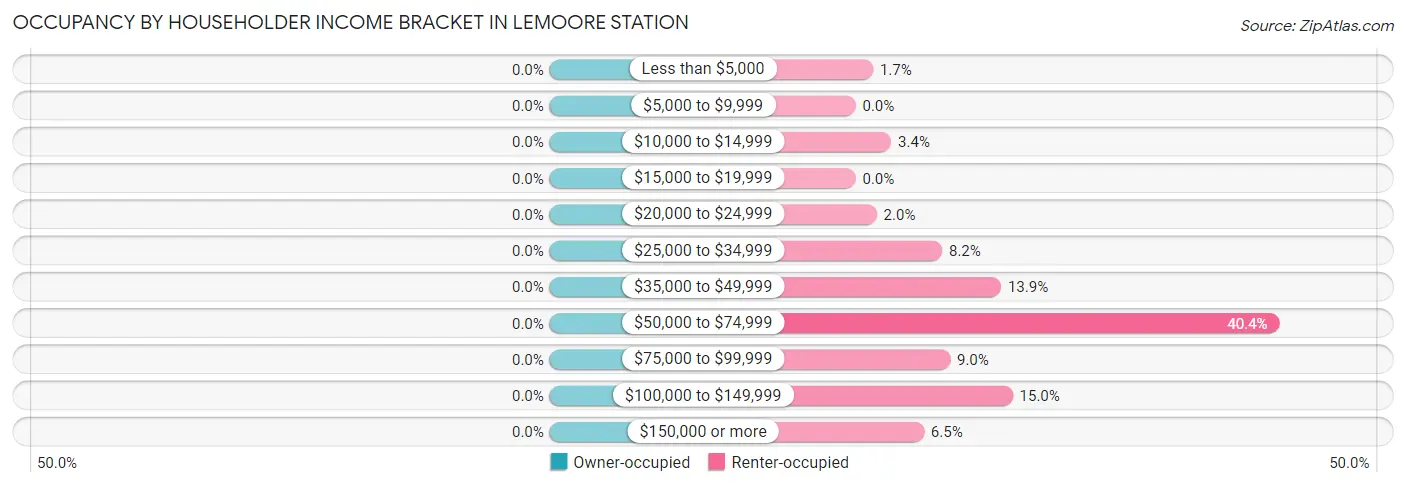
| Income Bracket | Owner-occupied | Renter-occupied |
| Less than $5,000 | 0 (0.0%) | 24 (1.7%) |
| $5,000 to $9,999 | 0 (0.0%) | 0 (0.0%) |
| $10,000 to $14,999 | 0 (0.0%) | 49 (3.4%) |
| $15,000 to $19,999 | 0 (0.0%) | 0 (0.0%) |
| $20,000 to $24,999 | 0 (0.0%) | 29 (2.0%) |
| $25,000 to $34,999 | 0 (0.0%) | 119 (8.2%) |
| $35,000 to $49,999 | 0 (0.0%) | 200 (13.9%) |
| $50,000 to $74,999 | 0 (0.0%) | 583 (40.4%) |
| $75,000 to $99,999 | 0 (0.0%) | 130 (9.0%) |
| $100,000 to $149,999 | 0 (0.0%) | 216 (15.0%) |
| $150,000 or more | 0 (0.0%) | 94 (6.5%) |
| Total | 0 (0.0%) | 1,444 (100.0%) |
Monthly Housing Cost Tiers in Lemoore Station
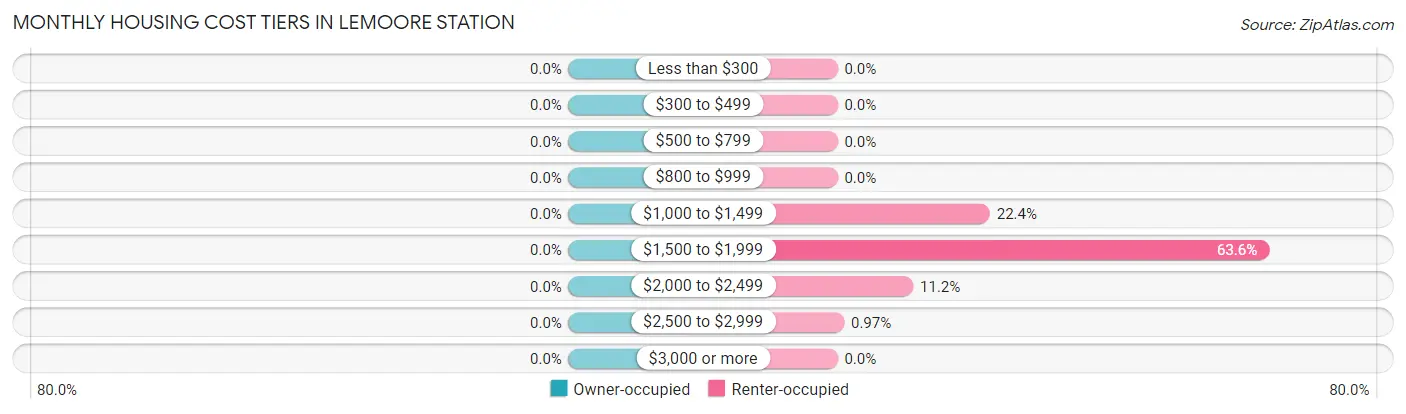
| Monthly Cost | Owner-occupied | Renter-occupied |
| Less than $300 | 0 (0.0%) | 0 (0.0%) |
| $300 to $499 | 0 (0.0%) | 0 (0.0%) |
| $500 to $799 | 0 (0.0%) | 0 (0.0%) |
| $800 to $999 | 0 (0.0%) | 0 (0.0%) |
| $1,000 to $1,499 | 0 (0.0%) | 324 (22.4%) |
| $1,500 to $1,999 | 0 (0.0%) | 918 (63.6%) |
| $2,000 to $2,499 | 0 (0.0%) | 161 (11.2%) |
| $2,500 to $2,999 | 0 (0.0%) | 14 (1.0%) |
| $3,000 or more | 0 (0.0%) | 0 (0.0%) |
| Total | 0 (0.0%) | 1,444 (100.0%) |
Physical Housing Characteristics in Lemoore Station
Housing Structures in Lemoore Station
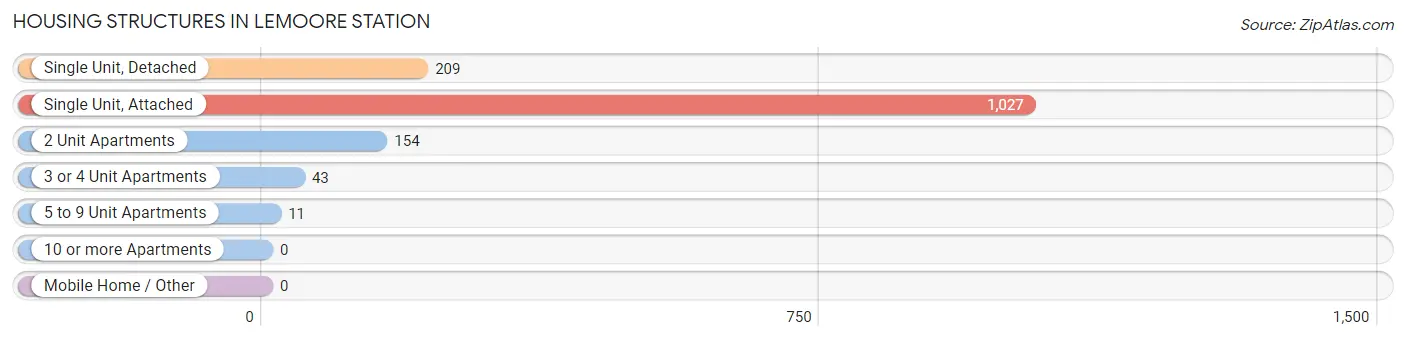
| Structure Type | # Housing Units | % Housing Units |
| Single Unit, Detached | 209 | 14.5% |
| Single Unit, Attached | 1,027 | 71.1% |
| 2 Unit Apartments | 154 | 10.7% |
| 3 or 4 Unit Apartments | 43 | 3.0% |
| 5 to 9 Unit Apartments | 11 | 0.8% |
| 10 or more Apartments | 0 | 0.0% |
| Mobile Home / Other | 0 | 0.0% |
| Total | 1,444 | 100.0% |
Housing Structures by Occupancy in Lemoore Station
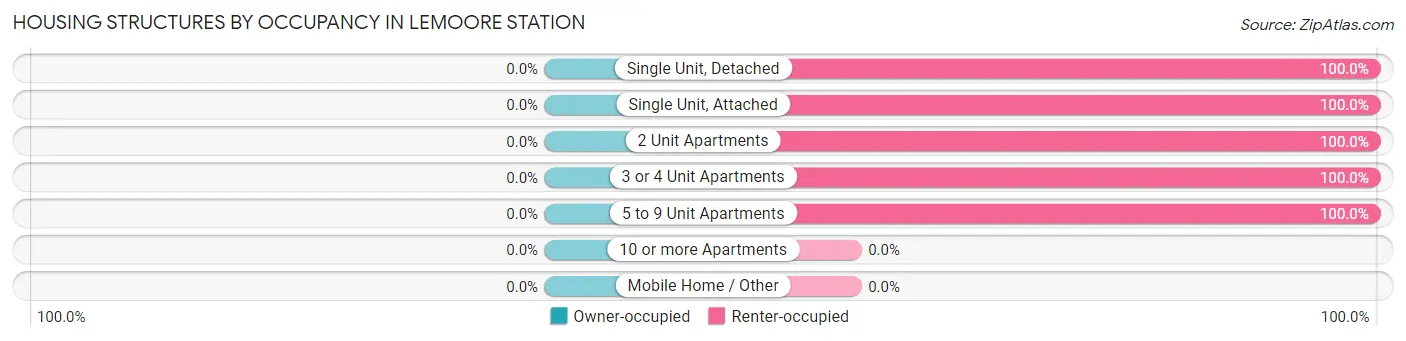
| Structure Type | Owner-occupied | Renter-occupied |
| Single Unit, Detached | 0 (0.0%) | 209 (100.0%) |
| Single Unit, Attached | 0 (0.0%) | 1,027 (100.0%) |
| 2 Unit Apartments | 0 (0.0%) | 154 (100.0%) |
| 3 or 4 Unit Apartments | 0 (0.0%) | 43 (100.0%) |
| 5 to 9 Unit Apartments | 0 (0.0%) | 11 (100.0%) |
| 10 or more Apartments | 0 (0.0%) | 0 (0.0%) |
| Mobile Home / Other | 0 (0.0%) | 0 (0.0%) |
| Total | 0 (0.0%) | 1,444 (100.0%) |
Housing Structures by Number of Rooms in Lemoore Station
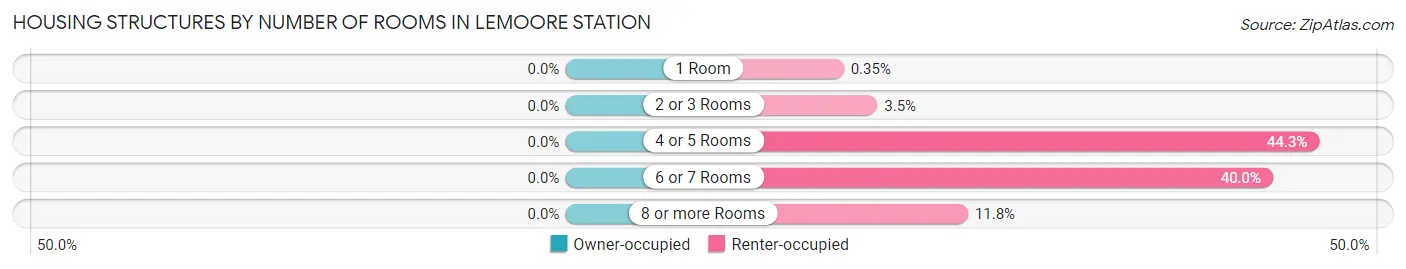
| Number of Rooms | Owner-occupied | Renter-occupied |
| 1 Room | 0 (0.0%) | 5 (0.4%) |
| 2 or 3 Rooms | 0 (0.0%) | 50 (3.5%) |
| 4 or 5 Rooms | 0 (0.0%) | 640 (44.3%) |
| 6 or 7 Rooms | 0 (0.0%) | 578 (40.0%) |
| 8 or more Rooms | 0 (0.0%) | 171 (11.8%) |
| Total | 0 (0.0%) | 1,444 (100.0%) |
Housing Structure by Heating Type in Lemoore Station
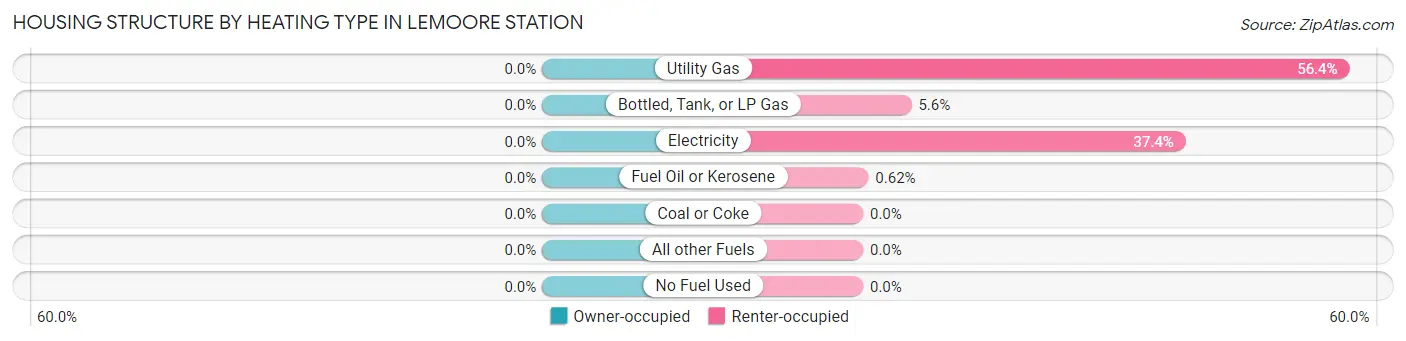
| Heating Type | Owner-occupied | Renter-occupied |
| Utility Gas | 0 (0.0%) | 814 (56.4%) |
| Bottled, Tank, or LP Gas | 0 (0.0%) | 81 (5.6%) |
| Electricity | 0 (0.0%) | 540 (37.4%) |
| Fuel Oil or Kerosene | 0 (0.0%) | 9 (0.6%) |
| Coal or Coke | 0 (0.0%) | 0 (0.0%) |
| All other Fuels | 0 (0.0%) | 0 (0.0%) |
| No Fuel Used | 0 (0.0%) | 0 (0.0%) |
| Total | 0 (0.0%) | 1,444 (100.0%) |
Household Vehicle Usage in Lemoore Station
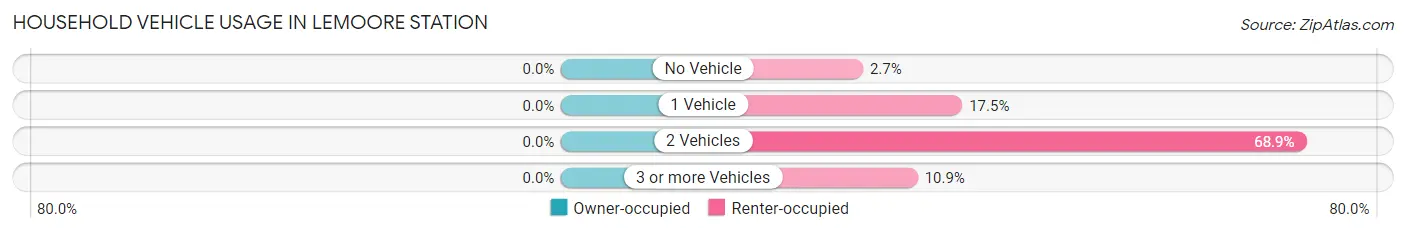
| Vehicles per Household | Owner-occupied | Renter-occupied |
| No Vehicle | 0 (0.0%) | 39 (2.7%) |
| 1 Vehicle | 0 (0.0%) | 253 (17.5%) |
| 2 Vehicles | 0 (0.0%) | 995 (68.9%) |
| 3 or more Vehicles | 0 (0.0%) | 157 (10.9%) |
| Total | 0 (0.0%) | 1,444 (100.0%) |
Real Estate & Mortgages in Lemoore Station
Real Estate and Mortgage Overview in Lemoore Station
| Characteristic | Without Mortgage | With Mortgage |
| Housing Units | 0 | 0 |
| Median Property Value | - | - |
| Median Household Income | - | - |
| Monthly Housing Costs | - | - |
| Real Estate Taxes | - | - |
Property Value by Mortgage Status in Lemoore Station
| Property Value | Without Mortgage | With Mortgage |
| Less than $50,000 | 0 (0.0%) | 0 (0.0%) |
| $50,000 to $99,999 | 0 (0.0%) | 0 (0.0%) |
| $100,000 to $299,999 | 0 (0.0%) | 0 (0.0%) |
| $300,000 to $499,999 | 0 (0.0%) | 0 (0.0%) |
| $500,000 to $749,999 | 0 (0.0%) | 0 (0.0%) |
| $750,000 to $999,999 | 0 (0.0%) | 0 (0.0%) |
| $1,000,000 or more | 0 (0.0%) | 0 (0.0%) |
| Total | 0 (0.0%) | 0 (0.0%) |
Household Income by Mortgage Status in Lemoore Station
| Household Income | Without Mortgage | With Mortgage |
| Less than $10,000 | 0 (0.0%) | 0 (0.0%) |
| $10,000 to $24,999 | 0 (0.0%) | 0 (0.0%) |
| $25,000 to $34,999 | 0 (0.0%) | 0 (0.0%) |
| $35,000 to $49,999 | 0 (0.0%) | 0 (0.0%) |
| $50,000 to $74,999 | 0 (0.0%) | 0 (0.0%) |
| $75,000 to $99,999 | 0 (0.0%) | 0 (0.0%) |
| $100,000 to $149,999 | 0 (0.0%) | 0 (0.0%) |
| $150,000 or more | 0 (0.0%) | 0 (0.0%) |
| Total | 0 (0.0%) | 0 (0.0%) |
Property Value to Household Income Ratio in Lemoore Station
| Value-to-Income Ratio | Without Mortgage | With Mortgage |
| Less than 2.0x | 0 (0.0%) | 0 (0.0%) |
| 2.0x to 2.9x | 0 (0.0%) | 0 (0.0%) |
| 3.0x to 3.9x | 0 (0.0%) | 0 (0.0%) |
| 4.0x or more | 0 (0.0%) | 0 (0.0%) |
| Total | 0 (0.0%) | 0 (0.0%) |
Real Estate Taxes by Mortgage Status in Lemoore Station
| Property Taxes | Without Mortgage | With Mortgage |
| Less than $800 | 0 (0.0%) | 0 (0.0%) |
| $800 to $1,499 | 0 (0.0%) | 0 (0.0%) |
| $800 to $1,499 | 0 (0.0%) | 0 (0.0%) |
| Total | 0 (0.0%) | 0 (0.0%) |
Health & Disability in Lemoore Station
Health Insurance Coverage by Age in Lemoore Station
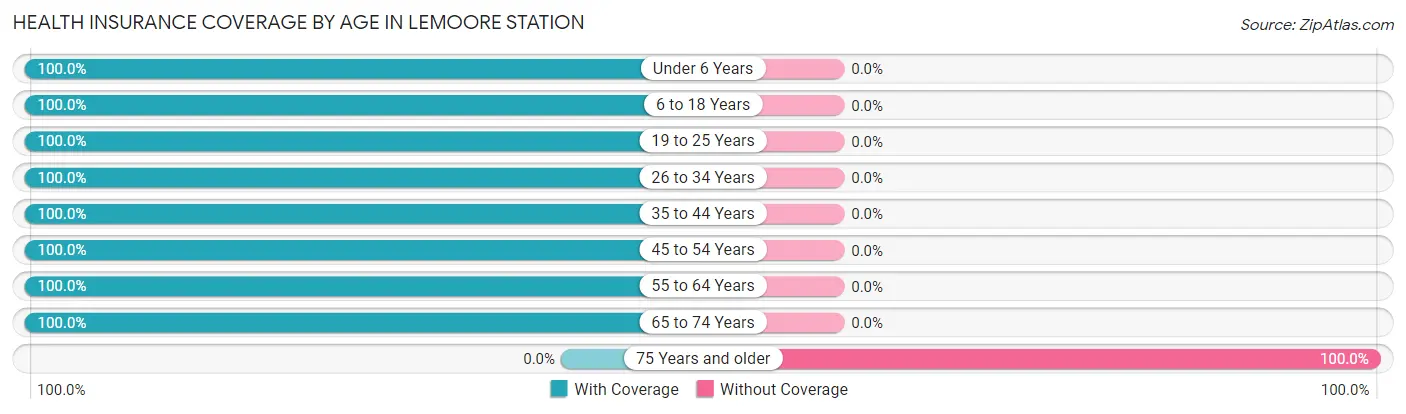
| Age Bracket | With Coverage | Without Coverage |
| Under 6 Years | 971 (100.0%) | 0 (0.0%) |
| 6 to 18 Years | 850 (100.0%) | 0 (0.0%) |
| 19 to 25 Years | 395 (100.0%) | 0 (0.0%) |
| 26 to 34 Years | 581 (100.0%) | 0 (0.0%) |
| 35 to 44 Years | 465 (100.0%) | 0 (0.0%) |
| 45 to 54 Years | 254 (100.0%) | 0 (0.0%) |
| 55 to 64 Years | 46 (100.0%) | 0 (0.0%) |
| 65 to 74 Years | 9 (100.0%) | 0 (0.0%) |
| 75 Years and older | 0 (0.0%) | 7 (100.0%) |
| Total | 3,571 (99.8%) | 7 (0.2%) |
Health Insurance Coverage by Citizenship Status in Lemoore Station
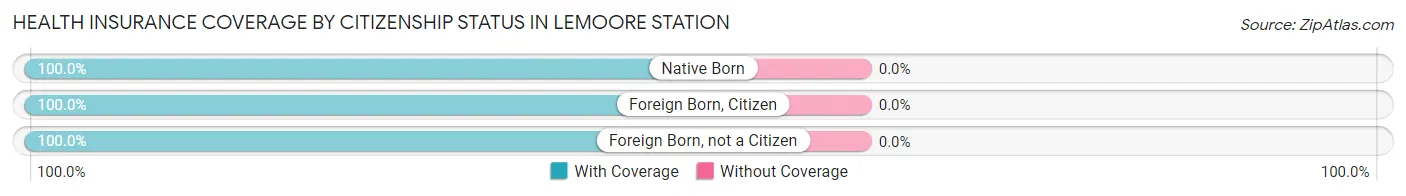
| Citizenship Status | With Coverage | Without Coverage |
| Native Born | 971 (100.0%) | 0 (0.0%) |
| Foreign Born, Citizen | 850 (100.0%) | 0 (0.0%) |
| Foreign Born, not a Citizen | 395 (100.0%) | 0 (0.0%) |
Health Insurance Coverage by Household Income in Lemoore Station
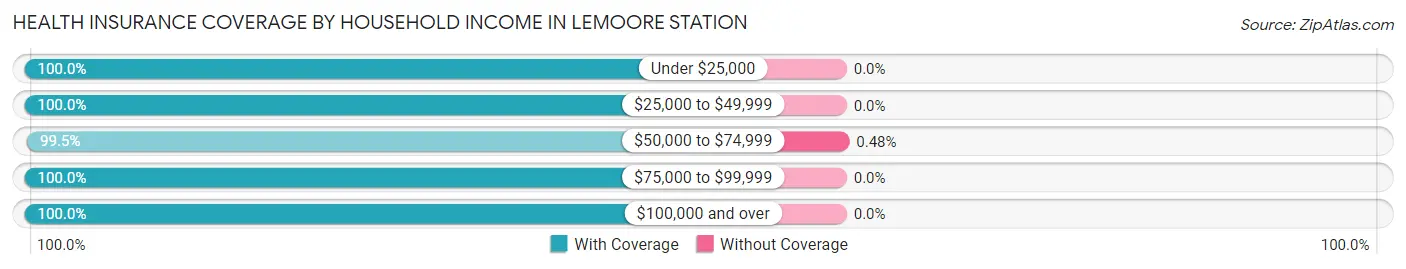
| Household Income | With Coverage | Without Coverage |
| Under $25,000 | 274 (100.0%) | 0 (0.0%) |
| $25,000 to $49,999 | 756 (100.0%) | 0 (0.0%) |
| $50,000 to $74,999 | 1,457 (99.5%) | 7 (0.5%) |
| $75,000 to $99,999 | 399 (100.0%) | 0 (0.0%) |
| $100,000 and over | 685 (100.0%) | 0 (0.0%) |
Public vs Private Health Insurance Coverage by Age in Lemoore Station
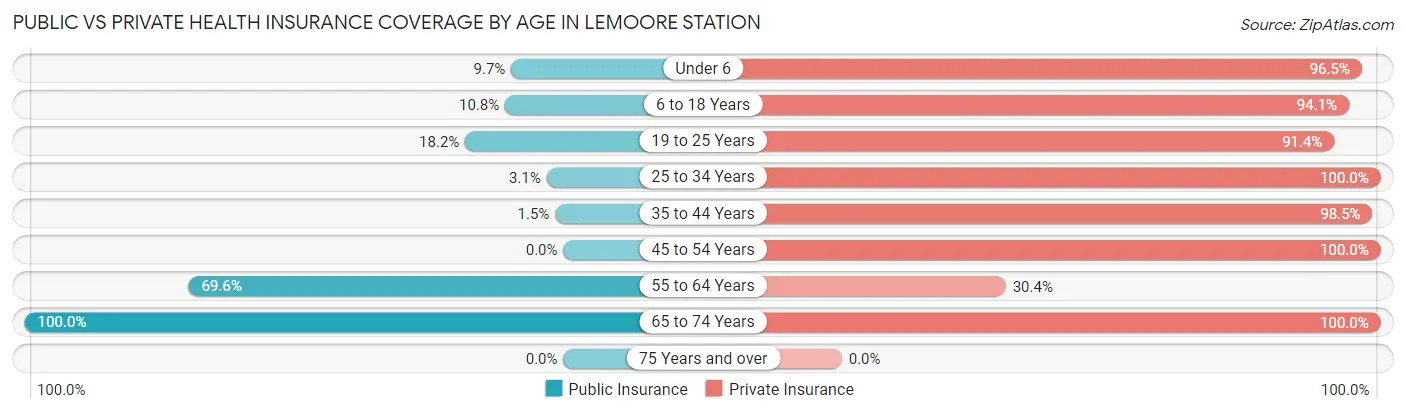
| Age Bracket | Public Insurance | Private Insurance |
| Under 6 | 94 (9.7%) | 937 (96.5%) |
| 6 to 18 Years | 92 (10.8%) | 800 (94.1%) |
| 19 to 25 Years | 72 (18.2%) | 361 (91.4%) |
| 25 to 34 Years | 18 (3.1%) | 581 (100.0%) |
| 35 to 44 Years | 7 (1.5%) | 458 (98.5%) |
| 45 to 54 Years | 0 (0.0%) | 254 (100.0%) |
| 55 to 64 Years | 32 (69.6%) | 14 (30.4%) |
| 65 to 74 Years | 9 (100.0%) | 9 (100.0%) |
| 75 Years and over | 0 (0.0%) | 0 (0.0%) |
| Total | 324 (9.1%) | 3,414 (95.4%) |
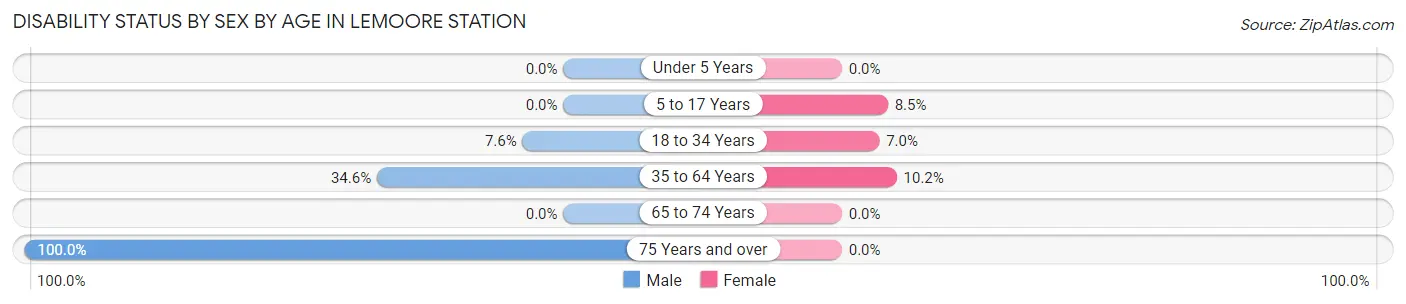
Disability Status by Sex by Age in Lemoore Station
| Age Bracket | Male | Female |
| Under 5 Years | 0 (0.0%) | 0 (0.0%) |
| 5 to 17 Years | 0 (0.0%) | 31 (8.5%) |
| 18 to 34 Years | 14 (7.6%) | 55 (7.0%) |
| 35 to 64 Years | 64 (34.6%) | 59 (10.2%) |
| 65 to 74 Years | 0 (0.0%) | 0 (0.0%) |
| 75 Years and over | 7 (100.0%) | 0 (0.0%) |
Disability Class by Sex by Age in Lemoore Station
Disability Class: Hearing Difficulty
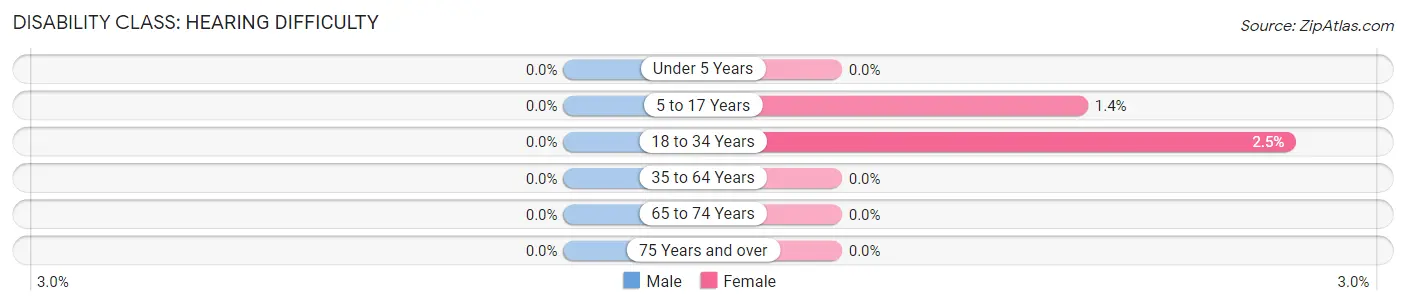
| Age Bracket | Male | Female |
| Under 5 Years | 0 (0.0%) | 0 (0.0%) |
| 5 to 17 Years | 0 (0.0%) | 5 (1.4%) |
| 18 to 34 Years | 0 (0.0%) | 20 (2.5%) |
| 35 to 64 Years | 0 (0.0%) | 0 (0.0%) |
| 65 to 74 Years | 0 (0.0%) | 0 (0.0%) |
| 75 Years and over | 0 (0.0%) | 0 (0.0%) |
Disability Class: Vision Difficulty
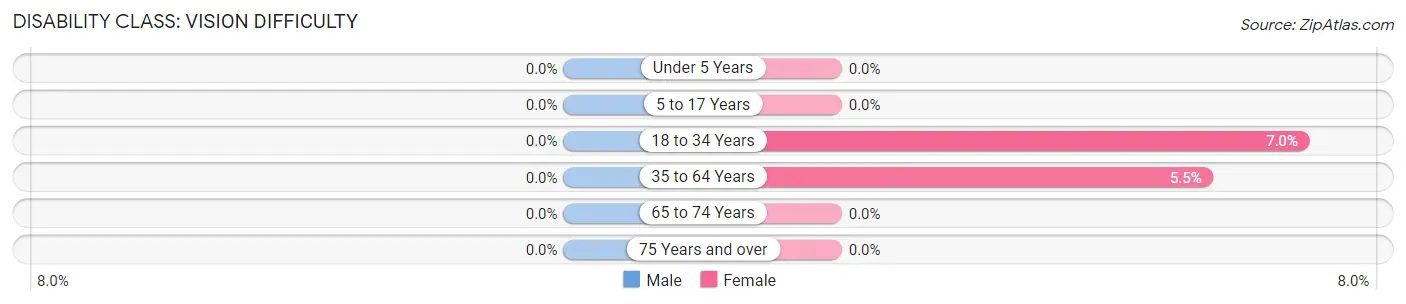
| Age Bracket | Male | Female |
| Under 5 Years | 0 (0.0%) | 0 (0.0%) |
| 5 to 17 Years | 0 (0.0%) | 0 (0.0%) |
| 18 to 34 Years | 0 (0.0%) | 55 (7.0%) |
| 35 to 64 Years | 0 (0.0%) | 32 (5.5%) |
| 65 to 74 Years | 0 (0.0%) | 0 (0.0%) |
| 75 Years and over | 0 (0.0%) | 0 (0.0%) |
Disability Class: Cognitive Difficulty
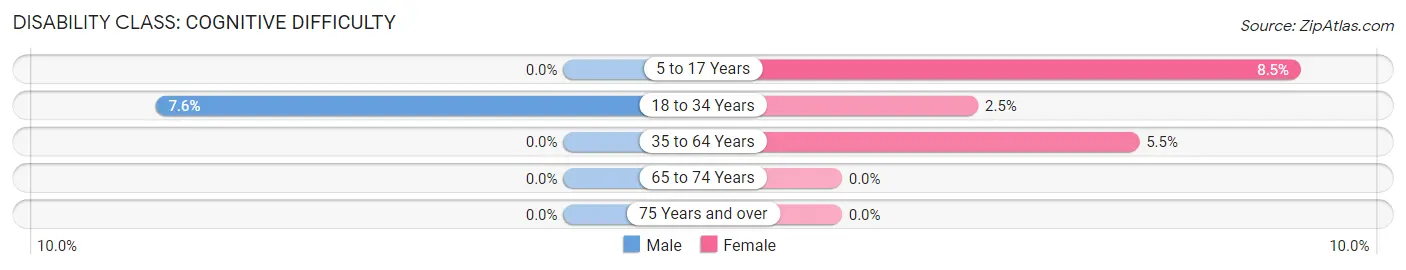
| Age Bracket | Male | Female |
| 5 to 17 Years | 0 (0.0%) | 31 (8.5%) |
| 18 to 34 Years | 14 (7.6%) | 20 (2.5%) |
| 35 to 64 Years | 0 (0.0%) | 32 (5.5%) |
| 65 to 74 Years | 0 (0.0%) | 0 (0.0%) |
| 75 Years and over | 0 (0.0%) | 0 (0.0%) |
Disability Class: Ambulatory Difficulty
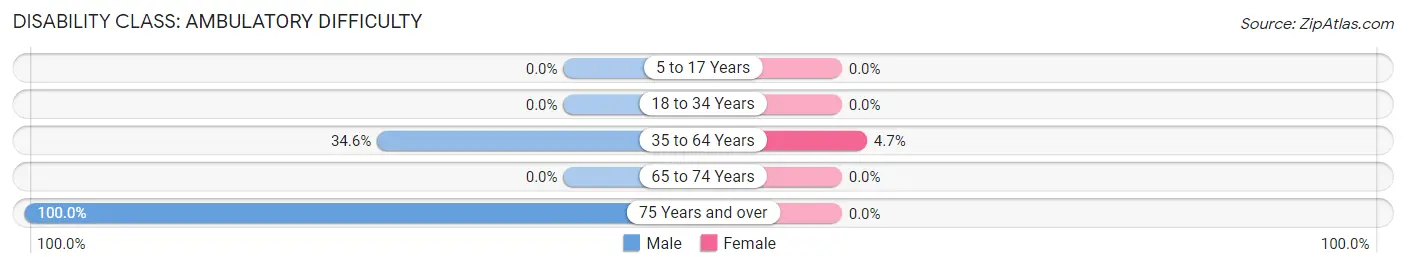
| Age Bracket | Male | Female |
| 5 to 17 Years | 0 (0.0%) | 0 (0.0%) |
| 18 to 34 Years | 0 (0.0%) | 0 (0.0%) |
| 35 to 64 Years | 64 (34.6%) | 27 (4.7%) |
| 65 to 74 Years | 0 (0.0%) | 0 (0.0%) |
| 75 Years and over | 7 (100.0%) | 0 (0.0%) |
Disability Class: Self-Care Difficulty
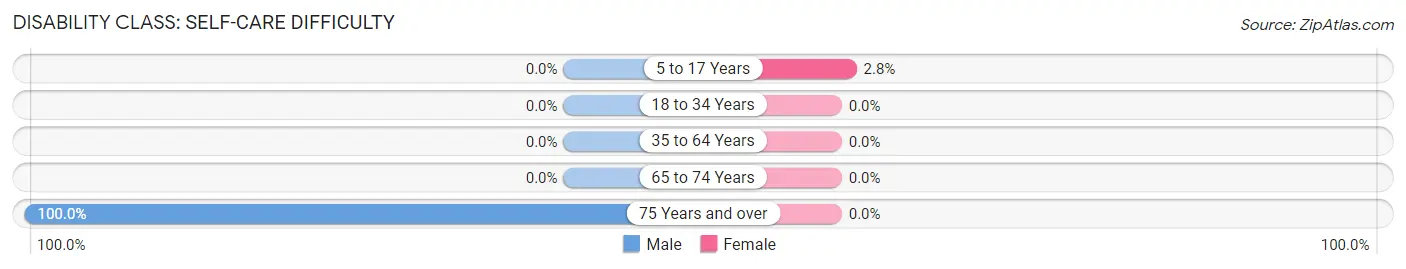
| Age Bracket | Male | Female |
| 5 to 17 Years | 0 (0.0%) | 10 (2.8%) |
| 18 to 34 Years | 0 (0.0%) | 0 (0.0%) |
| 35 to 64 Years | 0 (0.0%) | 0 (0.0%) |
| 65 to 74 Years | 0 (0.0%) | 0 (0.0%) |
| 75 Years and over | 7 (100.0%) | 0 (0.0%) |
Technology Access in Lemoore Station
Computing Device Access in Lemoore Station
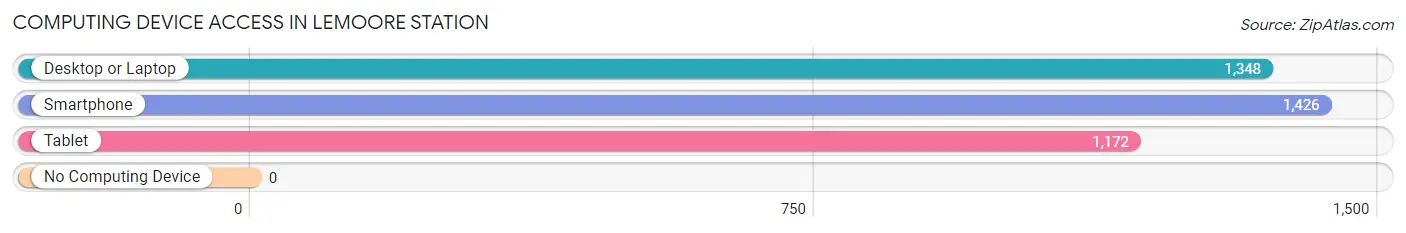
| Device Type | # Households | % Households |
| Desktop or Laptop | 1,348 | 93.3% |
| Smartphone | 1,426 | 98.8% |
| Tablet | 1,172 | 81.2% |
| No Computing Device | 0 | 0.0% |
| Total | 1,444 | 100.0% |
Internet Access in Lemoore Station
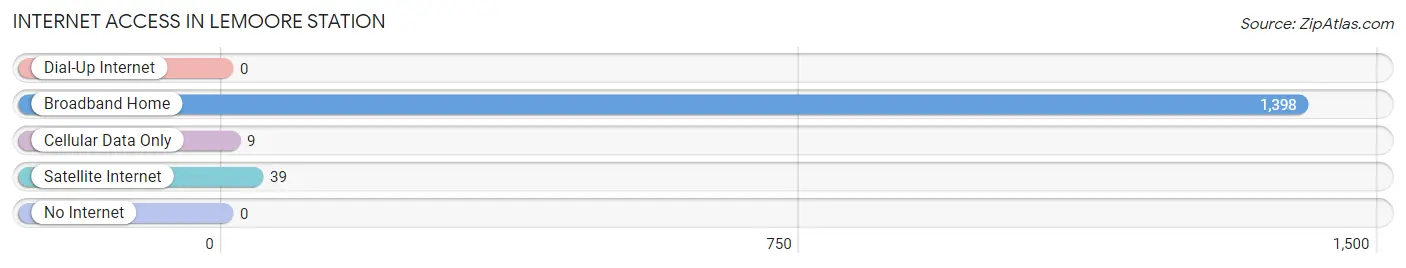
| Internet Type | # Households | % Households |
| Dial-Up Internet | 0 | 0.0% |
| Broadband Home | 1,398 | 96.8% |
| Cellular Data Only | 9 | 0.6% |
| Satellite Internet | 39 | 2.7% |
| No Internet | 0 | 0.0% |
| Total | 1,444 | 100.0% |
Lemoore Station Summary
Lemoore Station, California is a census-designated place (CDP) located in Kings County, California. It is situated in the San Joaquin Valley, approximately 8 miles west of the city of Lemoore. The population of Lemoore Station was 8,845 at the 2010 census.
History
Lemoore Station was originally established in the late 1800s as a railroad station for the Southern Pacific Railroad. The station was named after the nearby town of Lemoore, which was founded in 1871. The station was used to transport goods and passengers between Lemoore and other nearby towns.
In the early 1900s, the station was expanded to include a post office, a general store, and a hotel. The station was also used as a stop for the stagecoach line that ran between Lemoore and Hanford.
In the 1950s, the station was converted into a residential area. The area was annexed by the city of Lemoore in 1959.
Geography
Lemoore Station is located at an elevation of approximately 200 feet above sea level. It is situated in the San Joaquin Valley, approximately 8 miles west of the city of Lemoore. The CDP has a total area of 2.3 square miles, all of which is land.
The climate in Lemoore Station is characterized by hot, dry summers and mild, wet winters. The average annual temperature is approximately 65°F. The average annual precipitation is approximately 8 inches.
Economy
The economy of Lemoore Station is largely based on agriculture. The area is home to a variety of crops, including cotton, alfalfa, tomatoes, and melons. The area is also home to several dairy farms.
In addition to agriculture, Lemoore Station is home to a variety of businesses, including restaurants, retail stores, and auto repair shops. The area is also home to a number of manufacturing companies, including a furniture manufacturer and a plastics manufacturer.
Demographics
As of the 2010 census, the population of Lemoore Station was 8,845. The racial makeup of the CDP was 68.3% White, 1.7% African American, 0.7% Native American, 1.2% Asian, 0.1% Pacific Islander, 24.7% from other races, and 3.5% from two or more races. Hispanic or Latino of any race were 44.2% of the population.
The median household income in Lemoore Station was $41,944, and the median family income was $45,938. The per capita income was $17,845. About 17.3% of families and 20.3% of the population were below the poverty line, including 28.2% of those under age 18 and 8.2% of those age 65 or over.
Common Questions
What is Per Capita Income in Lemoore Station?
Per Capita income in Lemoore Station is $24,771.
What is the Median Family Income in Lemoore Station?
Median Family Income in Lemoore Station is $63,954.
What is the Median Household income in Lemoore Station?
Median Household Income in Lemoore Station is $63,870.
What is Income or Wage Gap in Lemoore Station?
Income or Wage Gap in Lemoore Station is 9.9%.
Women in Lemoore Station earn 90.1 cents for every dollar earned by a man.
What is Inequality or Gini Index in Lemoore Station?
Inequality or Gini Index in Lemoore Station is 0.30.
What is the Total Population of Lemoore Station?
Total Population of Lemoore Station is 6,403.
What is the Total Male Population of Lemoore Station?
Total Male Population of Lemoore Station is 3,895.
What is the Total Female Population of Lemoore Station?
Total Female Population of Lemoore Station is 2,508.
What is the Ratio of Males per 100 Females in Lemoore Station?
There are 155.30 Males per 100 Females in Lemoore Station.
What is the Ratio of Females per 100 Males in Lemoore Station?
There are 64.39 Females per 100 Males in Lemoore Station.
What is the Median Population Age in Lemoore Station?
Median Population Age in Lemoore Station is 23.4 Years.
What is the Average Family Size in Lemoore Station
Average Family Size in Lemoore Station is 3.3 People.
What is the Average Household Size in Lemoore Station
Average Household Size in Lemoore Station is 3.2 People.
How Large is the Labor Force in Lemoore Station?
There are 3,751 People in the Labor Forcein in Lemoore Station.
What is the Percentage of People in the Labor Force in Lemoore Station?
80.9% of People are in the Labor Force in Lemoore Station.
What is the Unemployment Rate in Lemoore Station?
Unemployment Rate in Lemoore Station is 8.9%.