Cities with the Highest Percentage of Population Employed in Computer & Mathematics in Nevada
RELATED REPORTS & OPTIONS
Computer & Mathematics
Nevada
Compare Cities
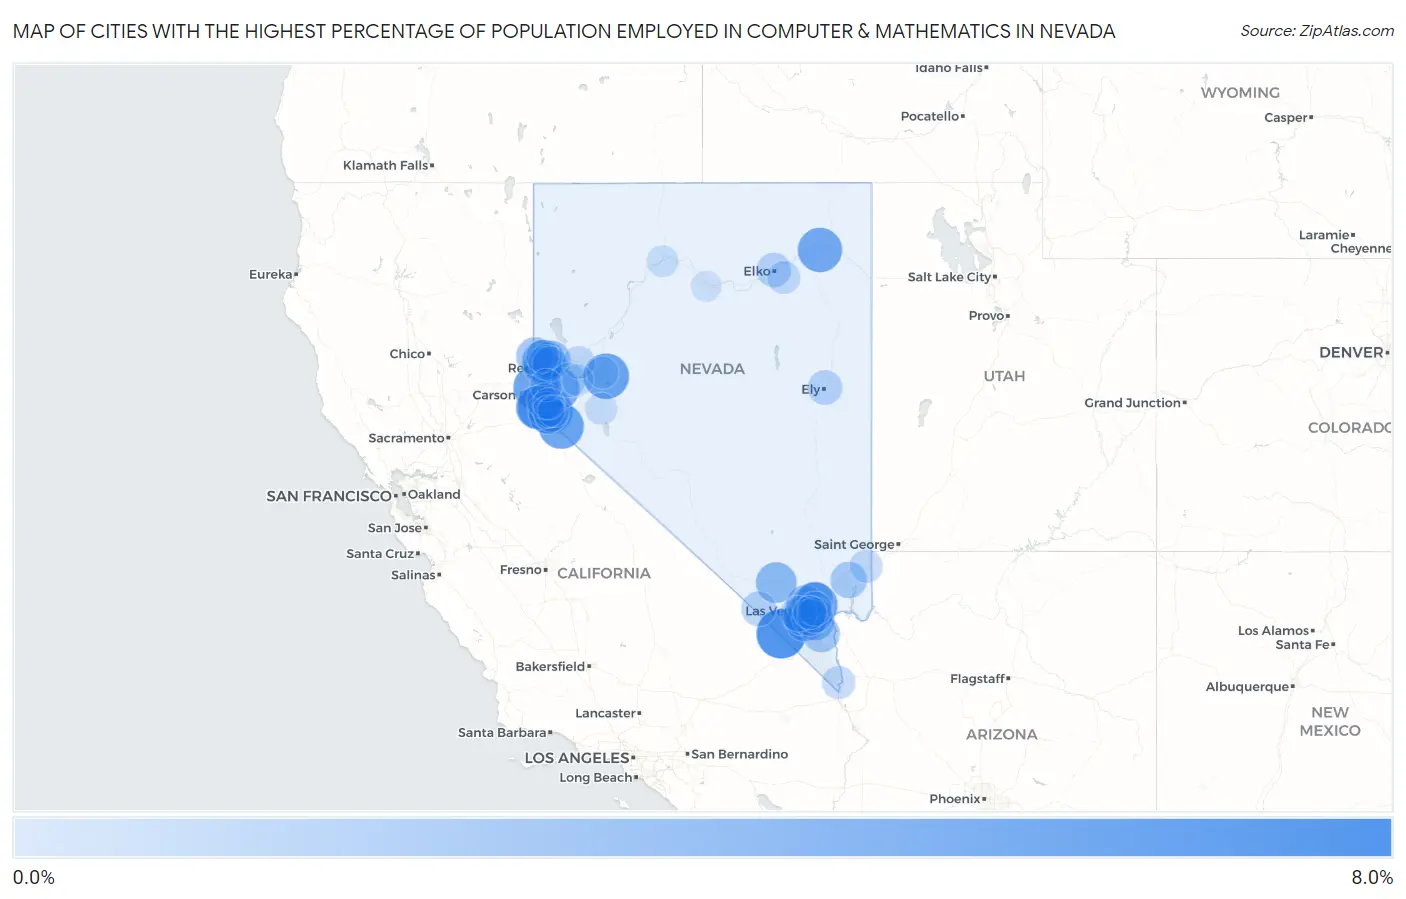
Map of Cities with the Highest Percentage of Population Employed in Computer & Mathematics in Nevada
0.0%
8.0%
Cities with the Highest Percentage of Population Employed in Computer & Mathematics in Nevada
| City | % Employed | vs State | vs National | |
| 1. | Sandy Valley | 6.6% | 2.3%(+4.23)#1 | 3.5%(+3.04)#1,839 |
| 2. | Incline Village | 5.3% | 2.3%(+2.92)#2 | 3.5%(+1.73)#2,814 |
| 3. | Fallon Station | 5.2% | 2.3%(+2.89)#3 | 3.5%(+1.69)#2,843 |
| 4. | East Valley | 5.1% | 2.3%(+2.76)#4 | 3.5%(+1.56)#2,980 |
| 5. | Topaz Ranch Estates | 5.1% | 2.3%(+2.74)#5 | 3.5%(+1.54)#3,008 |
| 6. | Nellis Afb | 5.0% | 2.3%(+2.71)#6 | 3.5%(+1.51)#3,052 |
| 7. | Kingsbury | 4.9% | 2.3%(+2.53)#7 | 3.5%(+1.34)#3,248 |
| 8. | Wells | 4.7% | 2.3%(+2.41)#8 | 3.5%(+1.21)#3,394 |
| 9. | Round Hill Village | 4.3% | 2.3%(+1.99)#9 | 3.5%(+0.792)#3,952 |
| 10. | Golden Valley | 4.3% | 2.3%(+1.94)#10 | 3.5%(+0.745)#4,022 |
| 11. | Dayton | 3.9% | 2.3%(+1.53)#11 | 3.5%(+0.335)#4,713 |
| 12. | Carson | 3.7% | 2.3%(+1.36)#12 | 3.5%(+0.162)#5,038 |
| 13. | Indian Springs | 3.5% | 2.3%(+1.17)#13 | 3.5%(-0.021)#5,421 |
| 14. | Enterprise | 3.3% | 2.3%(+0.976)#14 | 3.5%(-0.220)#5,854 |
| 15. | Spring Valley | 2.8% | 2.3%(+0.516)#15 | 3.5%(-0.680)#6,988 |
| 16. | Spanish Springs | 2.8% | 2.3%(+0.500)#16 | 3.5%(-0.695)#7,015 |
| 17. | Henderson | 2.8% | 2.3%(+0.439)#17 | 3.5%(-0.756)#7,195 |
| 18. | Reno | 2.7% | 2.3%(+0.358)#18 | 3.5%(-0.837)#7,410 |
| 19. | Cold Springs | 2.5% | 2.3%(+0.212)#19 | 3.5%(-0.984)#7,824 |
| 20. | Gardnerville Ranchos | 2.4% | 2.3%(+0.088)#20 | 3.5%(-1.11)#8,204 |
| 21. | Las Vegas | 2.4% | 2.3%(+0.025)#21 | 3.5%(-1.17)#8,407 |
| 22. | Boulder City | 2.3% | 2.3%(+0.019)#22 | 3.5%(-1.18)#8,436 |
| 23. | North Las Vegas | 2.2% | 2.3%(-0.134)#23 | 3.5%(-1.33)#8,962 |
| 24. | Paradise | 2.2% | 2.3%(-0.169)#24 | 3.5%(-1.36)#9,089 |
| 25. | Minden | 2.1% | 2.3%(-0.239)#25 | 3.5%(-1.43)#9,335 |
| 26. | Moapa Valley | 2.1% | 2.3%(-0.240)#26 | 3.5%(-1.44)#9,339 |
| 27. | Indian Hills | 2.0% | 2.3%(-0.358)#27 | 3.5%(-1.55)#9,749 |
| 28. | Summerlin South | 1.9% | 2.3%(-0.395)#28 | 3.5%(-1.59)#9,891 |
| 29. | Whitney | 1.8% | 2.3%(-0.511)#29 | 3.5%(-1.71)#10,331 |
| 30. | Sun Valley | 1.6% | 2.3%(-0.705)#30 | 3.5%(-1.90)#11,155 |
| 31. | Pahrump | 1.6% | 2.3%(-0.747)#31 | 3.5%(-1.94)#11,345 |
| 32. | Sparks | 1.6% | 2.3%(-0.758)#32 | 3.5%(-1.95)#11,396 |
| 33. | Ely | 1.5% | 2.3%(-0.832)#33 | 3.5%(-2.03)#11,703 |
| 34. | Elko | 1.5% | 2.3%(-0.876)#34 | 3.5%(-2.07)#11,892 |
| 35. | Stagecoach | 1.4% | 2.3%(-0.883)#35 | 3.5%(-2.08)#11,920 |
| 36. | Sunrise Manor | 1.4% | 2.3%(-0.965)#36 | 3.5%(-2.16)#12,251 |
| 37. | Ruhenstroth | 1.2% | 2.3%(-1.17)#37 | 3.5%(-2.36)#13,182 |
| 38. | Laughlin | 1.1% | 2.3%(-1.27)#38 | 3.5%(-2.47)#13,658 |
| 39. | Winchester | 1.0% | 2.3%(-1.31)#39 | 3.5%(-2.51)#13,828 |
| 40. | Mesquite | 0.98% | 2.3%(-1.35)#40 | 3.5%(-2.55)#14,017 |
| 41. | Spring Creek | 0.96% | 2.3%(-1.37)#41 | 3.5%(-2.57)#14,076 |
| 42. | Lemmon Valley | 0.91% | 2.3%(-1.42)#42 | 3.5%(-2.61)#14,299 |
| 43. | Fernley | 0.88% | 2.3%(-1.45)#43 | 3.5%(-2.65)#14,470 |
| 44. | Washoe Valley | 0.80% | 2.3%(-1.53)#44 | 3.5%(-2.72)#14,841 |
| 45. | Schurz | 0.65% | 2.3%(-1.68)#45 | 3.5%(-2.88)#15,572 |
| 46. | Fallon | 0.64% | 2.3%(-1.69)#46 | 3.5%(-2.89)#15,626 |
| 47. | Gardnerville | 0.62% | 2.3%(-1.71)#47 | 3.5%(-2.91)#15,741 |
| 48. | Silver Springs | 0.57% | 2.3%(-1.76)#48 | 3.5%(-2.95)#15,930 |
| 49. | Winnemucca | 0.54% | 2.3%(-1.79)#49 | 3.5%(-2.99)#16,078 |
| 50. | Fish Springs | 0.47% | 2.3%(-1.86)#50 | 3.5%(-3.05)#16,351 |
| 51. | Johnson Lane | 0.40% | 2.3%(-1.93)#51 | 3.5%(-3.13)#16,626 |
| 52. | Battle Mountain | 0.24% | 2.3%(-2.09)#52 | 3.5%(-3.28)#17,055 |
1
2Common Questions
What are the Top 10 Cities with the Highest Percentage of Population Employed in Computer & Mathematics in Nevada?
Top 10 Cities with the Highest Percentage of Population Employed in Computer & Mathematics in Nevada are:
#1
6.6%
#2
5.3%
#3
5.2%
#4
5.1%
#5
5.1%
#6
5.0%
#7
4.9%
#8
4.7%
#9
4.3%
#10
4.3%
What city has the Highest Percentage of Population Employed in Computer & Mathematics in Nevada?
Sandy Valley has the Highest Percentage of Population Employed in Computer & Mathematics in Nevada with 6.6%.
What is the Percentage of Population Employed in Computer & Mathematics in the State of Nevada?
Percentage of Population Employed in Computer & Mathematics in Nevada is 2.3%.
What is the Percentage of Population Employed in Computer & Mathematics in the United States?
Percentage of Population Employed in Computer & Mathematics in the United States is 3.5%.