Pioneer, CA Map & Demographics
Pioneer Map
Pioneer Overview
$45,660
PER CAPITA INCOME
$71,393
AVG FAMILY INCOME
$71,278
AVG HOUSEHOLD INCOME
0.46
INEQUALITY / GINI INDEX
1,322
TOTAL POPULATION
718
MALE POPULATION
604
FEMALE POPULATION
118.87
MALES / 100 FEMALES
84.12
FEMALES / 100 MALES
58.8
MEDIAN AGE
3.3
AVG FAMILY SIZE
2.7
AVG HOUSEHOLD SIZE
589
LABOR FORCE [ PEOPLE ]
53.3%
PERCENT IN LABOR FORCE
6.3%
UNEMPLOYMENT RATE
Pioneer Zip Codes
Pioneer Area Codes
Income in Pioneer
Income Overview in Pioneer
Per Capita Income in Pioneer is $45,660, while median incomes of families and households are $71,393 and $71,278 respectively.
| Characteristic | Number | Measure |
| Per Capita Income | 1,322 | $45,660 |
| Median Family Income | 353 | $71,393 |
| Mean Family Income | 353 | $122,193 |
| Median Household Income | 493 | $71,278 |
| Mean Household Income | 493 | $106,465 |
| Income Deficit | 353 | $0 |
| Wage / Income Gap (%) | 1,322 | 0.00% |
| Wage / Income Gap ($) | 1,322 | 100.00¢ per $1 |
| Gini / Inequality Index | 1,322 | 0.46 |
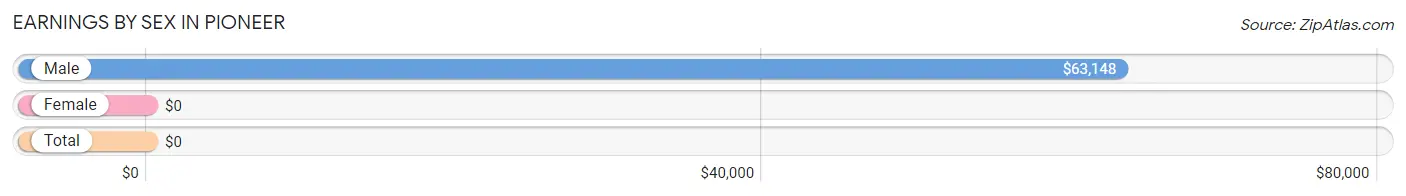
Earnings by Sex in Pioneer
| Sex | Number | Average Earnings |
| Male | 366 (64.2%) | $63,148 |
| Female | 204 (35.8%) | $0 |
| Total | 570 (100.0%) | $0 |
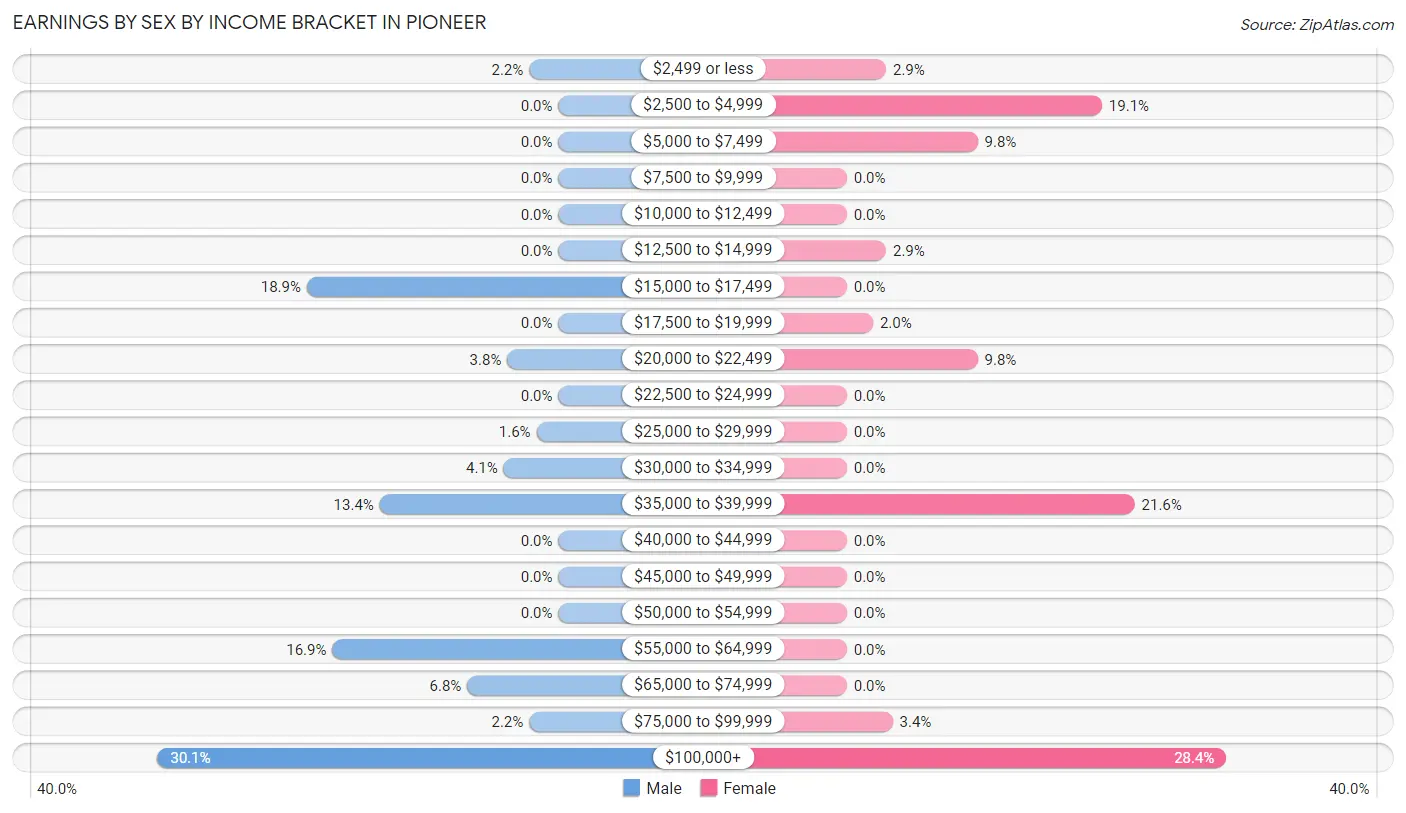
Earnings by Sex by Income Bracket in Pioneer
The most common earnings brackets in Pioneer are $100,000+ for men (110 | 30.0%) and $100,000+ for women (58 | 28.4%).
| Income | Male | Female |
| $2,499 or less | 8 (2.2%) | 6 (2.9%) |
| $2,500 to $4,999 | 0 (0.0%) | 39 (19.1%) |
| $5,000 to $7,499 | 0 (0.0%) | 20 (9.8%) |
| $7,500 to $9,999 | 0 (0.0%) | 0 (0.0%) |
| $10,000 to $12,499 | 0 (0.0%) | 0 (0.0%) |
| $12,500 to $14,999 | 0 (0.0%) | 6 (2.9%) |
| $15,000 to $17,499 | 69 (18.9%) | 0 (0.0%) |
| $17,500 to $19,999 | 0 (0.0%) | 4 (2.0%) |
| $20,000 to $22,499 | 14 (3.8%) | 20 (9.8%) |
| $22,500 to $24,999 | 0 (0.0%) | 0 (0.0%) |
| $25,000 to $29,999 | 6 (1.6%) | 0 (0.0%) |
| $30,000 to $34,999 | 15 (4.1%) | 0 (0.0%) |
| $35,000 to $39,999 | 49 (13.4%) | 44 (21.6%) |
| $40,000 to $44,999 | 0 (0.0%) | 0 (0.0%) |
| $45,000 to $49,999 | 0 (0.0%) | 0 (0.0%) |
| $50,000 to $54,999 | 0 (0.0%) | 0 (0.0%) |
| $55,000 to $64,999 | 62 (16.9%) | 0 (0.0%) |
| $65,000 to $74,999 | 25 (6.8%) | 0 (0.0%) |
| $75,000 to $99,999 | 8 (2.2%) | 7 (3.4%) |
| $100,000+ | 110 (30.0%) | 58 (28.4%) |
| Total | 366 (100.0%) | 204 (100.0%) |
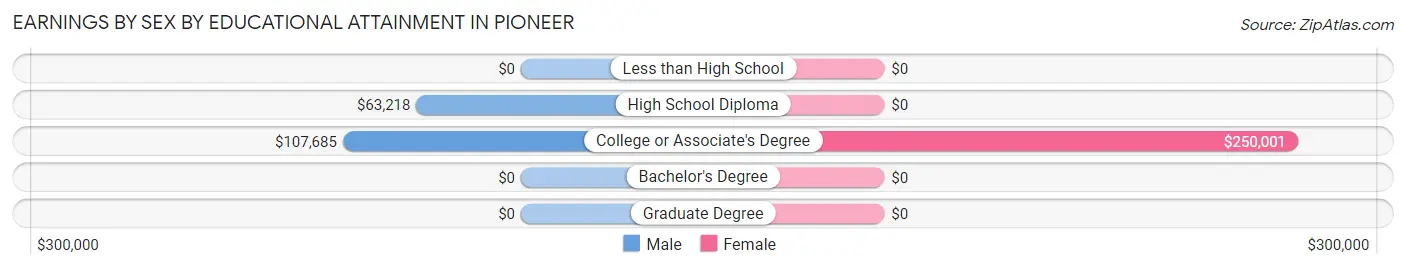
Earnings by Sex by Educational Attainment in Pioneer
| Educational Attainment | Male Income | Female Income |
| Less than High School | - | - |
| High School Diploma | $63,218 | $0 |
| College or Associate's Degree | $107,685 | $250,001 |
| Bachelor's Degree | - | - |
| Graduate Degree | - | - |
| Total | $64,745 | $0 |
Family Income in Pioneer
Family Income Brackets in Pioneer
According to the Pioneer family income data, there are 82 families falling into the $35,000 to $49,999 income range, which is the most common income bracket and makes up 23.2% of all families.
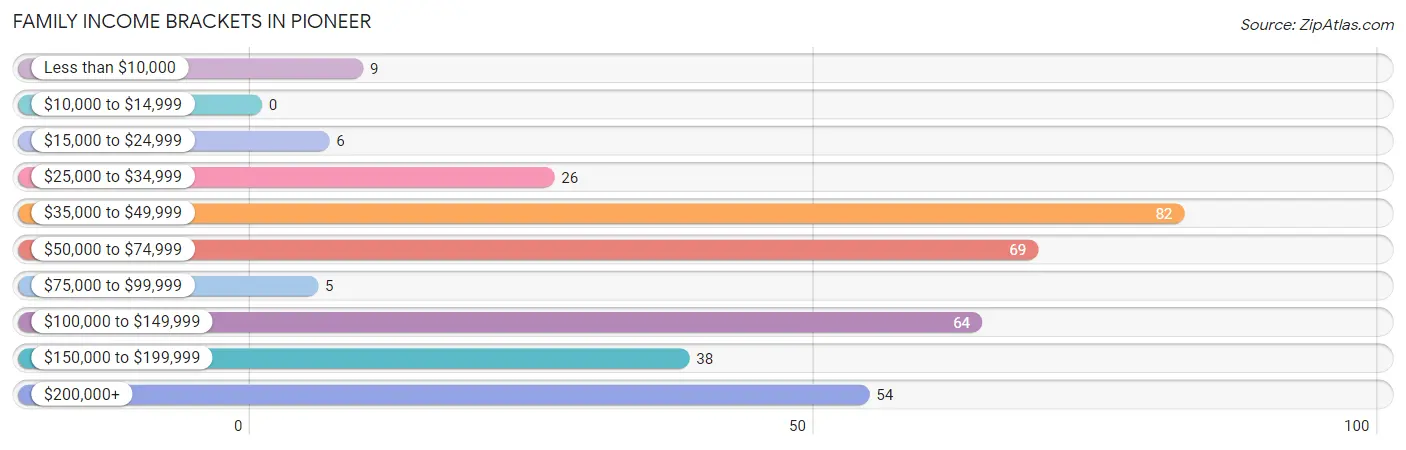
| Income Bracket | # Families | % Families |
| Less than $10,000 | 9 | 2.5% |
| $10,000 to $14,999 | 0 | 0.0% |
| $15,000 to $24,999 | 6 | 1.7% |
| $25,000 to $34,999 | 26 | 7.4% |
| $35,000 to $49,999 | 82 | 23.2% |
| $50,000 to $74,999 | 69 | 19.5% |
| $75,000 to $99,999 | 5 | 1.4% |
| $100,000 to $149,999 | 64 | 18.1% |
| $150,000 to $199,999 | 38 | 10.8% |
| $200,000+ | 54 | 15.3% |
Family Income by Famaliy Size in Pioneer
2-person families (183 | 51.8%) account for the highest median family income in Pioneer with $109,550 per family, while 2-person families (183 | 51.8%) have the highest median income of $54,775 per family member.
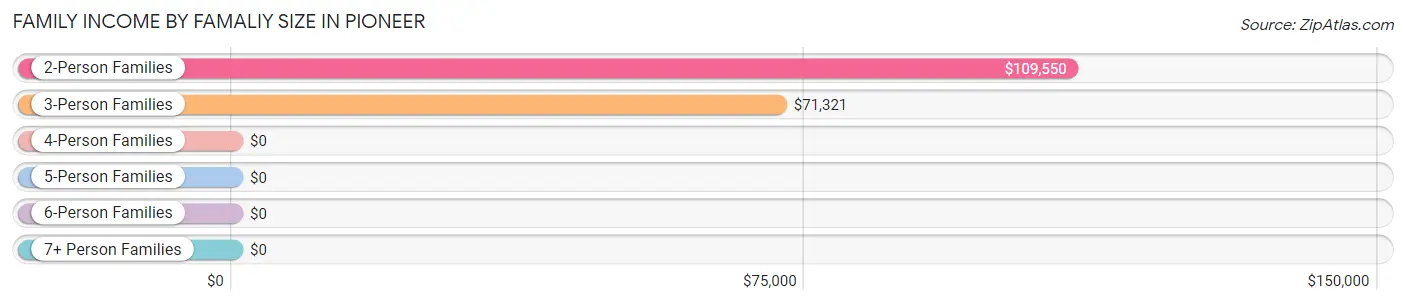
| Income Bracket | # Families | Median Income |
| 2-Person Families | 183 (51.8%) | $109,550 |
| 3-Person Families | 49 (13.9%) | $71,321 |
| 4-Person Families | 111 (31.4%) | $0 |
| 5-Person Families | 10 (2.8%) | $0 |
| 6-Person Families | 0 (0.0%) | $0 |
| 7+ Person Families | 0 (0.0%) | $0 |
| Total | 353 (100.0%) | $71,393 |
Family Income by Number of Earners in Pioneer
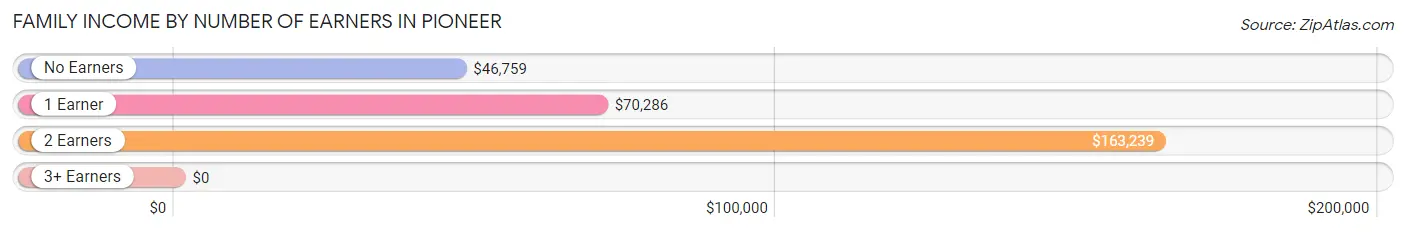
| Number of Earners | # Families | Median Income |
| No Earners | 92 (26.1%) | $46,759 |
| 1 Earner | 106 (30.0%) | $70,286 |
| 2 Earners | 155 (43.9%) | $163,239 |
| 3+ Earners | 0 (0.0%) | $0 |
| Total | 353 (100.0%) | $71,393 |
Household Income in Pioneer
Household Income Brackets in Pioneer
With 128 households falling in the category, the $100,000 to $149,999 income range is the most frequent in Pioneer, accounting for 26.0% of all households.
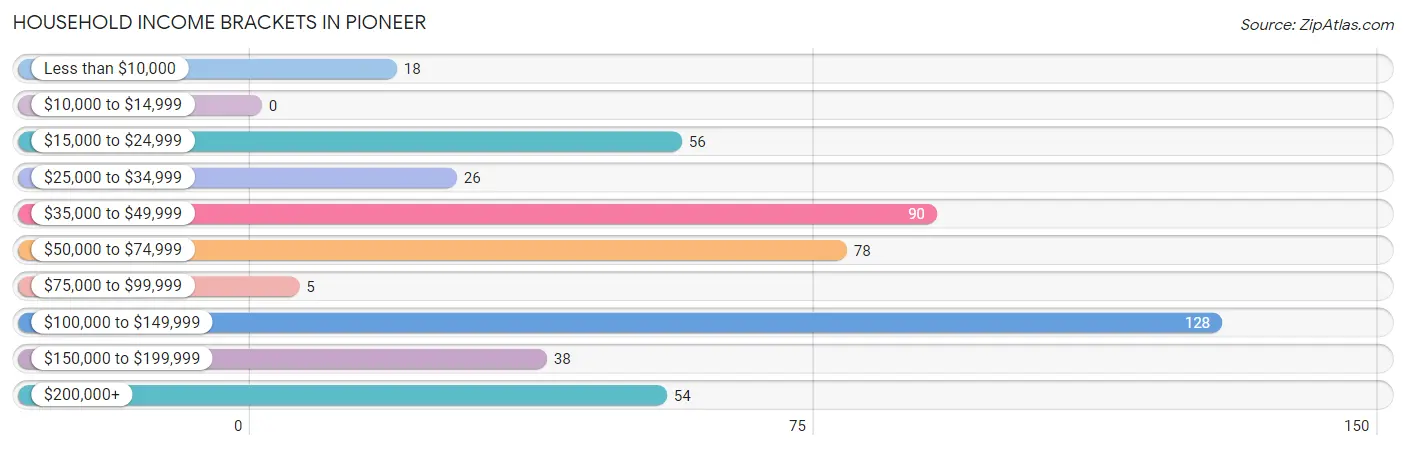
| Income Bracket | # Households | % Households |
| Less than $10,000 | 18 | 3.7% |
| $10,000 to $14,999 | 0 | 0.0% |
| $15,000 to $24,999 | 56 | 11.4% |
| $25,000 to $34,999 | 26 | 5.3% |
| $35,000 to $49,999 | 90 | 18.3% |
| $50,000 to $74,999 | 78 | 15.8% |
| $75,000 to $99,999 | 5 | 1.0% |
| $100,000 to $149,999 | 128 | 26.0% |
| $150,000 to $199,999 | 38 | 7.7% |
| $200,000+ | 54 | 11.0% |
Household Income by Householder Age in Pioneer
The median household income in Pioneer is $71,278, with the highest median household income of $163,295 found in the 45 to 64 years age bracket for the primary householder. A total of 154 households (31.2%) fall into this category.
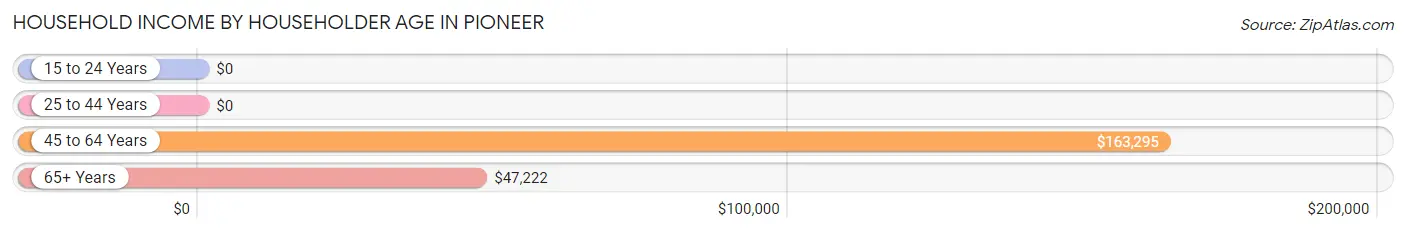
| Income Bracket | # Households | Median Income |
| 15 to 24 Years | 0 (0.0%) | $0 |
| 25 to 44 Years | 143 (29.0%) | $0 |
| 45 to 64 Years | 154 (31.2%) | $163,295 |
| 65+ Years | 196 (39.8%) | $47,222 |
| Total | 493 (100.0%) | $71,278 |
Poverty in Pioneer
Income Below Poverty by Sex and Age in Pioneer
With 6.6% poverty level for males and 10.8% for females among the residents of Pioneer, 45 to 54 year old males and 25 to 34 year old females are the most vulnerable to poverty, with 10 males (55.6%) and 6 females (30.0%) in their respective age groups living below the poverty level.
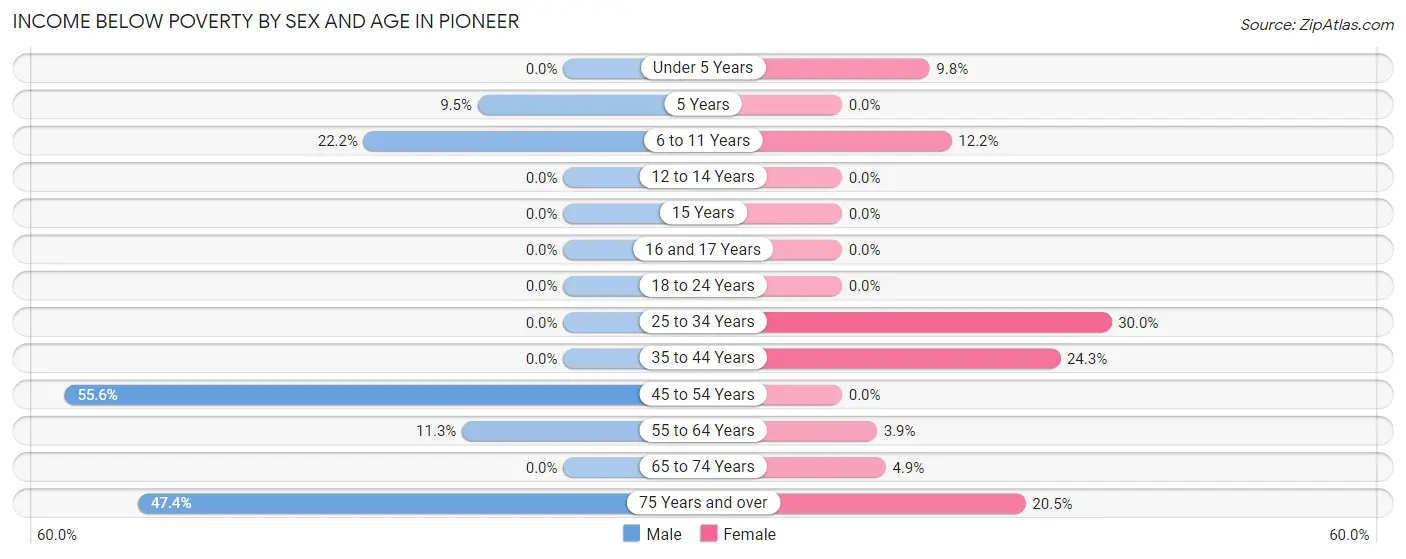
| Age Bracket | Male | Female |
| Under 5 Years | 0 (0.0%) | 4 (9.8%) |
| 5 Years | 6 (9.5%) | 0 (0.0%) |
| 6 to 11 Years | 6 (22.2%) | 5 (12.2%) |
| 12 to 14 Years | 0 (0.0%) | 0 (0.0%) |
| 15 Years | 0 (0.0%) | 0 (0.0%) |
| 16 and 17 Years | 0 (0.0%) | 0 (0.0%) |
| 18 to 24 Years | 0 (0.0%) | 0 (0.0%) |
| 25 to 34 Years | 0 (0.0%) | 6 (30.0%) |
| 35 to 44 Years | 0 (0.0%) | 26 (24.3%) |
| 45 to 54 Years | 10 (55.6%) | 0 (0.0%) |
| 55 to 64 Years | 16 (11.3%) | 6 (3.9%) |
| 65 to 74 Years | 0 (0.0%) | 9 (4.9%) |
| 75 Years and over | 9 (47.4%) | 9 (20.4%) |
| Total | 47 (6.6%) | 65 (10.8%) |
Income Above Poverty by Sex and Age in Pioneer
According to the poverty statistics in Pioneer, males aged 15 years and females aged 15 years are the age groups that are most secure financially, with 100.0% of males and 100.0% of females in these age groups living above the poverty line.
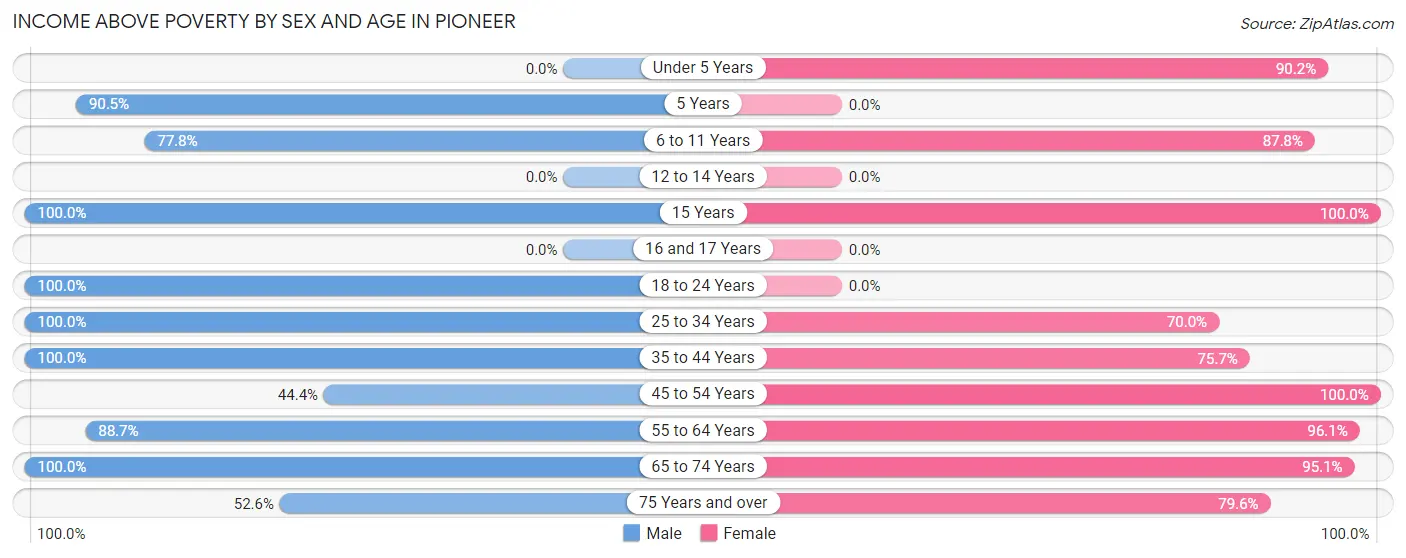
| Age Bracket | Male | Female |
| Under 5 Years | 0 (0.0%) | 37 (90.2%) |
| 5 Years | 57 (90.5%) | 0 (0.0%) |
| 6 to 11 Years | 21 (77.8%) | 36 (87.8%) |
| 12 to 14 Years | 0 (0.0%) | 0 (0.0%) |
| 15 Years | 39 (100.0%) | 5 (100.0%) |
| 16 and 17 Years | 0 (0.0%) | 0 (0.0%) |
| 18 to 24 Years | 69 (100.0%) | 0 (0.0%) |
| 25 to 34 Years | 22 (100.0%) | 14 (70.0%) |
| 35 to 44 Years | 161 (100.0%) | 81 (75.7%) |
| 45 to 54 Years | 8 (44.4%) | 7 (100.0%) |
| 55 to 64 Years | 126 (88.7%) | 148 (96.1%) |
| 65 to 74 Years | 158 (100.0%) | 176 (95.1%) |
| 75 Years and over | 10 (52.6%) | 35 (79.5%) |
| Total | 671 (93.4%) | 539 (89.2%) |
Income Below Poverty Among Married-Couple Families in Pioneer
The poverty statistics for married-couple families in Pioneer show that 6.7% or 19 of the total 285 families live below the poverty line. Families with 1 or 2 children have the highest poverty rate of 10.4%, comprising of 10 families. On the other hand, families with no children have the lowest poverty rate of 4.8%, which includes 9 families.
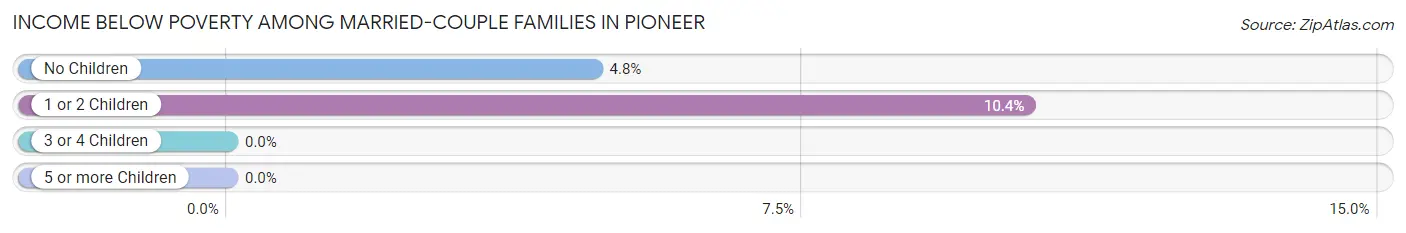
| Children | Above Poverty | Below Poverty |
| No Children | 180 (95.2%) | 9 (4.8%) |
| 1 or 2 Children | 86 (89.6%) | 10 (10.4%) |
| 3 or 4 Children | 0 (0.0%) | 0 (0.0%) |
| 5 or more Children | 0 (0.0%) | 0 (0.0%) |
| Total | 266 (93.3%) | 19 (6.7%) |
Income Below Poverty Among Single-Parent Households in Pioneer
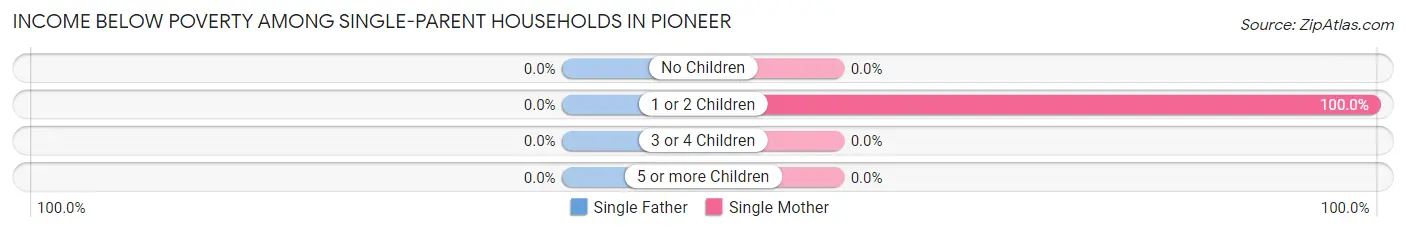
| Children | Single Father | Single Mother |
| No Children | 0 (0.0%) | 0 (0.0%) |
| 1 or 2 Children | 0 (0.0%) | 6 (100.0%) |
| 3 or 4 Children | 0 (0.0%) | 0 (0.0%) |
| 5 or more Children | 0 (0.0%) | 0 (0.0%) |
| Total | 0 (0.0%) | 6 (14.6%) |
Income Below Poverty Among Married-Couple vs Single-Parent Households in Pioneer
The poverty data for Pioneer shows that 19 of the married-couple family households (6.7%) and 6 of the single-parent households (8.8%) are living below the poverty level. Within the married-couple family households, those with 1 or 2 children have the highest poverty rate, with 10 households (10.4%) falling below the poverty line. Among the single-parent households, those with 1 or 2 children have the highest poverty rate, with 6 household (100.0%) living below poverty.
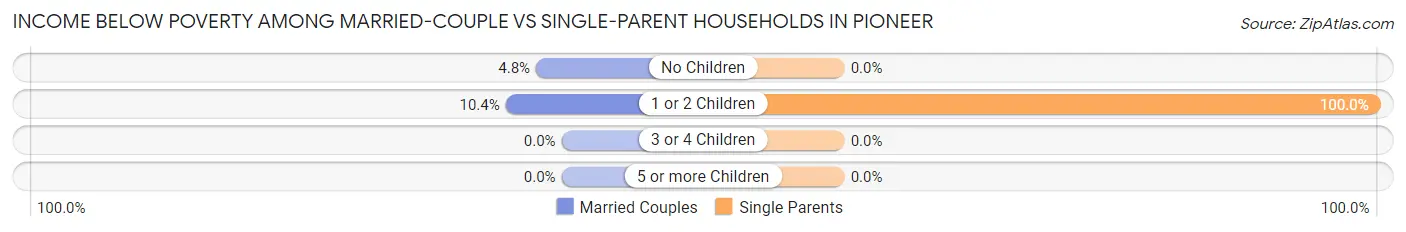
| Children | Married-Couple Families | Single-Parent Households |
| No Children | 9 (4.8%) | 0 (0.0%) |
| 1 or 2 Children | 10 (10.4%) | 6 (100.0%) |
| 3 or 4 Children | 0 (0.0%) | 0 (0.0%) |
| 5 or more Children | 0 (0.0%) | 0 (0.0%) |
| Total | 19 (6.7%) | 6 (8.8%) |
Race in Pioneer
The most populous races in Pioneer are White / Caucasian (1,231 | 93.1%), Hispanic or Latino (297 | 22.5%), and Two or more Races (47 | 3.6%).
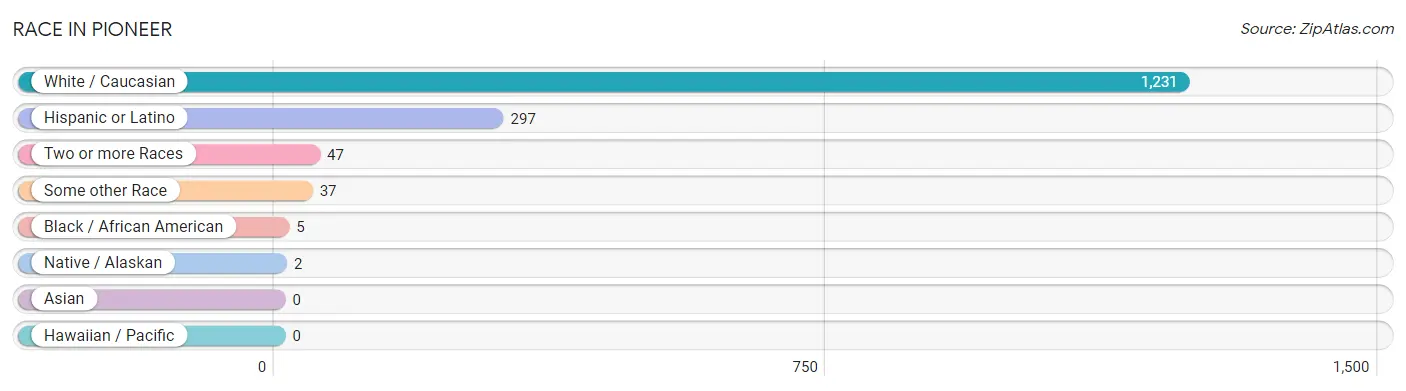
| Race | # Population | % Population |
| Asian | 0 | 0.0% |
| Black / African American | 5 | 0.4% |
| Hawaiian / Pacific | 0 | 0.0% |
| Hispanic or Latino | 297 | 22.5% |
| Native / Alaskan | 2 | 0.2% |
| White / Caucasian | 1,231 | 93.1% |
| Two or more Races | 47 | 3.6% |
| Some other Race | 37 | 2.8% |
| Total | 1,322 | 100.0% |
Ancestry in Pioneer
The most populous ancestries reported in Pioneer are Irish (506 | 38.3%), Mexican (259 | 19.6%), American (119 | 9.0%), Italian (111 | 8.4%), and German (110 | 8.3%), together accounting for 83.6% of all Pioneer residents.
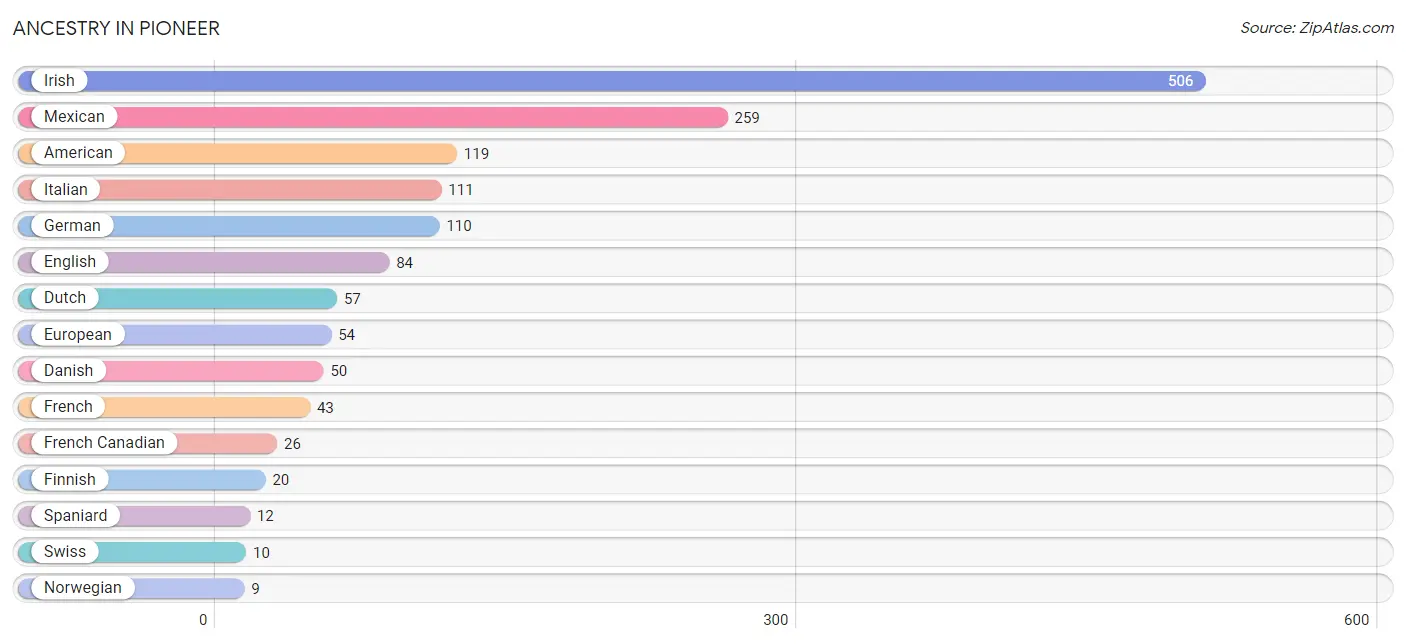
| Ancestry | # Population | % Population |
| American | 119 | 9.0% |
| Danish | 50 | 3.8% |
| Dutch | 57 | 4.3% |
| English | 84 | 6.4% |
| European | 54 | 4.1% |
| Finnish | 20 | 1.5% |
| French | 43 | 3.3% |
| French Canadian | 26 | 2.0% |
| German | 110 | 8.3% |
| Hungarian | 7 | 0.5% |
| Irish | 506 | 38.3% |
| Italian | 111 | 8.4% |
| Mexican | 259 | 19.6% |
| Norwegian | 9 | 0.7% |
| Portuguese | 6 | 0.4% |
| Scotch-Irish | 8 | 0.6% |
| Scottish | 6 | 0.4% |
| Spaniard | 12 | 0.9% |
| Swiss | 10 | 0.8% | View All 19 Rows |
Immigrants in Pioneer

| Immigration Origin | # Population | % Population | View All 0 Rows |
Sex and Age in Pioneer
Sex and Age in Pioneer
The most populous age groups in Pioneer are 65 to 69 Years (133 | 18.5%) for men and 65 to 69 Years (161 | 26.7%) for women.
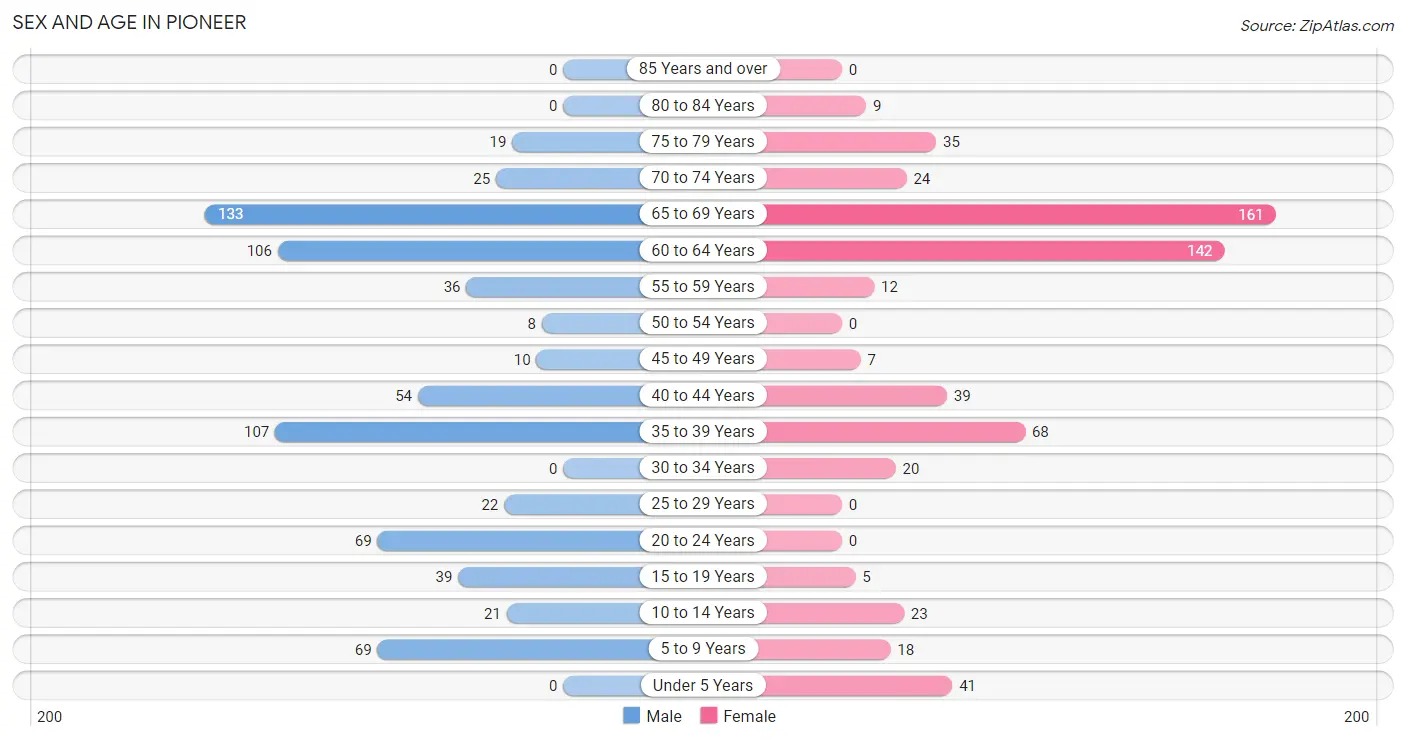
| Age Bracket | Male | Female |
| Under 5 Years | 0 (0.0%) | 41 (6.8%) |
| 5 to 9 Years | 69 (9.6%) | 18 (3.0%) |
| 10 to 14 Years | 21 (2.9%) | 23 (3.8%) |
| 15 to 19 Years | 39 (5.4%) | 5 (0.8%) |
| 20 to 24 Years | 69 (9.6%) | 0 (0.0%) |
| 25 to 29 Years | 22 (3.1%) | 0 (0.0%) |
| 30 to 34 Years | 0 (0.0%) | 20 (3.3%) |
| 35 to 39 Years | 107 (14.9%) | 68 (11.3%) |
| 40 to 44 Years | 54 (7.5%) | 39 (6.5%) |
| 45 to 49 Years | 10 (1.4%) | 7 (1.2%) |
| 50 to 54 Years | 8 (1.1%) | 0 (0.0%) |
| 55 to 59 Years | 36 (5.0%) | 12 (2.0%) |
| 60 to 64 Years | 106 (14.8%) | 142 (23.5%) |
| 65 to 69 Years | 133 (18.5%) | 161 (26.7%) |
| 70 to 74 Years | 25 (3.5%) | 24 (4.0%) |
| 75 to 79 Years | 19 (2.6%) | 35 (5.8%) |
| 80 to 84 Years | 0 (0.0%) | 9 (1.5%) |
| 85 Years and over | 0 (0.0%) | 0 (0.0%) |
| Total | 718 (100.0%) | 604 (100.0%) |
Families and Households in Pioneer
Median Family Size in Pioneer
The median family size in Pioneer is 3.27 persons per family, with single female/mother families (41 | 11.6%) accounting for the largest median family size of 4.17 persons per family. On the other hand, married-couple families (285 | 80.7%) represent the smallest median family size with 3.08 persons per family.
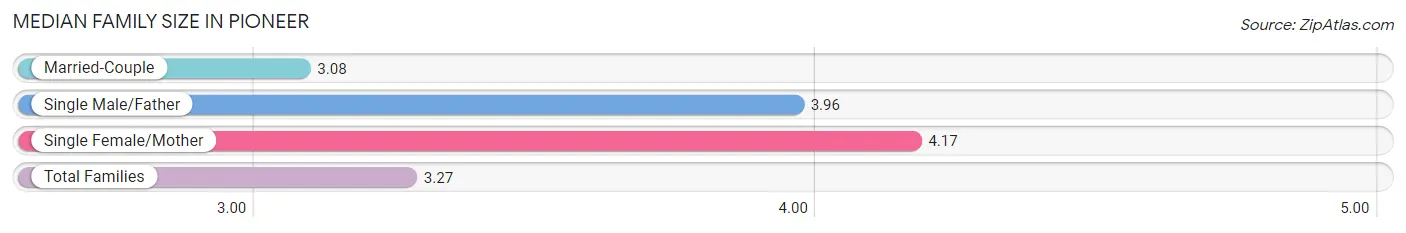
| Family Type | # Families | Family Size |
| Married-Couple | 285 (80.7%) | 3.08 |
| Single Male/Father | 27 (7.6%) | 3.96 |
| Single Female/Mother | 41 (11.6%) | 4.17 |
| Total Families | 353 (100.0%) | 3.27 |
Median Household Size in Pioneer
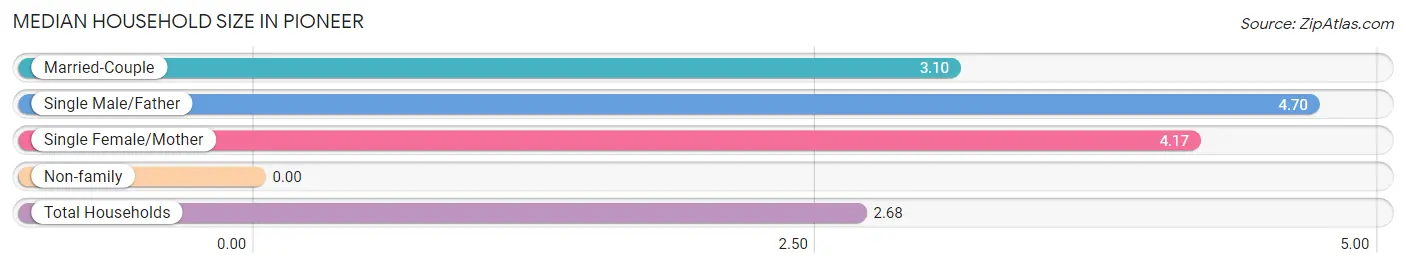
| Household Type | # Households | Household Size |
| Married-Couple | 285 (57.8%) | 3.10 |
| Single Male/Father | 27 (5.5%) | 4.70 |
| Single Female/Mother | 41 (8.3%) | 4.17 |
| Non-family | 140 (28.4%) | - |
| Total Households | 493 (100.0%) | 2.68 |
Household Size by Marriage Status in Pioneer
Out of a total of 493 households in Pioneer, 353 (71.6%) are family households, while 140 (28.4%) are nonfamily households. The most numerous type of family households are 2-person households, comprising 183, and the most common type of nonfamily households are 1-person households, comprising 140.
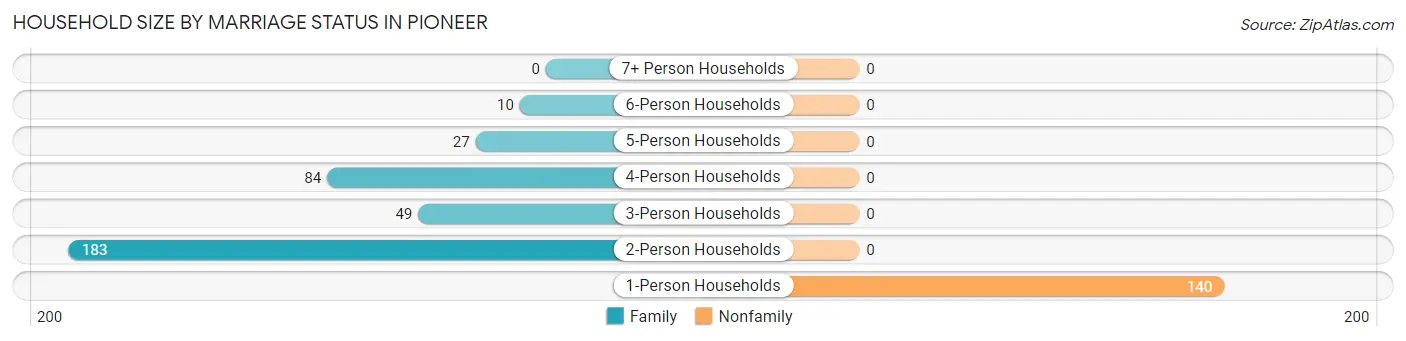
| Household Size | Family Households | Nonfamily Households |
| 1-Person Households | - | 140 (28.4%) |
| 2-Person Households | 183 (37.1%) | 0 (0.0%) |
| 3-Person Households | 49 (9.9%) | 0 (0.0%) |
| 4-Person Households | 84 (17.0%) | 0 (0.0%) |
| 5-Person Households | 27 (5.5%) | 0 (0.0%) |
| 6-Person Households | 10 (2.0%) | 0 (0.0%) |
| 7+ Person Households | 0 (0.0%) | 0 (0.0%) |
| Total | 353 (71.6%) | 140 (28.4%) |
Female Fertility in Pioneer
Fertility by Age in Pioneer
| Age Bracket | Women with Births | Births / 1,000 Women |
| 15 to 19 years | 0 (0.0%) | 0.0 |
| 20 to 34 years | 0 (0.0%) | 0.0 |
| 35 to 50 years | 0 (0.0%) | 0.0 |
| Total | 0 (0.0%) | 0.0 |
Fertility by Age by Marriage Status in Pioneer
| Age Bracket | Married | Unmarried |
| 15 to 19 years | 0 (0.0%) | 0 (0.0%) |
| 20 to 34 years | 0 (0.0%) | 0 (0.0%) |
| 35 to 50 years | 0 (0.0%) | 0 (0.0%) |
| Total | 0 (0.0%) | 0 (0.0%) |
Fertility by Education in Pioneer
| Educational Attainment | Women with Births | Births / 1,000 Women |
| Less than High School | 0 (0.0%) | 0.0 |
| High School Diploma | 0 (0.0%) | 0.0 |
| College or Associate's Degree | 0 (0.0%) | 0.0 |
| Bachelor's Degree | 0 (0.0%) | 0.0 |
| Graduate Degree | 0 (0.0%) | 0.0 |
| Total | 0 (0.0%) | 0.0 |
Fertility by Education by Marriage Status in Pioneer
| Educational Attainment | Married | Unmarried |
| Less than High School | 0 (0.0%) | 0 (0.0%) |
| High School Diploma | 0 (0.0%) | 0 (0.0%) |
| College or Associate's Degree | 0 (0.0%) | 0 (0.0%) |
| Bachelor's Degree | 0 (0.0%) | 0 (0.0%) |
| Graduate Degree | 0 (0.0%) | 0 (0.0%) |
| Total | 0 (0.0%) | 0 (0.0%) |
Employment Characteristics in Pioneer
Employment by Class of Employer in Pioneer
Among the 440 employed individuals in Pioneer, private company employees (257 | 58.4%), state government employees (69 | 15.7%), and self-employed (not incorporated) (66 | 15.0%) make up the most common classes of employment.
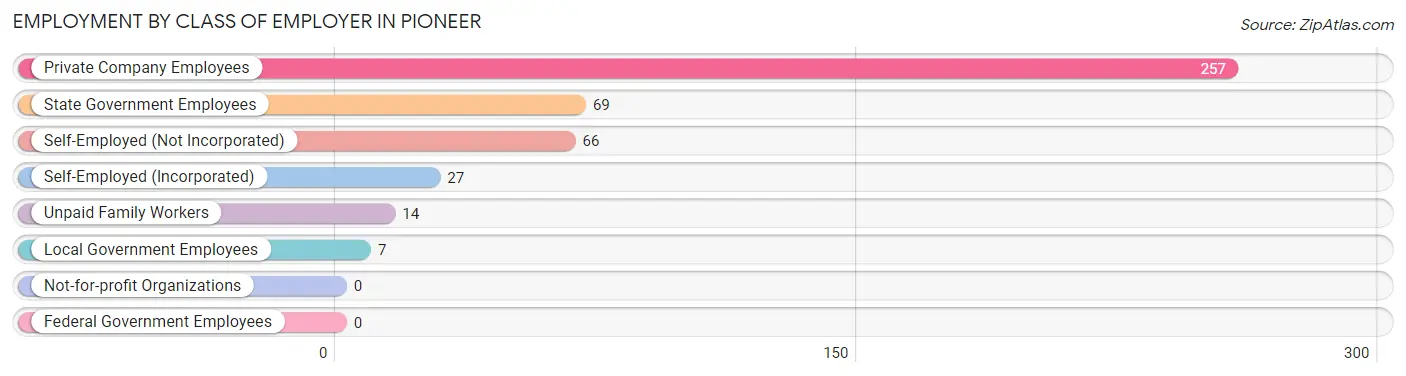
| Employer Class | # Employees | % Employees |
| Private Company Employees | 257 | 58.4% |
| Self-Employed (Incorporated) | 27 | 6.1% |
| Self-Employed (Not Incorporated) | 66 | 15.0% |
| Not-for-profit Organizations | 0 | 0.0% |
| Local Government Employees | 7 | 1.6% |
| State Government Employees | 69 | 15.7% |
| Federal Government Employees | 0 | 0.0% |
| Unpaid Family Workers | 14 | 3.2% |
| Total | 440 | 100.0% |
Employment Status by Age in Pioneer
According to the labor force statistics for Pioneer, out of the total population over 16 years of age (1,106), 53.3% or 589 individuals are in the labor force, with 6.3% or 37 of them unemployed. The age group with the highest labor force participation rate is 20 to 24 years, with 100.0% or 69 individuals in the labor force. Within the labor force, the 35 to 44 years age range has the highest percentage of unemployed individuals, with 15.3% or 37 of them being unemployed.
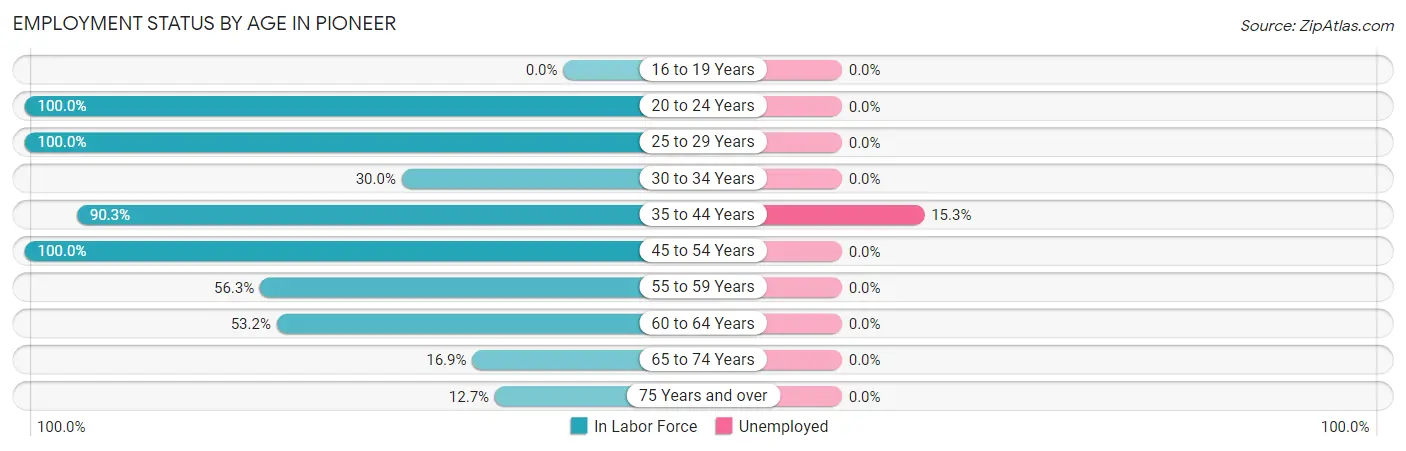
| Age Bracket | In Labor Force | Unemployed |
| 16 to 19 Years | 0 (0.0%) | 0 (0.0%) |
| 20 to 24 Years | 69 (100.0%) | 0 (0.0%) |
| 25 to 29 Years | 22 (100.0%) | 0 (0.0%) |
| 30 to 34 Years | 6 (30.0%) | 0 (0.0%) |
| 35 to 44 Years | 242 (90.3%) | 37 (15.3%) |
| 45 to 54 Years | 25 (100.0%) | 0 (0.0%) |
| 55 to 59 Years | 27 (56.3%) | 0 (0.0%) |
| 60 to 64 Years | 132 (53.2%) | 0 (0.0%) |
| 65 to 74 Years | 58 (16.9%) | 0 (0.0%) |
| 75 Years and over | 8 (12.7%) | 0 (0.0%) |
| Total | 589 (53.3%) | 37 (6.3%) |
Employment Status by Educational Attainment in Pioneer
According to labor force statistics for Pioneer, 71.9% of individuals (454) out of the total population between 25 and 64 years of age (631) are in the labor force, with 8.1% or 37 of them being unemployed. The group with the highest labor force participation rate are those with the educational attainment of high school diploma, with 91.8% or 135 individuals in the labor force. Within the labor force, individuals with college / associate degree education have the highest percentage of unemployment, with 15.9% or 37 of them being unemployed.
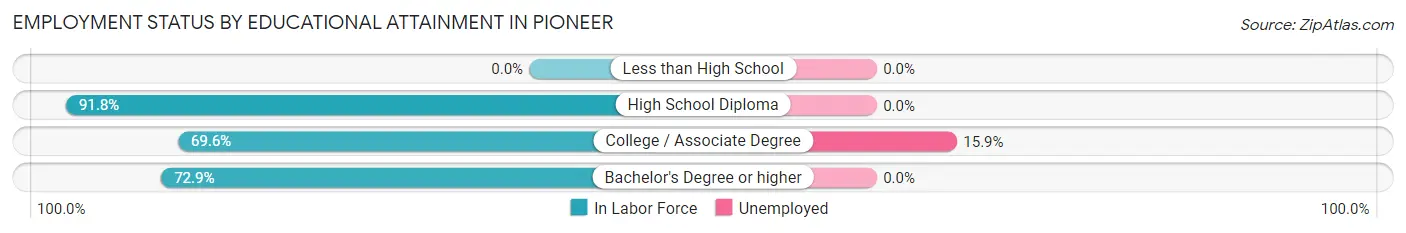
| Educational Attainment | In Labor Force | Unemployed |
| Less than High School | 0 (0.0%) | 0 (0.0%) |
| High School Diploma | 135 (91.8%) | 0 (0.0%) |
| College / Associate Degree | 233 (69.6%) | 53 (15.9%) |
| Bachelor's Degree or higher | 86 (72.9%) | 0 (0.0%) |
| Total | 454 (71.9%) | 51 (8.1%) |
Employment Occupations by Sex in Pioneer
Management, Business, Science and Arts Occupations
The most common Management, Business, Science and Arts occupations in Pioneer are Computers, Engineering & Science (54 | 9.8%), Computers & Mathematics (54 | 9.8%), Management (8 | 1.5%), Community & Social Service (7 | 1.3%), and Education Instruction & Library (7 | 1.3%).
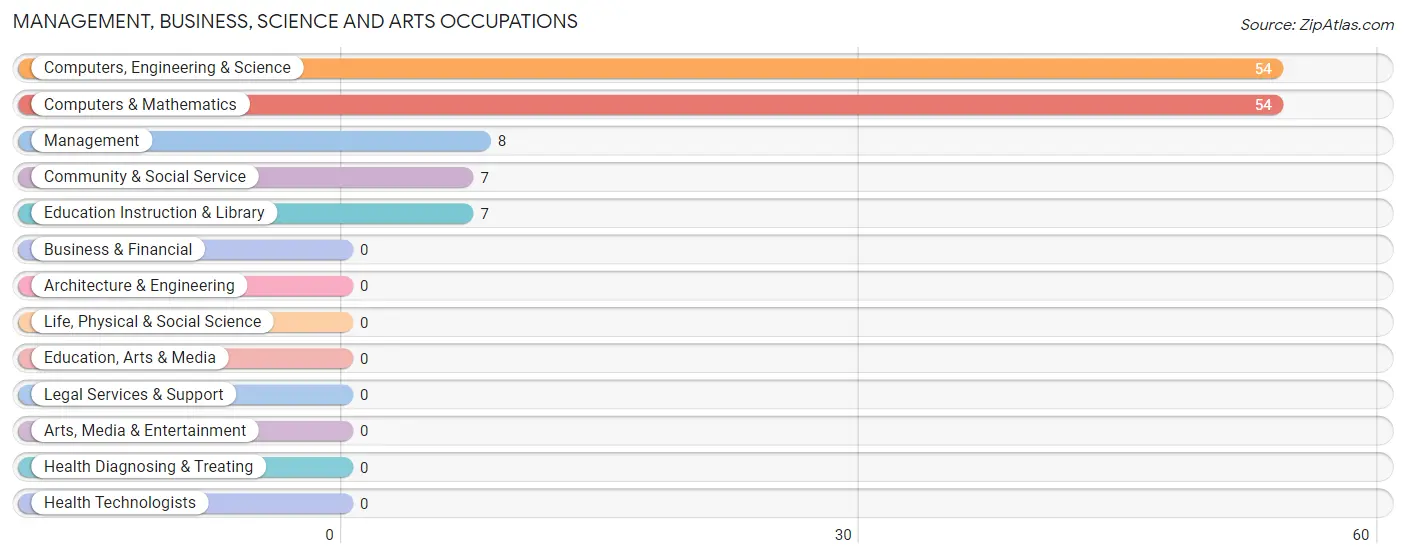
Management, Business, Science and Arts Occupations by Sex
Within the Management, Business, Science and Arts occupations in Pioneer, the most male-oriented occupations are Management (100.0%), Computers, Engineering & Science (100.0%), and Computers & Mathematics (100.0%), while the most female-oriented occupations are Community & Social Service (100.0%), and Education Instruction & Library (100.0%).
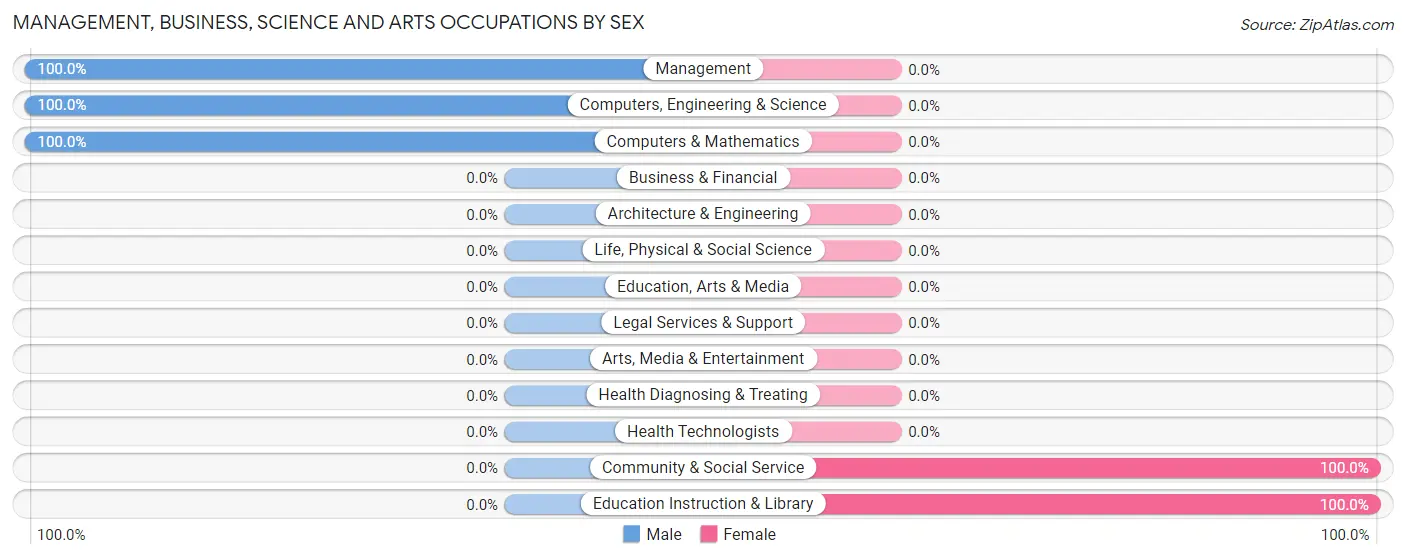
| Occupation | Male | Female |
| Management | 8 (100.0%) | 0 (0.0%) |
| Business & Financial | 0 (0.0%) | 0 (0.0%) |
| Computers, Engineering & Science | 54 (100.0%) | 0 (0.0%) |
| Computers & Mathematics | 54 (100.0%) | 0 (0.0%) |
| Architecture & Engineering | 0 (0.0%) | 0 (0.0%) |
| Life, Physical & Social Science | 0 (0.0%) | 0 (0.0%) |
| Community & Social Service | 0 (0.0%) | 7 (100.0%) |
| Education, Arts & Media | 0 (0.0%) | 0 (0.0%) |
| Legal Services & Support | 0 (0.0%) | 0 (0.0%) |
| Education Instruction & Library | 0 (0.0%) | 7 (100.0%) |
| Arts, Media & Entertainment | 0 (0.0%) | 0 (0.0%) |
| Health Diagnosing & Treating | 0 (0.0%) | 0 (0.0%) |
| Health Technologists | 0 (0.0%) | 0 (0.0%) |
| Total (Category) | 62 (89.9%) | 7 (10.1%) |
| Total (Overall) | 358 (64.9%) | 194 (35.1%) |
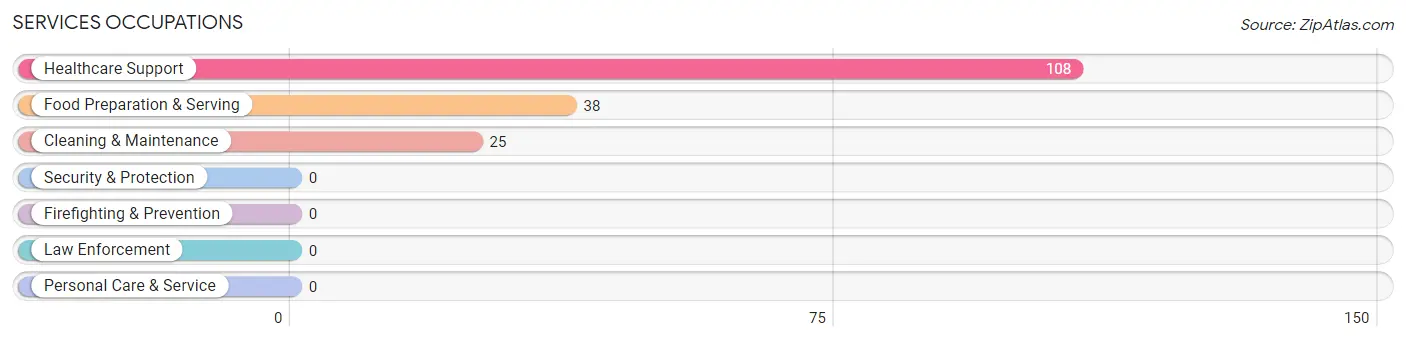
Services Occupations
The most common Services occupations in Pioneer are Healthcare Support (108 | 19.6%), Food Preparation & Serving (38 | 6.9%), and Cleaning & Maintenance (25 | 4.5%).
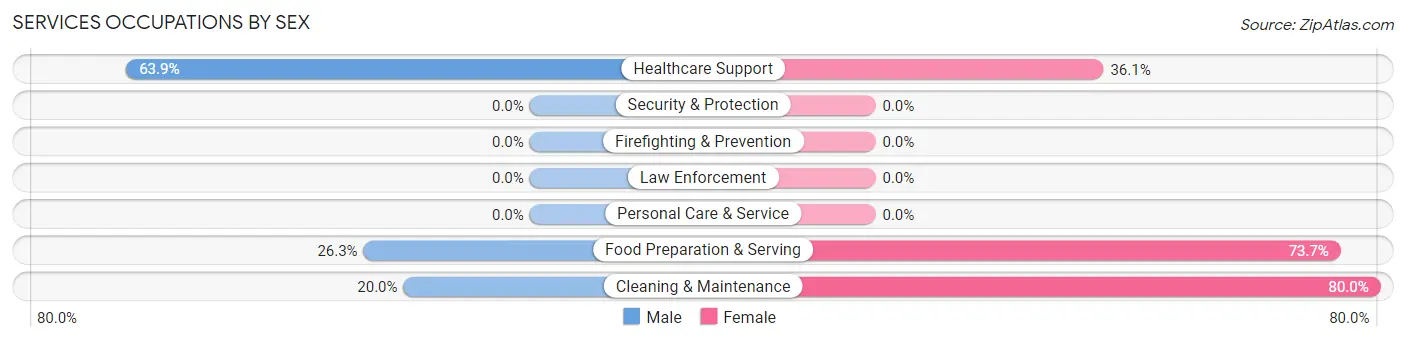
Services Occupations by Sex
Within the Services occupations in Pioneer, the most male-oriented occupations are Healthcare Support (63.9%), Food Preparation & Serving (26.3%), and Cleaning & Maintenance (20.0%), while the most female-oriented occupations are Cleaning & Maintenance (80.0%), Food Preparation & Serving (73.7%), and Healthcare Support (36.1%).
| Occupation | Male | Female |
| Healthcare Support | 69 (63.9%) | 39 (36.1%) |
| Security & Protection | 0 (0.0%) | 0 (0.0%) |
| Firefighting & Prevention | 0 (0.0%) | 0 (0.0%) |
| Law Enforcement | 0 (0.0%) | 0 (0.0%) |
| Food Preparation & Serving | 10 (26.3%) | 28 (73.7%) |
| Cleaning & Maintenance | 5 (20.0%) | 20 (80.0%) |
| Personal Care & Service | 0 (0.0%) | 0 (0.0%) |
| Total (Category) | 84 (49.1%) | 87 (50.9%) |
| Total (Overall) | 358 (64.9%) | 194 (35.1%) |
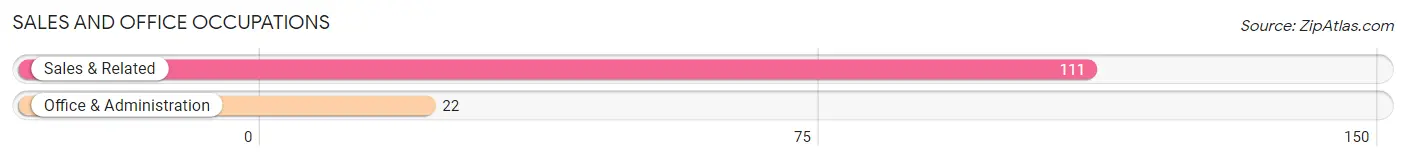
Sales and Office Occupations
The most common Sales and Office occupations in Pioneer are Sales & Related (111 | 20.1%), and Office & Administration (22 | 4.0%).
Sales and Office Occupations by Sex
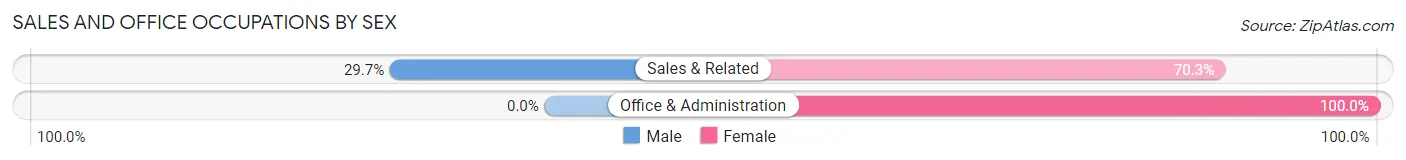
| Occupation | Male | Female |
| Sales & Related | 33 (29.7%) | 78 (70.3%) |
| Office & Administration | 0 (0.0%) | 22 (100.0%) |
| Total (Category) | 33 (24.8%) | 100 (75.2%) |
| Total (Overall) | 358 (64.9%) | 194 (35.1%) |
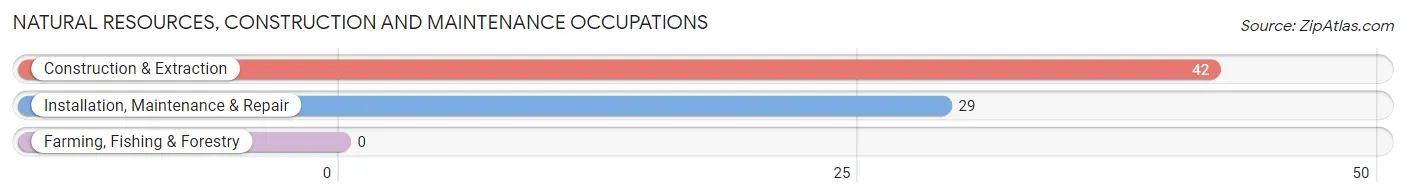
Natural Resources, Construction and Maintenance Occupations
The most common Natural Resources, Construction and Maintenance occupations in Pioneer are Construction & Extraction (42 | 7.6%), and Installation, Maintenance & Repair (29 | 5.2%).
Natural Resources, Construction and Maintenance Occupations by Sex
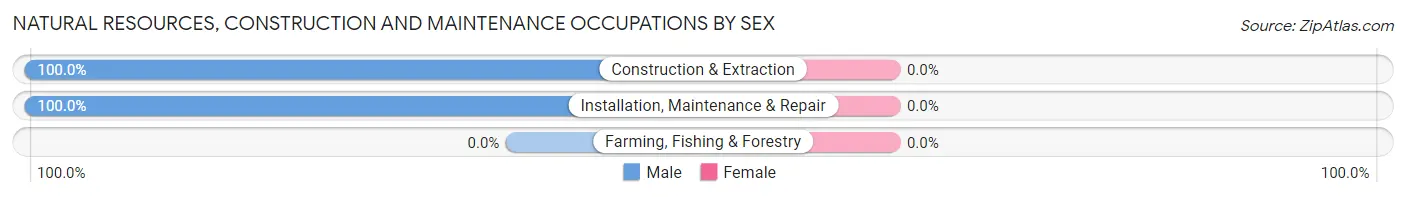
| Occupation | Male | Female |
| Farming, Fishing & Forestry | 0 (0.0%) | 0 (0.0%) |
| Construction & Extraction | 42 (100.0%) | 0 (0.0%) |
| Installation, Maintenance & Repair | 29 (100.0%) | 0 (0.0%) |
| Total (Category) | 71 (100.0%) | 0 (0.0%) |
| Total (Overall) | 358 (64.9%) | 194 (35.1%) |
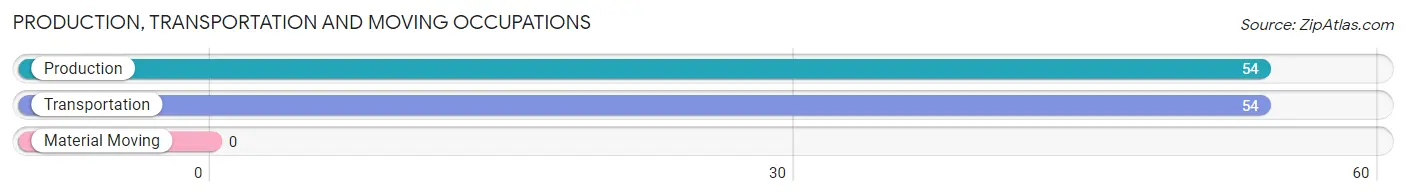
Production, Transportation and Moving Occupations
The most common Production, Transportation and Moving occupations in Pioneer are Production (54 | 9.8%), and Transportation (54 | 9.8%).
Production, Transportation and Moving Occupations by Sex
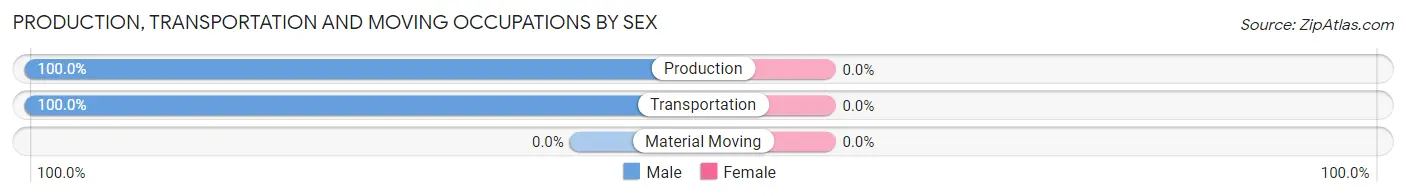
| Occupation | Male | Female |
| Production | 54 (100.0%) | 0 (0.0%) |
| Transportation | 54 (100.0%) | 0 (0.0%) |
| Material Moving | 0 (0.0%) | 0 (0.0%) |
| Total (Category) | 108 (100.0%) | 0 (0.0%) |
| Total (Overall) | 358 (64.9%) | 194 (35.1%) |
Employment Industries by Sex in Pioneer
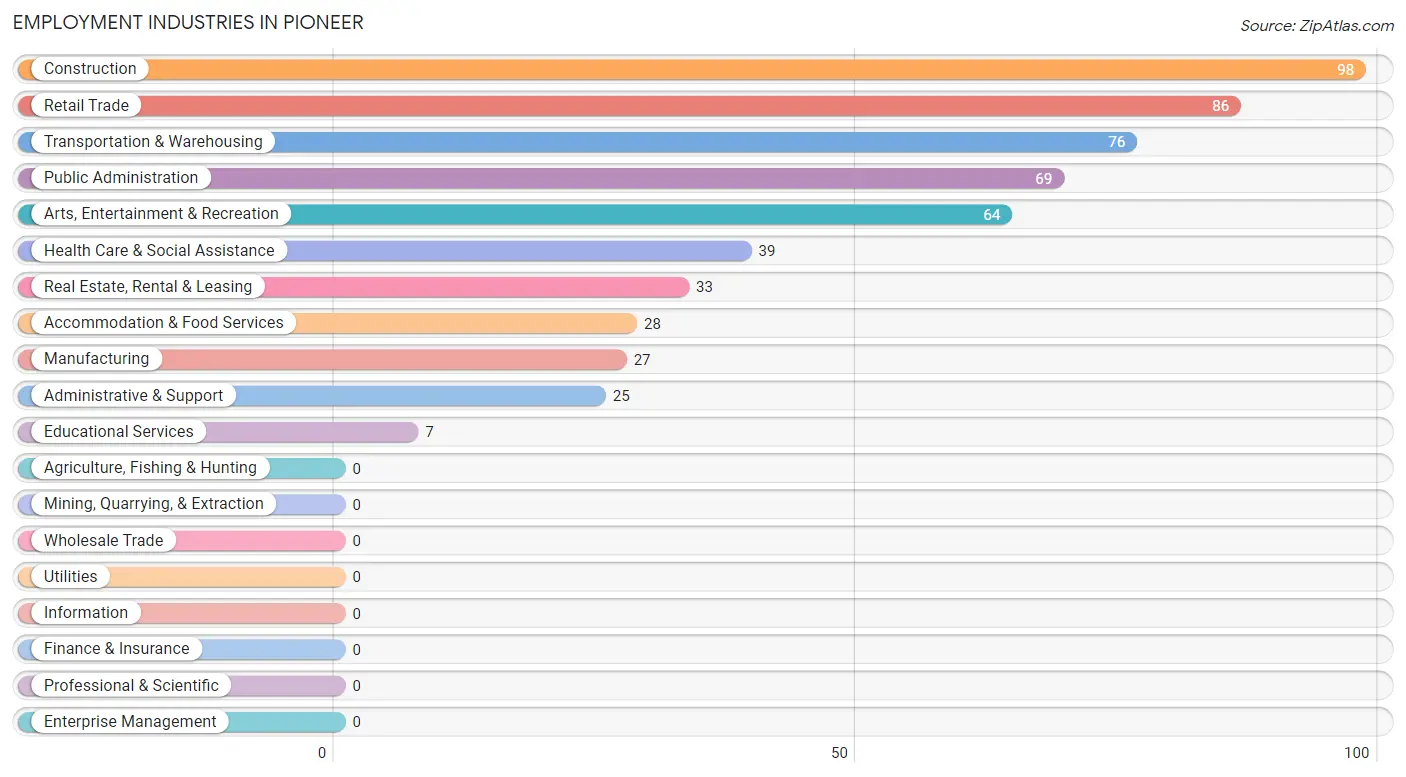
Employment Industries in Pioneer
The major employment industries in Pioneer include Construction (98 | 17.7%), Retail Trade (86 | 15.6%), Transportation & Warehousing (76 | 13.8%), Public Administration (69 | 12.5%), and Arts, Entertainment & Recreation (64 | 11.6%).
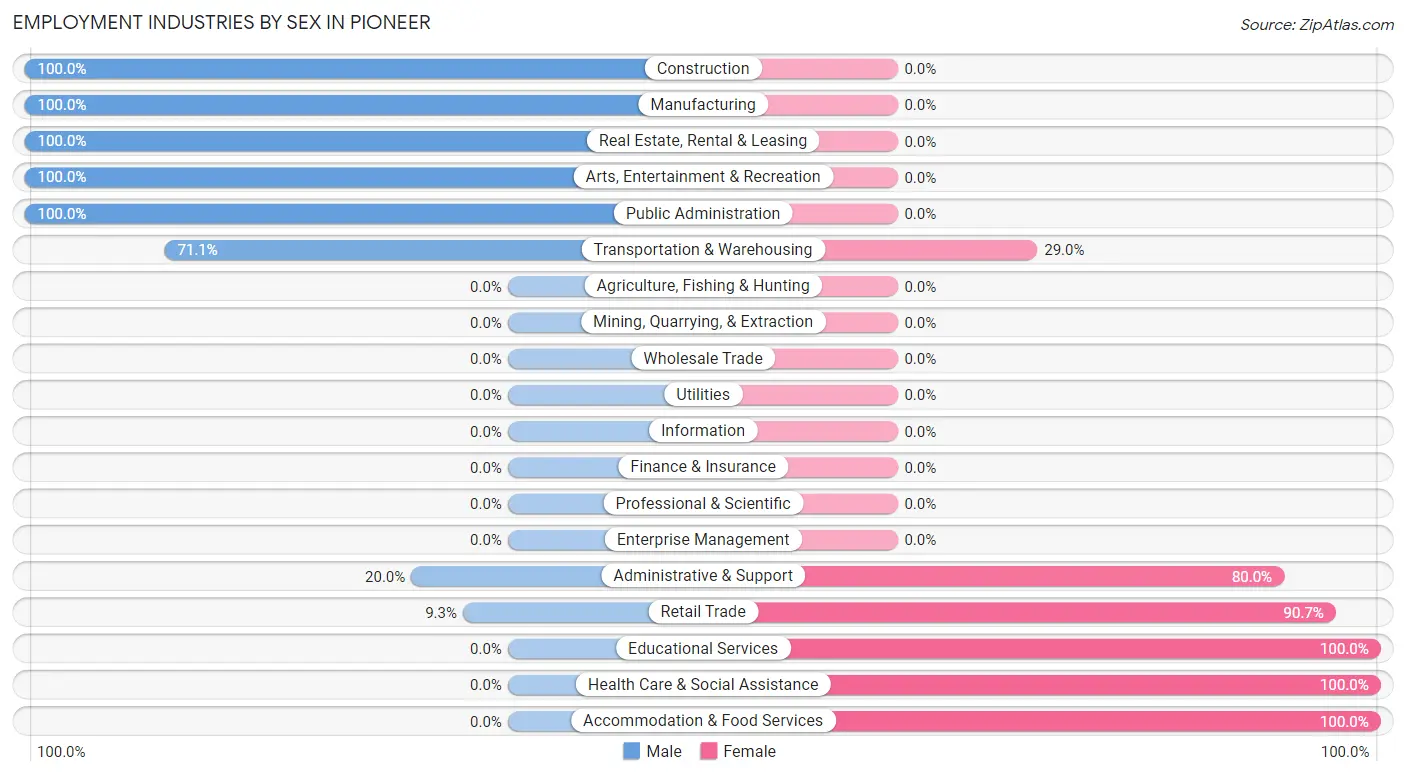
Employment Industries by Sex in Pioneer
The Pioneer industries that see more men than women are Construction (100.0%), Manufacturing (100.0%), and Real Estate, Rental & Leasing (100.0%), whereas the industries that tend to have a higher number of women are Educational Services (100.0%), Health Care & Social Assistance (100.0%), and Accommodation & Food Services (100.0%).
| Industry | Male | Female |
| Agriculture, Fishing & Hunting | 0 (0.0%) | 0 (0.0%) |
| Mining, Quarrying, & Extraction | 0 (0.0%) | 0 (0.0%) |
| Construction | 98 (100.0%) | 0 (0.0%) |
| Manufacturing | 27 (100.0%) | 0 (0.0%) |
| Wholesale Trade | 0 (0.0%) | 0 (0.0%) |
| Retail Trade | 8 (9.3%) | 78 (90.7%) |
| Transportation & Warehousing | 54 (71.1%) | 22 (28.9%) |
| Utilities | 0 (0.0%) | 0 (0.0%) |
| Information | 0 (0.0%) | 0 (0.0%) |
| Finance & Insurance | 0 (0.0%) | 0 (0.0%) |
| Real Estate, Rental & Leasing | 33 (100.0%) | 0 (0.0%) |
| Professional & Scientific | 0 (0.0%) | 0 (0.0%) |
| Enterprise Management | 0 (0.0%) | 0 (0.0%) |
| Administrative & Support | 5 (20.0%) | 20 (80.0%) |
| Educational Services | 0 (0.0%) | 7 (100.0%) |
| Health Care & Social Assistance | 0 (0.0%) | 39 (100.0%) |
| Arts, Entertainment & Recreation | 64 (100.0%) | 0 (0.0%) |
| Accommodation & Food Services | 0 (0.0%) | 28 (100.0%) |
| Public Administration | 69 (100.0%) | 0 (0.0%) |
| Total | 358 (64.9%) | 194 (35.1%) |
Education in Pioneer
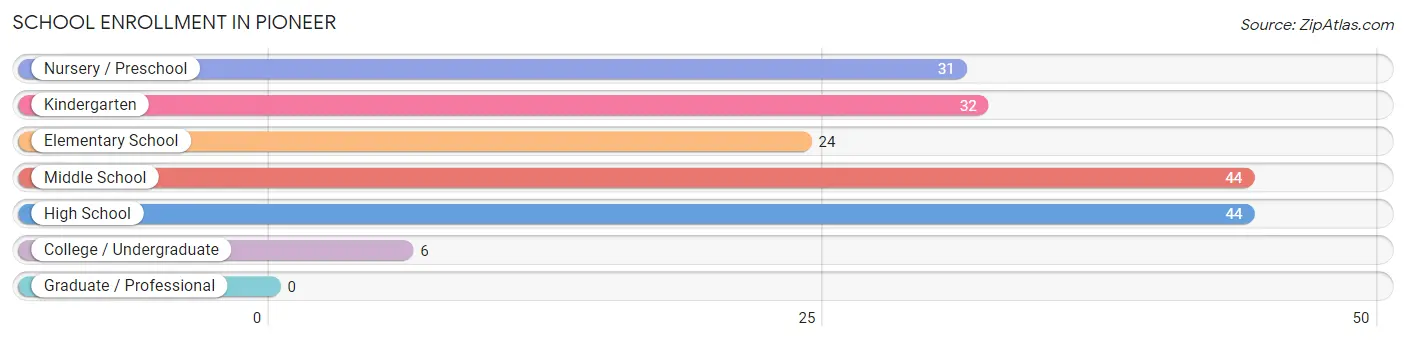
School Enrollment in Pioneer
The most common levels of schooling among the 181 students in Pioneer are middle school (44 | 24.3%), high school (44 | 24.3%), and kindergarten (32 | 17.7%).
| School Level | # Students | % Students |
| Nursery / Preschool | 31 | 17.1% |
| Kindergarten | 32 | 17.7% |
| Elementary School | 24 | 13.3% |
| Middle School | 44 | 24.3% |
| High School | 44 | 24.3% |
| College / Undergraduate | 6 | 3.3% |
| Graduate / Professional | 0 | 0.0% |
| Total | 181 | 100.0% |
School Enrollment by Age by Funding Source in Pioneer
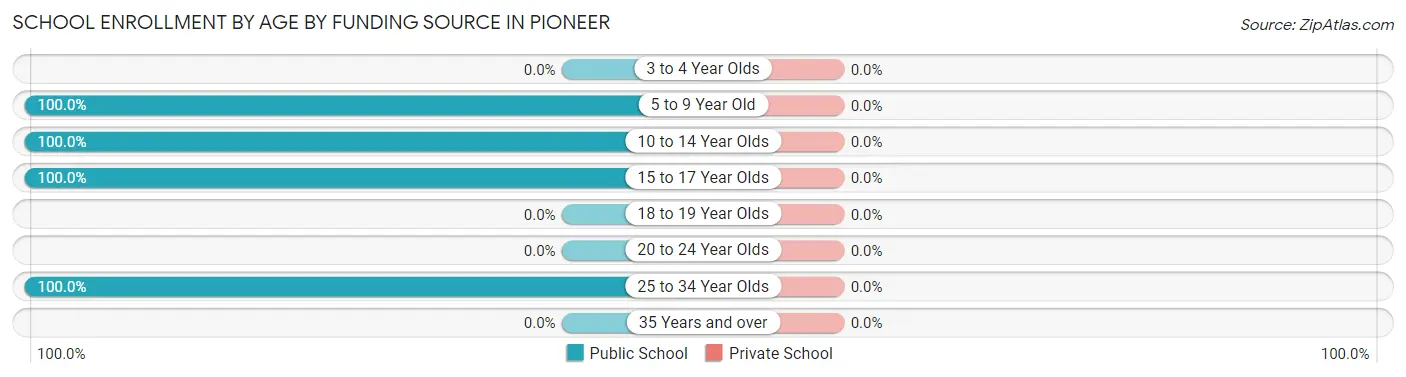
| Age Bracket | Public School | Private School |
| 3 to 4 Year Olds | 0 (0.0%) | 0 (0.0%) |
| 5 to 9 Year Old | 87 (100.0%) | 0 (0.0%) |
| 10 to 14 Year Olds | 44 (100.0%) | 0 (0.0%) |
| 15 to 17 Year Olds | 44 (100.0%) | 0 (0.0%) |
| 18 to 19 Year Olds | 0 (0.0%) | 0 (0.0%) |
| 20 to 24 Year Olds | 0 (0.0%) | 0 (0.0%) |
| 25 to 34 Year Olds | 6 (100.0%) | 0 (0.0%) |
| 35 Years and over | 0 (0.0%) | 0 (0.0%) |
| Total | 181 (100.0%) | 0 (0.0%) |
Educational Attainment by Field of Study in Pioneer
Bio, nature & agricultural (120 | 76.4%), business (24 | 15.3%), education (7 | 4.5%), and psychology (6 | 3.8%) are the most common fields of study among 157 individuals in Pioneer who have obtained a bachelor's degree or higher.
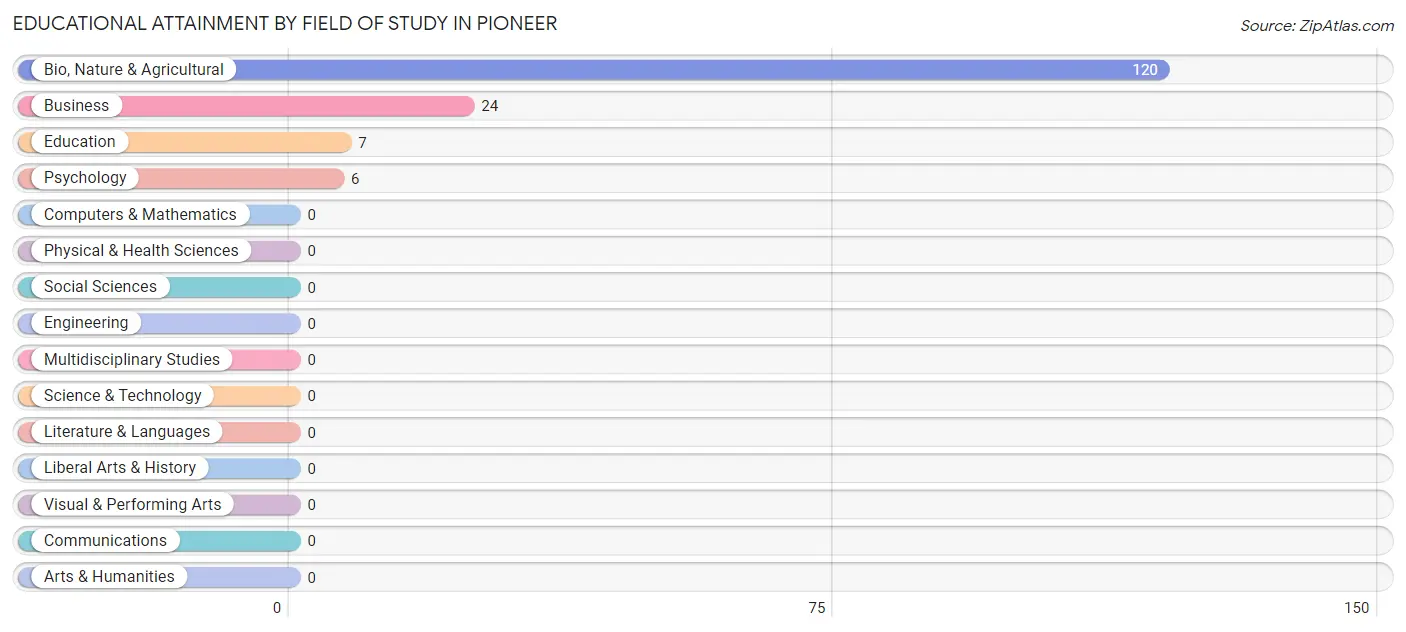
| Field of Study | # Graduates | % Graduates |
| Computers & Mathematics | 0 | 0.0% |
| Bio, Nature & Agricultural | 120 | 76.4% |
| Physical & Health Sciences | 0 | 0.0% |
| Psychology | 6 | 3.8% |
| Social Sciences | 0 | 0.0% |
| Engineering | 0 | 0.0% |
| Multidisciplinary Studies | 0 | 0.0% |
| Science & Technology | 0 | 0.0% |
| Business | 24 | 15.3% |
| Education | 7 | 4.5% |
| Literature & Languages | 0 | 0.0% |
| Liberal Arts & History | 0 | 0.0% |
| Visual & Performing Arts | 0 | 0.0% |
| Communications | 0 | 0.0% |
| Arts & Humanities | 0 | 0.0% |
| Total | 157 | 100.0% |
Transportation & Commute in Pioneer
Vehicle Availability by Sex in Pioneer
The most prevalent vehicle ownership categories in Pioneer are males with 3 vehicles (229, accounting for 75.3%) and females with 3 vehicles (42, making up 168.4%).
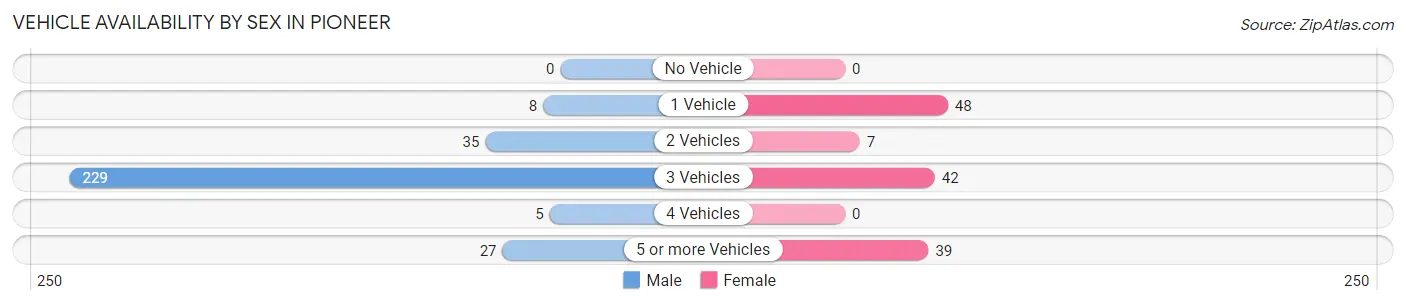
| Vehicles Available | Male | Female |
| No Vehicle | 0 (0.0%) | 0 (0.0%) |
| 1 Vehicle | 8 (2.6%) | 48 (35.3%) |
| 2 Vehicles | 35 (11.5%) | 7 (5.1%) |
| 3 Vehicles | 229 (75.3%) | 42 (30.9%) |
| 4 Vehicles | 5 (1.6%) | 0 (0.0%) |
| 5 or more Vehicles | 27 (8.9%) | 39 (28.7%) |
| Total | 304 (100.0%) | 136 (100.0%) |
Commute Time in Pioneer
The most frequently occuring commute durations in Pioneer are 45 to 59 minutes (76 commuters, 22.2%), 30 to 34 minutes (75 commuters, 21.9%), and 60 to 89 minutes (49 commuters, 14.3%).
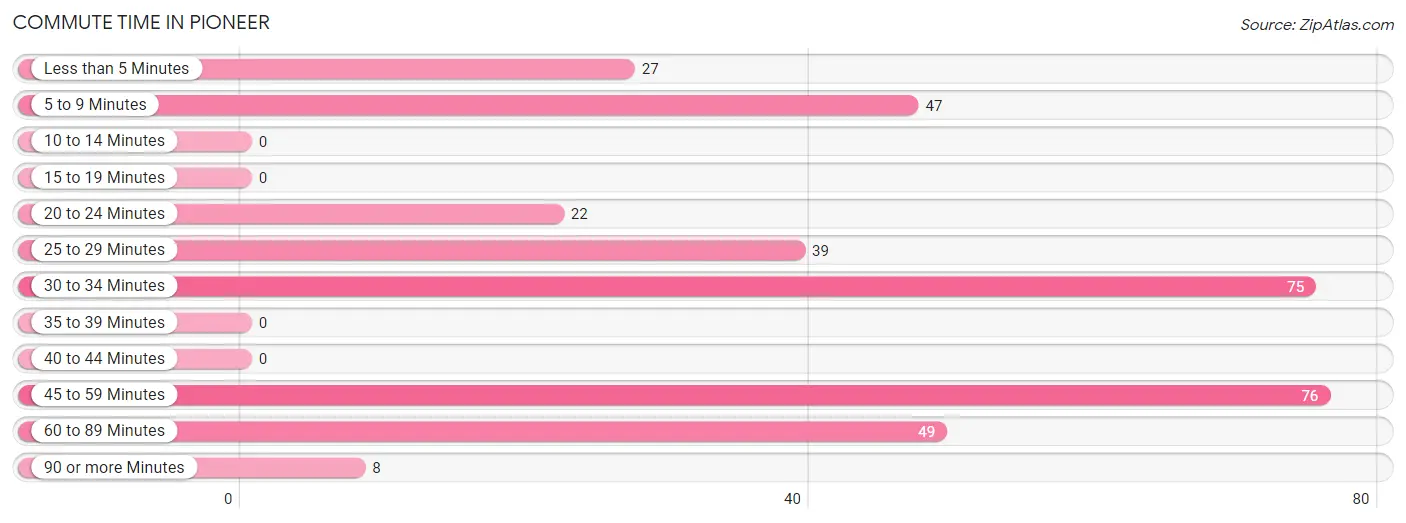
| Commute Time | # Commuters | % Commuters |
| Less than 5 Minutes | 27 | 7.9% |
| 5 to 9 Minutes | 47 | 13.7% |
| 10 to 14 Minutes | 0 | 0.0% |
| 15 to 19 Minutes | 0 | 0.0% |
| 20 to 24 Minutes | 22 | 6.4% |
| 25 to 29 Minutes | 39 | 11.4% |
| 30 to 34 Minutes | 75 | 21.9% |
| 35 to 39 Minutes | 0 | 0.0% |
| 40 to 44 Minutes | 0 | 0.0% |
| 45 to 59 Minutes | 76 | 22.2% |
| 60 to 89 Minutes | 49 | 14.3% |
| 90 or more Minutes | 8 | 2.3% |
Commute Time by Sex in Pioneer
The most common commute times in Pioneer are 45 to 59 minutes (76 commuters, 33.5%) for males and 25 to 29 minutes (39 commuters, 33.6%) for females.
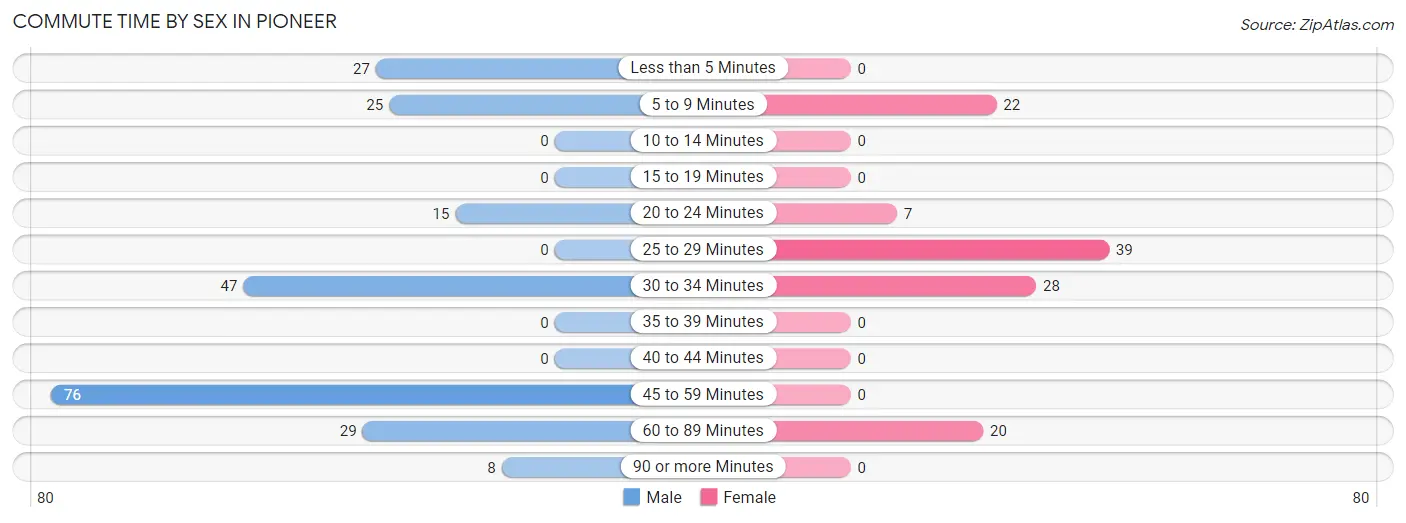
| Commute Time | Male | Female |
| Less than 5 Minutes | 27 (11.9%) | 0 (0.0%) |
| 5 to 9 Minutes | 25 (11.0%) | 22 (19.0%) |
| 10 to 14 Minutes | 0 (0.0%) | 0 (0.0%) |
| 15 to 19 Minutes | 0 (0.0%) | 0 (0.0%) |
| 20 to 24 Minutes | 15 (6.6%) | 7 (6.0%) |
| 25 to 29 Minutes | 0 (0.0%) | 39 (33.6%) |
| 30 to 34 Minutes | 47 (20.7%) | 28 (24.1%) |
| 35 to 39 Minutes | 0 (0.0%) | 0 (0.0%) |
| 40 to 44 Minutes | 0 (0.0%) | 0 (0.0%) |
| 45 to 59 Minutes | 76 (33.5%) | 0 (0.0%) |
| 60 to 89 Minutes | 29 (12.8%) | 20 (17.2%) |
| 90 or more Minutes | 8 (3.5%) | 0 (0.0%) |
Time of Departure to Work by Sex in Pioneer
The most frequent times of departure to work in Pioneer are 5:30 AM to 5:59 AM (81, 35.7%) for males and 7:00 AM to 7:29 AM (39, 33.6%) for females.
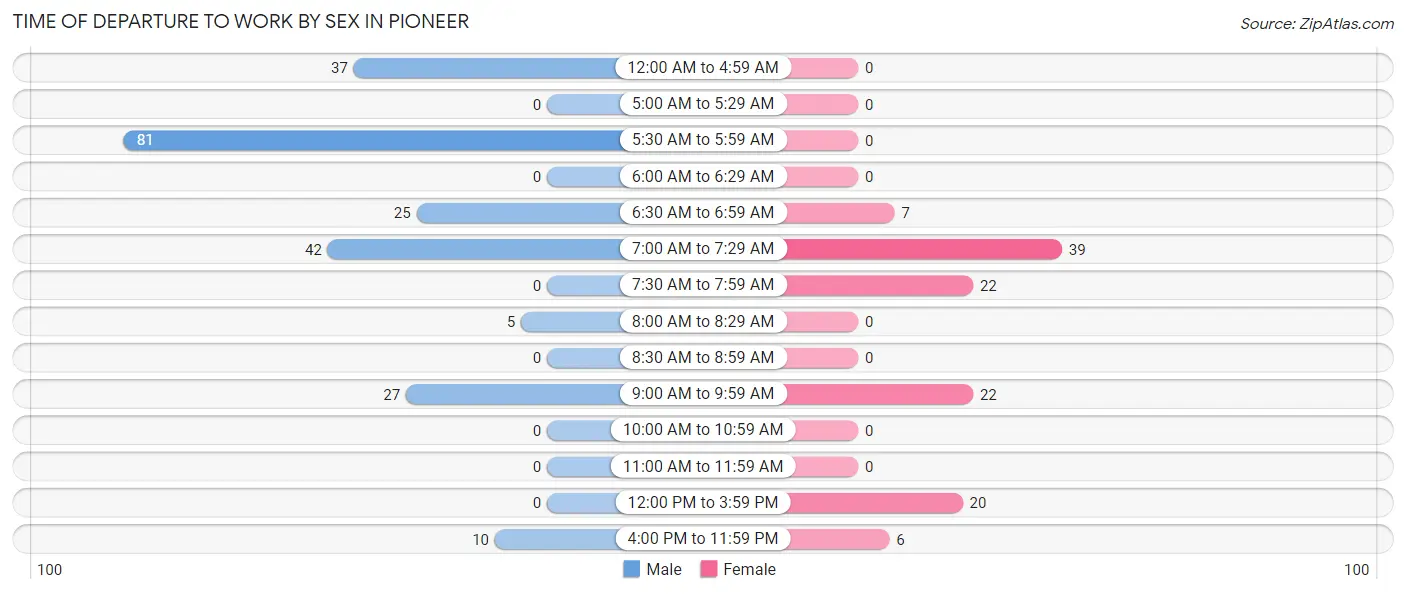
| Time of Departure | Male | Female |
| 12:00 AM to 4:59 AM | 37 (16.3%) | 0 (0.0%) |
| 5:00 AM to 5:29 AM | 0 (0.0%) | 0 (0.0%) |
| 5:30 AM to 5:59 AM | 81 (35.7%) | 0 (0.0%) |
| 6:00 AM to 6:29 AM | 0 (0.0%) | 0 (0.0%) |
| 6:30 AM to 6:59 AM | 25 (11.0%) | 7 (6.0%) |
| 7:00 AM to 7:29 AM | 42 (18.5%) | 39 (33.6%) |
| 7:30 AM to 7:59 AM | 0 (0.0%) | 22 (19.0%) |
| 8:00 AM to 8:29 AM | 5 (2.2%) | 0 (0.0%) |
| 8:30 AM to 8:59 AM | 0 (0.0%) | 0 (0.0%) |
| 9:00 AM to 9:59 AM | 27 (11.9%) | 22 (19.0%) |
| 10:00 AM to 10:59 AM | 0 (0.0%) | 0 (0.0%) |
| 11:00 AM to 11:59 AM | 0 (0.0%) | 0 (0.0%) |
| 12:00 PM to 3:59 PM | 0 (0.0%) | 20 (17.2%) |
| 4:00 PM to 11:59 PM | 10 (4.4%) | 6 (5.2%) |
| Total | 227 (100.0%) | 116 (100.0%) |
Housing Occupancy in Pioneer
Occupancy by Ownership in Pioneer
Of the total 493 dwellings in Pioneer, owner-occupied units account for 439 (89.0%), while renter-occupied units make up 54 (11.0%).
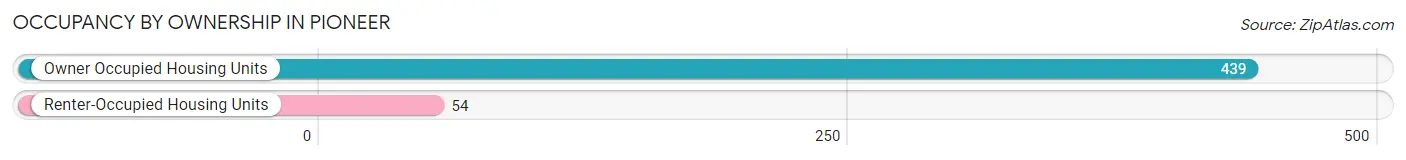
| Occupancy | # Housing Units | % Housing Units |
| Owner Occupied Housing Units | 439 | 89.0% |
| Renter-Occupied Housing Units | 54 | 11.0% |
| Total Occupied Housing Units | 493 | 100.0% |
Occupancy by Household Size in Pioneer
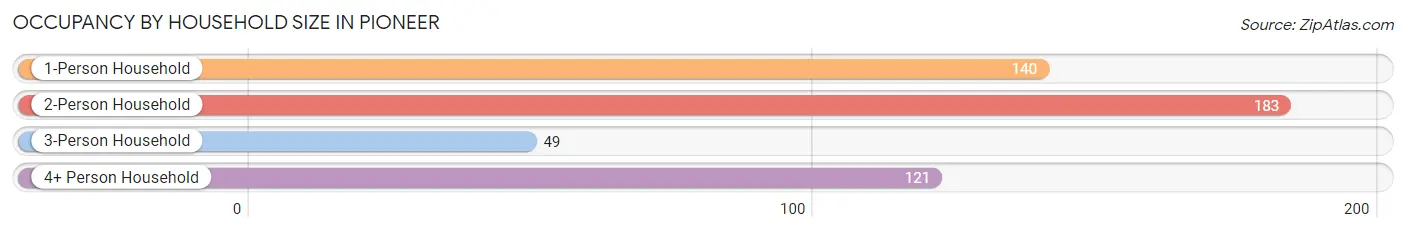
| Household Size | # Housing Units | % Housing Units |
| 1-Person Household | 140 | 28.4% |
| 2-Person Household | 183 | 37.1% |
| 3-Person Household | 49 | 9.9% |
| 4+ Person Household | 121 | 24.5% |
| Total Housing Units | 493 | 100.0% |
Occupancy by Ownership by Household Size in Pioneer
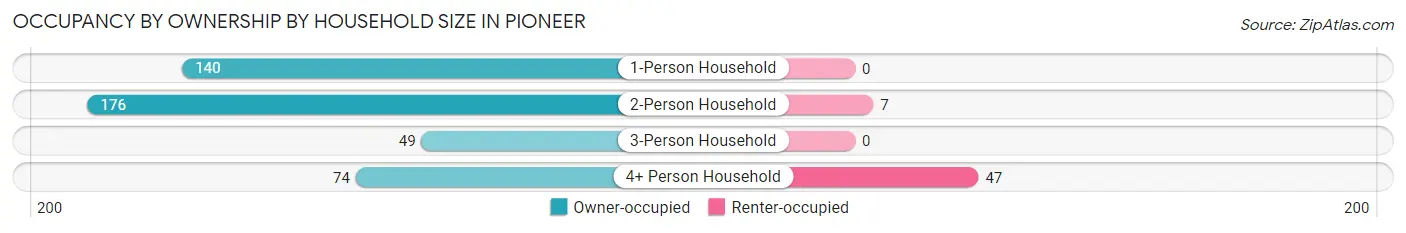
| Household Size | Owner-occupied | Renter-occupied |
| 1-Person Household | 140 (100.0%) | 0 (0.0%) |
| 2-Person Household | 176 (96.2%) | 7 (3.8%) |
| 3-Person Household | 49 (100.0%) | 0 (0.0%) |
| 4+ Person Household | 74 (61.2%) | 47 (38.8%) |
| Total Housing Units | 439 (89.0%) | 54 (11.0%) |
Occupancy by Educational Attainment in Pioneer
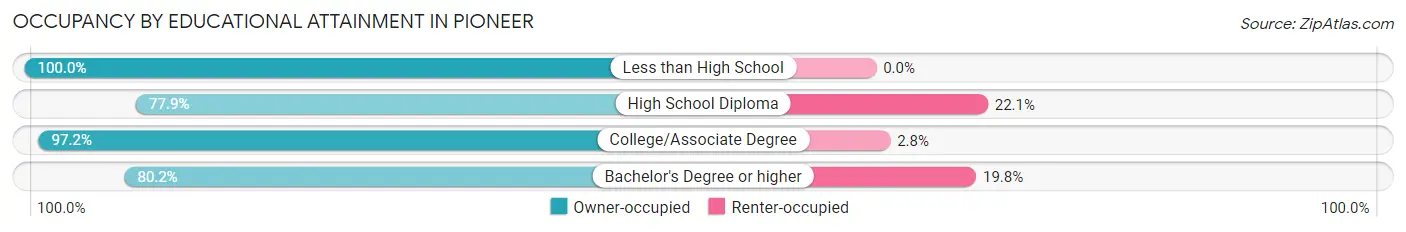
| Household Size | Owner-occupied | Renter-occupied |
| Less than High School | 18 (100.0%) | 0 (0.0%) |
| High School Diploma | 95 (77.9%) | 27 (22.1%) |
| College/Associate Degree | 245 (97.2%) | 7 (2.8%) |
| Bachelor's Degree or higher | 81 (80.2%) | 20 (19.8%) |
Occupancy by Age of Householder in Pioneer
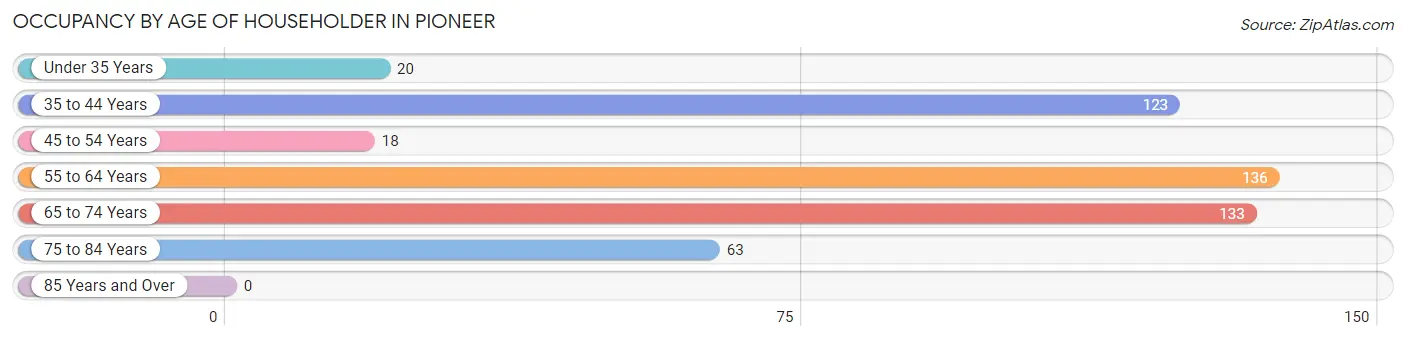
| Age Bracket | # Households | % Households |
| Under 35 Years | 20 | 4.1% |
| 35 to 44 Years | 123 | 24.9% |
| 45 to 54 Years | 18 | 3.6% |
| 55 to 64 Years | 136 | 27.6% |
| 65 to 74 Years | 133 | 27.0% |
| 75 to 84 Years | 63 | 12.8% |
| 85 Years and Over | 0 | 0.0% |
| Total | 493 | 100.0% |
Housing Finances in Pioneer
Median Income by Occupancy in Pioneer
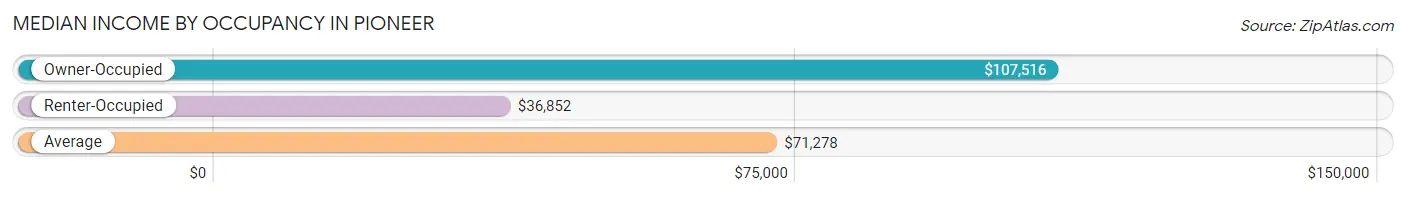
| Occupancy Type | # Households | Median Income |
| Owner-Occupied | 439 (89.0%) | $107,516 |
| Renter-Occupied | 54 (11.0%) | $36,852 |
| Average | 493 (100.0%) | $71,278 |
Occupancy by Householder Income Bracket in Pioneer
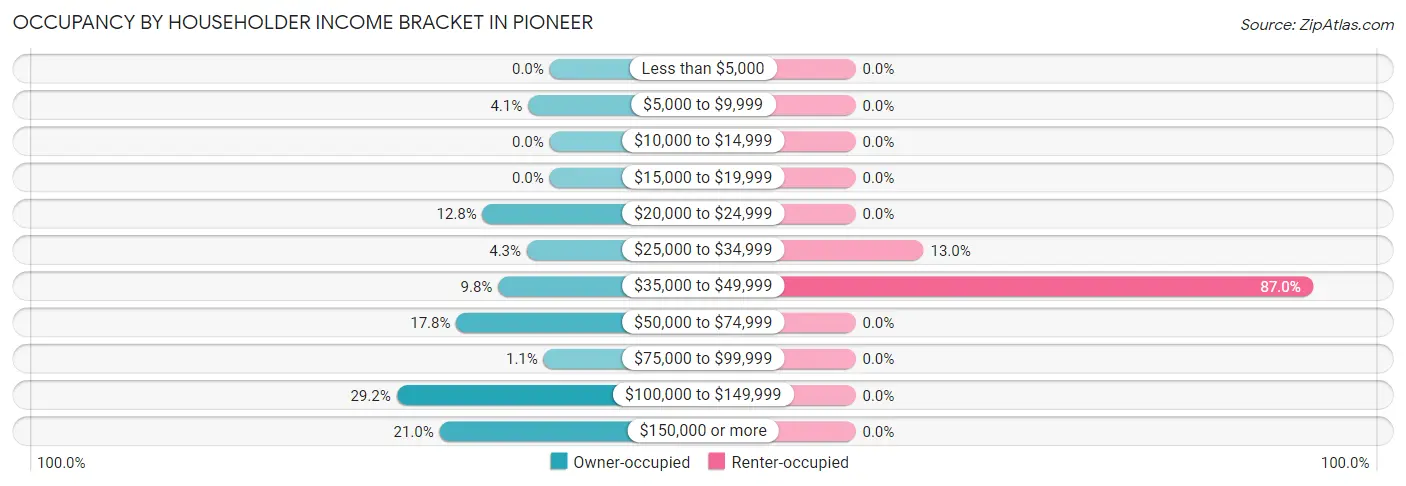
| Income Bracket | Owner-occupied | Renter-occupied |
| Less than $5,000 | 0 (0.0%) | 0 (0.0%) |
| $5,000 to $9,999 | 18 (4.1%) | 0 (0.0%) |
| $10,000 to $14,999 | 0 (0.0%) | 0 (0.0%) |
| $15,000 to $19,999 | 0 (0.0%) | 0 (0.0%) |
| $20,000 to $24,999 | 56 (12.8%) | 0 (0.0%) |
| $25,000 to $34,999 | 19 (4.3%) | 7 (13.0%) |
| $35,000 to $49,999 | 43 (9.8%) | 47 (87.0%) |
| $50,000 to $74,999 | 78 (17.8%) | 0 (0.0%) |
| $75,000 to $99,999 | 5 (1.1%) | 0 (0.0%) |
| $100,000 to $149,999 | 128 (29.2%) | 0 (0.0%) |
| $150,000 or more | 92 (21.0%) | 0 (0.0%) |
| Total | 439 (100.0%) | 54 (100.0%) |
Monthly Housing Cost Tiers in Pioneer
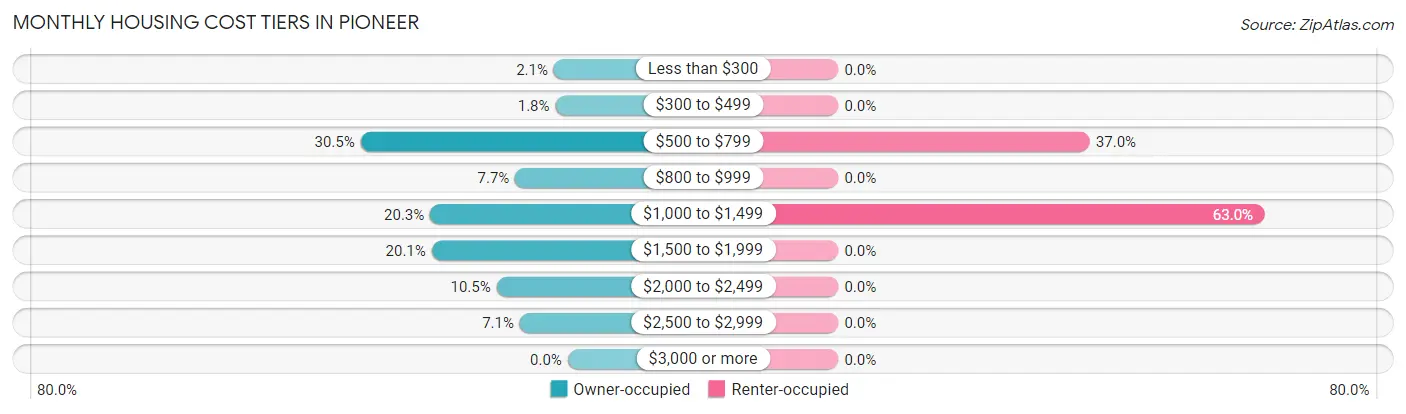
| Monthly Cost | Owner-occupied | Renter-occupied |
| Less than $300 | 9 (2.1%) | 0 (0.0%) |
| $300 to $499 | 8 (1.8%) | 0 (0.0%) |
| $500 to $799 | 134 (30.5%) | 20 (37.0%) |
| $800 to $999 | 34 (7.7%) | 0 (0.0%) |
| $1,000 to $1,499 | 89 (20.3%) | 34 (63.0%) |
| $1,500 to $1,999 | 88 (20.1%) | 0 (0.0%) |
| $2,000 to $2,499 | 46 (10.5%) | 0 (0.0%) |
| $2,500 to $2,999 | 31 (7.1%) | 0 (0.0%) |
| $3,000 or more | 0 (0.0%) | 0 (0.0%) |
| Total | 439 (100.0%) | 54 (100.0%) |
Physical Housing Characteristics in Pioneer
Housing Structures in Pioneer
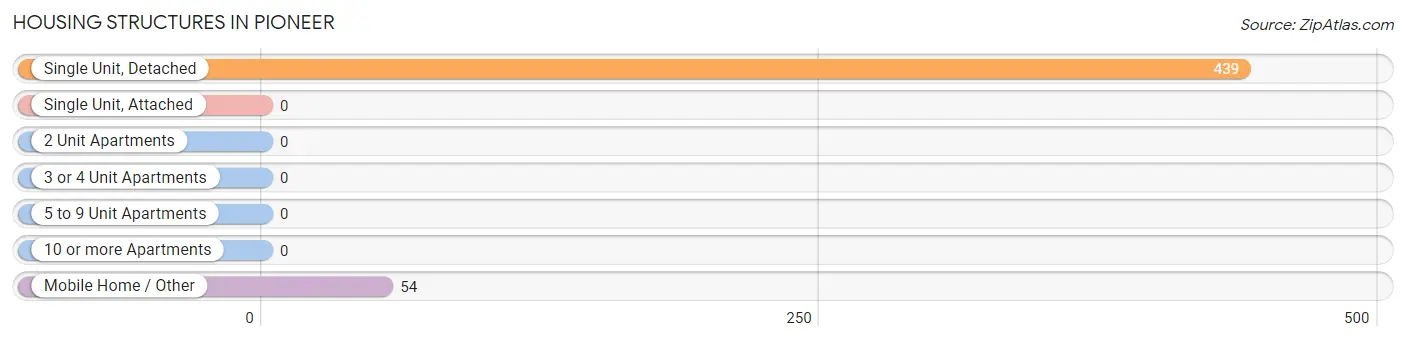
| Structure Type | # Housing Units | % Housing Units |
| Single Unit, Detached | 439 | 89.0% |
| Single Unit, Attached | 0 | 0.0% |
| 2 Unit Apartments | 0 | 0.0% |
| 3 or 4 Unit Apartments | 0 | 0.0% |
| 5 to 9 Unit Apartments | 0 | 0.0% |
| 10 or more Apartments | 0 | 0.0% |
| Mobile Home / Other | 54 | 11.0% |
| Total | 493 | 100.0% |
Housing Structures by Occupancy in Pioneer
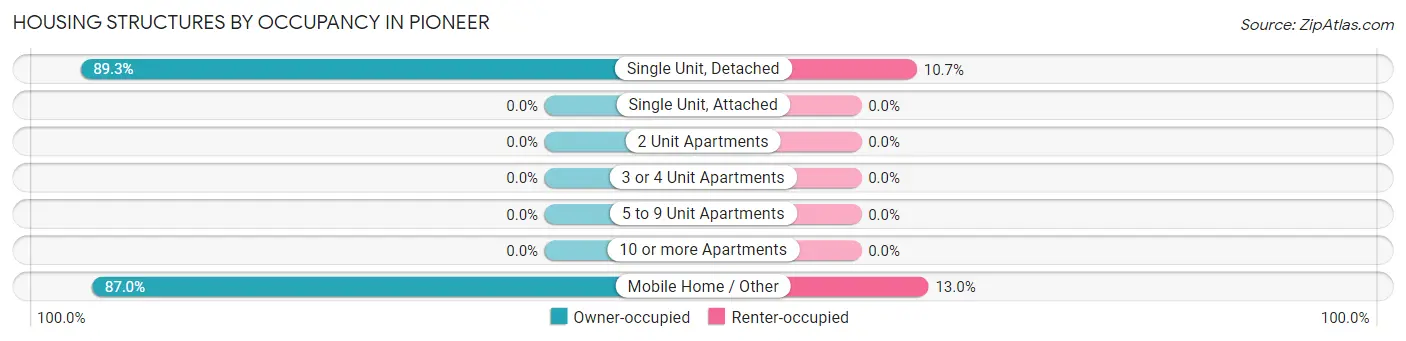
| Structure Type | Owner-occupied | Renter-occupied |
| Single Unit, Detached | 392 (89.3%) | 47 (10.7%) |
| Single Unit, Attached | 0 (0.0%) | 0 (0.0%) |
| 2 Unit Apartments | 0 (0.0%) | 0 (0.0%) |
| 3 or 4 Unit Apartments | 0 (0.0%) | 0 (0.0%) |
| 5 to 9 Unit Apartments | 0 (0.0%) | 0 (0.0%) |
| 10 or more Apartments | 0 (0.0%) | 0 (0.0%) |
| Mobile Home / Other | 47 (87.0%) | 7 (13.0%) |
| Total | 439 (89.0%) | 54 (11.0%) |
Housing Structures by Number of Rooms in Pioneer
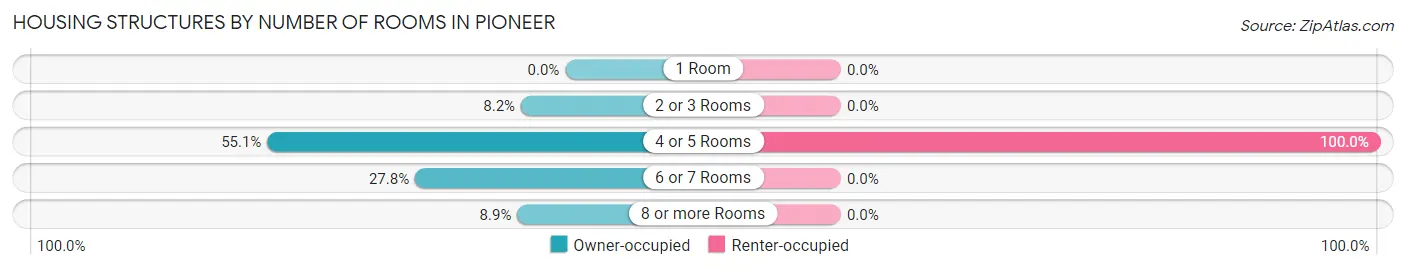
| Number of Rooms | Owner-occupied | Renter-occupied |
| 1 Room | 0 (0.0%) | 0 (0.0%) |
| 2 or 3 Rooms | 36 (8.2%) | 0 (0.0%) |
| 4 or 5 Rooms | 242 (55.1%) | 54 (100.0%) |
| 6 or 7 Rooms | 122 (27.8%) | 0 (0.0%) |
| 8 or more Rooms | 39 (8.9%) | 0 (0.0%) |
| Total | 439 (100.0%) | 54 (100.0%) |
Housing Structure by Heating Type in Pioneer
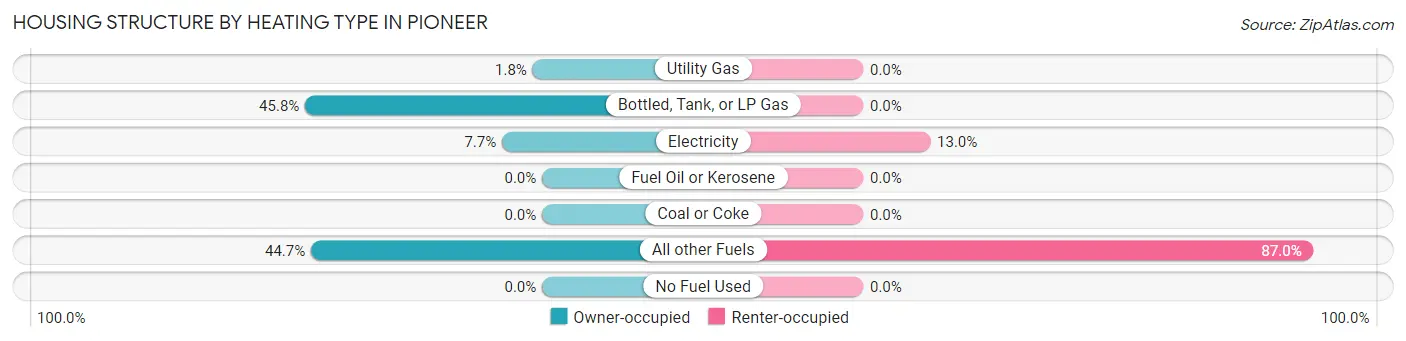
| Heating Type | Owner-occupied | Renter-occupied |
| Utility Gas | 8 (1.8%) | 0 (0.0%) |
| Bottled, Tank, or LP Gas | 201 (45.8%) | 0 (0.0%) |
| Electricity | 34 (7.7%) | 7 (13.0%) |
| Fuel Oil or Kerosene | 0 (0.0%) | 0 (0.0%) |
| Coal or Coke | 0 (0.0%) | 0 (0.0%) |
| All other Fuels | 196 (44.7%) | 47 (87.0%) |
| No Fuel Used | 0 (0.0%) | 0 (0.0%) |
| Total | 439 (100.0%) | 54 (100.0%) |
Household Vehicle Usage in Pioneer
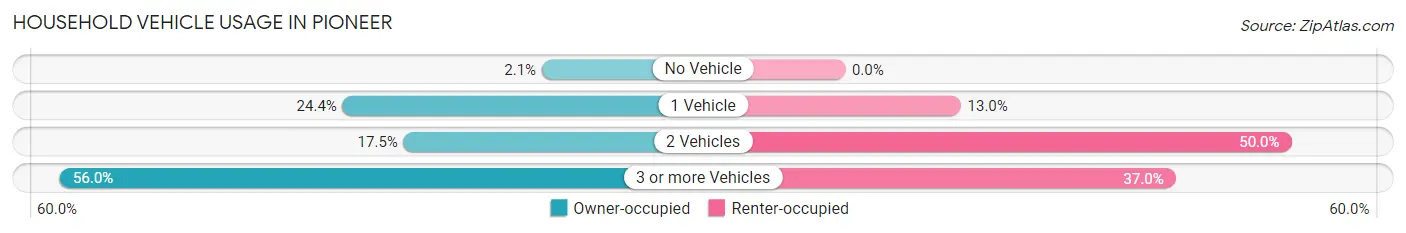
| Vehicles per Household | Owner-occupied | Renter-occupied |
| No Vehicle | 9 (2.1%) | 0 (0.0%) |
| 1 Vehicle | 107 (24.4%) | 7 (13.0%) |
| 2 Vehicles | 77 (17.5%) | 27 (50.0%) |
| 3 or more Vehicles | 246 (56.0%) | 20 (37.0%) |
| Total | 439 (100.0%) | 54 (100.0%) |
Real Estate & Mortgages in Pioneer
Real Estate and Mortgage Overview in Pioneer
| Characteristic | Without Mortgage | With Mortgage |
| Housing Units | 211 | 228 |
| Median Property Value | $418,100 | $279,700 |
| Median Household Income | - | - |
| Monthly Housing Costs | $744 | $0 |
| Real Estate Taxes | $2,389 | $0 |
Property Value by Mortgage Status in Pioneer
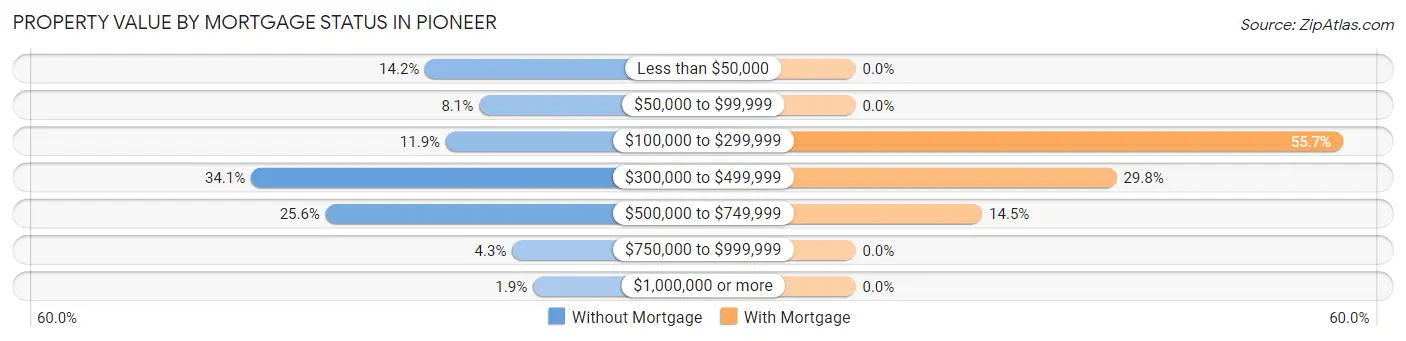
| Property Value | Without Mortgage | With Mortgage |
| Less than $50,000 | 30 (14.2%) | 0 (0.0%) |
| $50,000 to $99,999 | 17 (8.1%) | 0 (0.0%) |
| $100,000 to $299,999 | 25 (11.8%) | 127 (55.7%) |
| $300,000 to $499,999 | 72 (34.1%) | 68 (29.8%) |
| $500,000 to $749,999 | 54 (25.6%) | 33 (14.5%) |
| $750,000 to $999,999 | 9 (4.3%) | 0 (0.0%) |
| $1,000,000 or more | 4 (1.9%) | 0 (0.0%) |
| Total | 211 (100.0%) | 228 (100.0%) |
Household Income by Mortgage Status in Pioneer
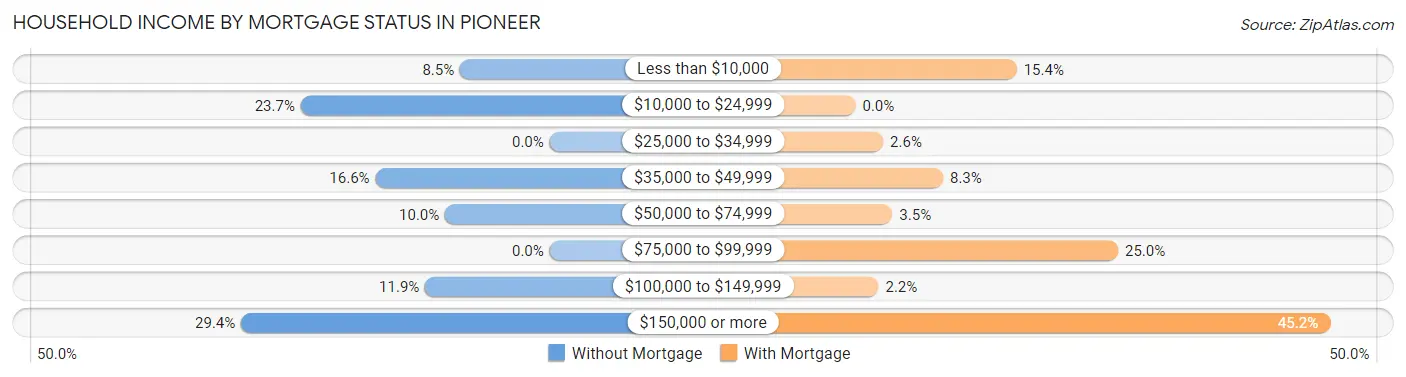
| Household Income | Without Mortgage | With Mortgage |
| Less than $10,000 | 18 (8.5%) | 35 (15.3%) |
| $10,000 to $24,999 | 50 (23.7%) | 0 (0.0%) |
| $25,000 to $34,999 | 0 (0.0%) | 6 (2.6%) |
| $35,000 to $49,999 | 35 (16.6%) | 19 (8.3%) |
| $50,000 to $74,999 | 21 (10.0%) | 8 (3.5%) |
| $75,000 to $99,999 | 0 (0.0%) | 57 (25.0%) |
| $100,000 to $149,999 | 25 (11.8%) | 5 (2.2%) |
| $150,000 or more | 62 (29.4%) | 103 (45.2%) |
| Total | 211 (100.0%) | 228 (100.0%) |
Property Value to Household Income Ratio in Pioneer
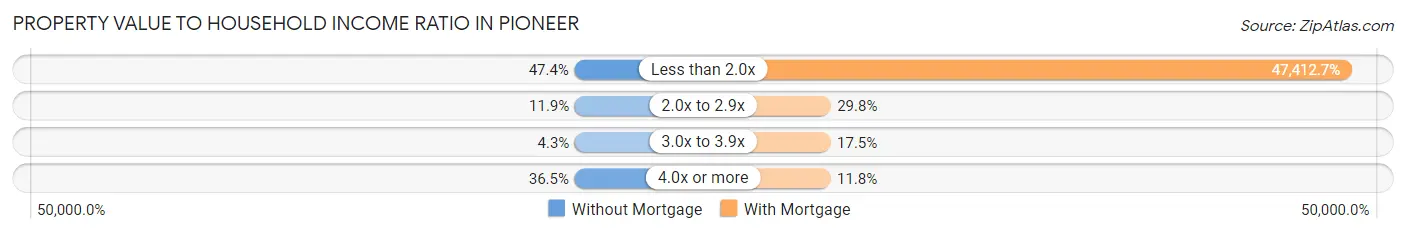
| Value-to-Income Ratio | Without Mortgage | With Mortgage |
| Less than 2.0x | 100 (47.4%) | 108,101 (47,412.7%) |
| 2.0x to 2.9x | 25 (11.8%) | 68 (29.8%) |
| 3.0x to 3.9x | 9 (4.3%) | 40 (17.5%) |
| 4.0x or more | 77 (36.5%) | 27 (11.8%) |
| Total | 211 (100.0%) | 228 (100.0%) |
Real Estate Taxes by Mortgage Status in Pioneer
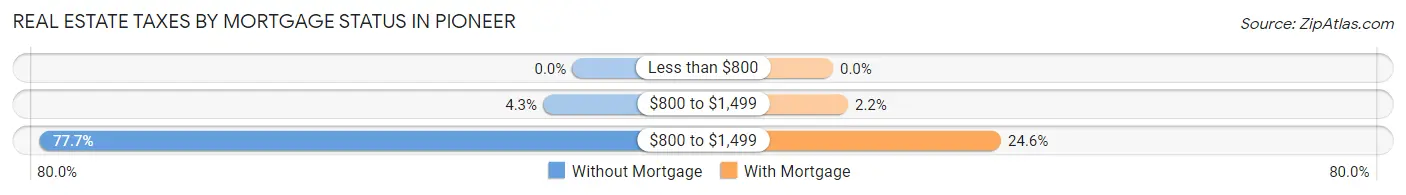
| Property Taxes | Without Mortgage | With Mortgage |
| Less than $800 | 0 (0.0%) | 0 (0.0%) |
| $800 to $1,499 | 9 (4.3%) | 5 (2.2%) |
| $800 to $1,499 | 164 (77.7%) | 56 (24.6%) |
| Total | 211 (100.0%) | 228 (100.0%) |
Health & Disability in Pioneer
Health Insurance Coverage by Age in Pioneer
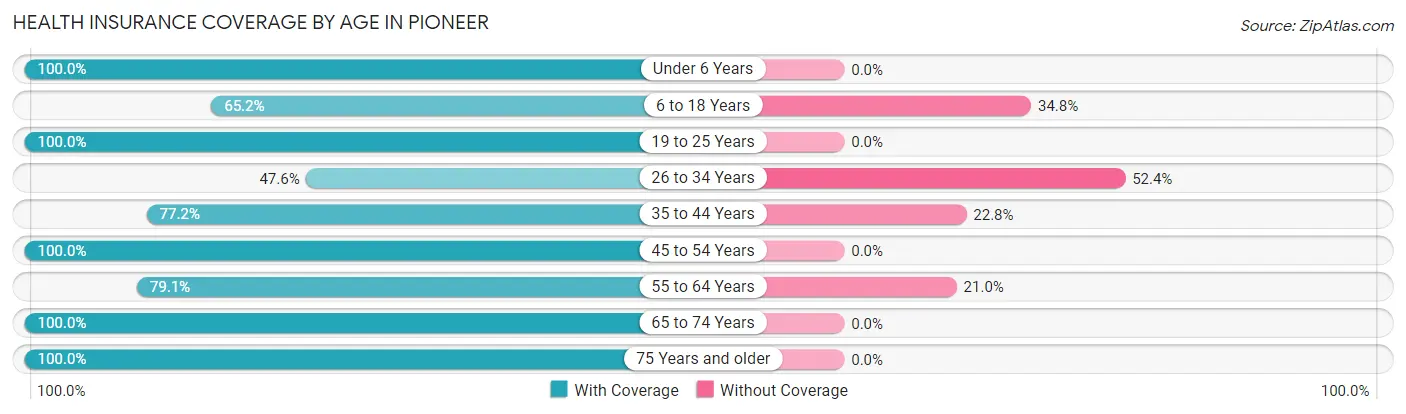
| Age Bracket | With Coverage | Without Coverage |
| Under 6 Years | 104 (100.0%) | 0 (0.0%) |
| 6 to 18 Years | 73 (65.2%) | 39 (34.8%) |
| 19 to 25 Years | 69 (100.0%) | 0 (0.0%) |
| 26 to 34 Years | 20 (47.6%) | 22 (52.4%) |
| 35 to 44 Years | 207 (77.2%) | 61 (22.8%) |
| 45 to 54 Years | 25 (100.0%) | 0 (0.0%) |
| 55 to 64 Years | 234 (79.0%) | 62 (20.9%) |
| 65 to 74 Years | 343 (100.0%) | 0 (0.0%) |
| 75 Years and older | 63 (100.0%) | 0 (0.0%) |
| Total | 1,138 (86.1%) | 184 (13.9%) |
Health Insurance Coverage by Citizenship Status in Pioneer
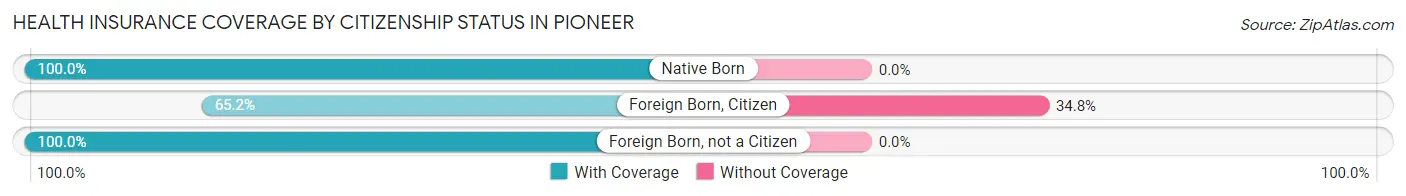
| Citizenship Status | With Coverage | Without Coverage |
| Native Born | 104 (100.0%) | 0 (0.0%) |
| Foreign Born, Citizen | 73 (65.2%) | 39 (34.8%) |
| Foreign Born, not a Citizen | 69 (100.0%) | 0 (0.0%) |
Health Insurance Coverage by Household Income in Pioneer
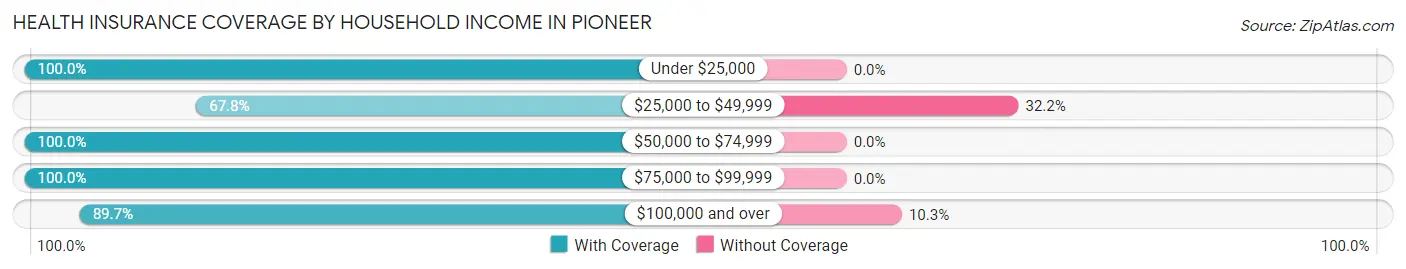
| Household Income | With Coverage | Without Coverage |
| Under $25,000 | 101 (100.0%) | 0 (0.0%) |
| $25,000 to $49,999 | 274 (67.8%) | 130 (32.2%) |
| $50,000 to $74,999 | 286 (100.0%) | 0 (0.0%) |
| $75,000 to $99,999 | 9 (100.0%) | 0 (0.0%) |
| $100,000 and over | 468 (89.7%) | 54 (10.3%) |
Public vs Private Health Insurance Coverage by Age in Pioneer
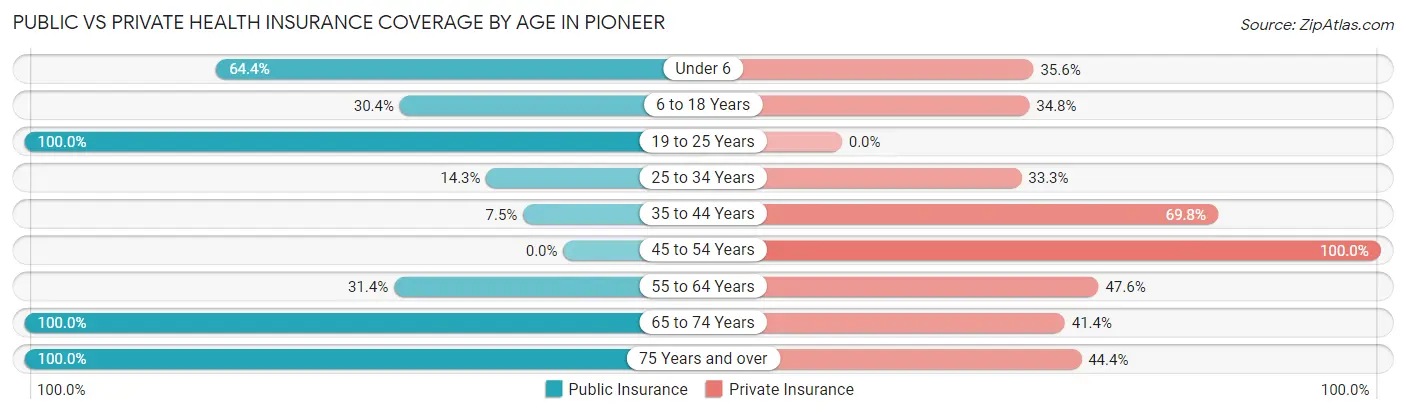
| Age Bracket | Public Insurance | Private Insurance |
| Under 6 | 67 (64.4%) | 37 (35.6%) |
| 6 to 18 Years | 34 (30.4%) | 39 (34.8%) |
| 19 to 25 Years | 69 (100.0%) | 0 (0.0%) |
| 25 to 34 Years | 6 (14.3%) | 14 (33.3%) |
| 35 to 44 Years | 20 (7.5%) | 187 (69.8%) |
| 45 to 54 Years | 0 (0.0%) | 25 (100.0%) |
| 55 to 64 Years | 93 (31.4%) | 141 (47.6%) |
| 65 to 74 Years | 343 (100.0%) | 142 (41.4%) |
| 75 Years and over | 63 (100.0%) | 28 (44.4%) |
| Total | 695 (52.6%) | 613 (46.4%) |
Disability Status by Sex by Age in Pioneer
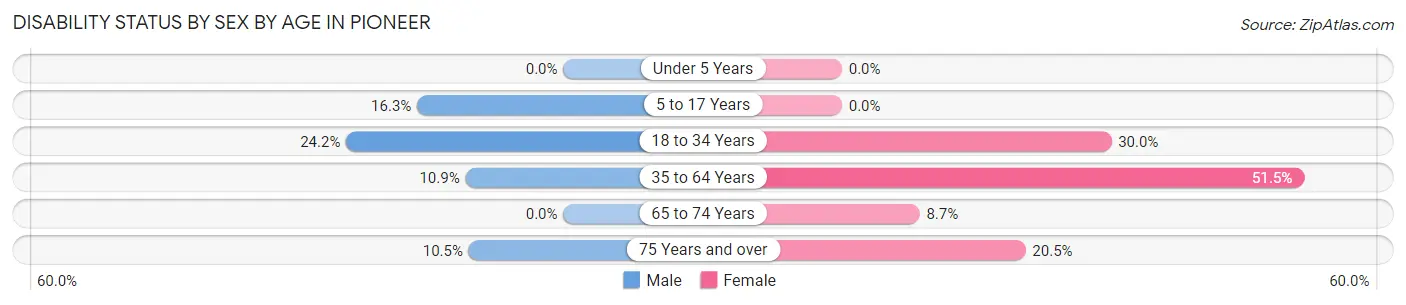
| Age Bracket | Male | Female |
| Under 5 Years | 0 (0.0%) | 0 (0.0%) |
| 5 to 17 Years | 21 (16.3%) | 0 (0.0%) |
| 18 to 34 Years | 22 (24.2%) | 6 (30.0%) |
| 35 to 64 Years | 35 (10.9%) | 138 (51.5%) |
| 65 to 74 Years | 0 (0.0%) | 16 (8.6%) |
| 75 Years and over | 2 (10.5%) | 9 (20.4%) |
Disability Class by Sex by Age in Pioneer
Disability Class: Hearing Difficulty
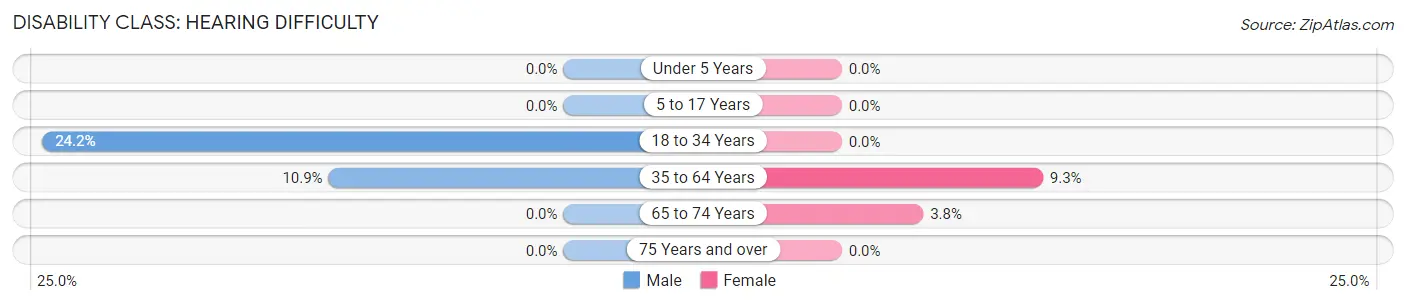
| Age Bracket | Male | Female |
| Under 5 Years | 0 (0.0%) | 0 (0.0%) |
| 5 to 17 Years | 0 (0.0%) | 0 (0.0%) |
| 18 to 34 Years | 22 (24.2%) | 0 (0.0%) |
| 35 to 64 Years | 35 (10.9%) | 25 (9.3%) |
| 65 to 74 Years | 0 (0.0%) | 7 (3.8%) |
| 75 Years and over | 0 (0.0%) | 0 (0.0%) |
Disability Class: Vision Difficulty
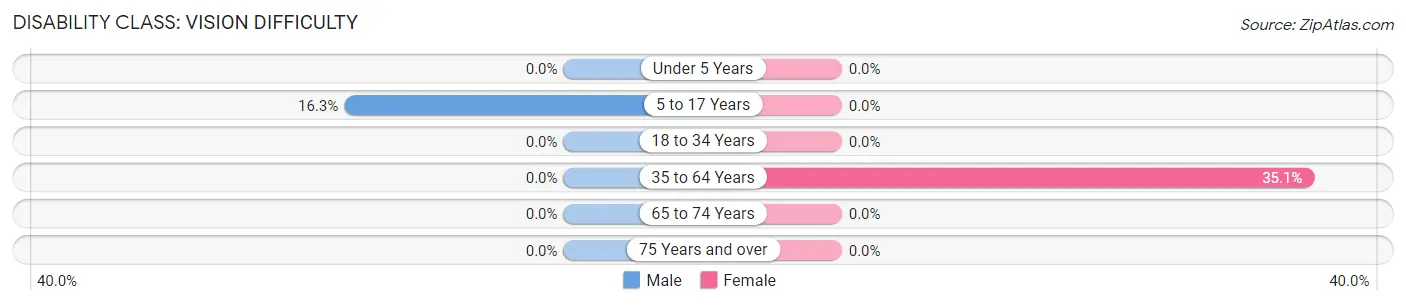
| Age Bracket | Male | Female |
| Under 5 Years | 0 (0.0%) | 0 (0.0%) |
| 5 to 17 Years | 21 (16.3%) | 0 (0.0%) |
| 18 to 34 Years | 0 (0.0%) | 0 (0.0%) |
| 35 to 64 Years | 0 (0.0%) | 94 (35.1%) |
| 65 to 74 Years | 0 (0.0%) | 0 (0.0%) |
| 75 Years and over | 0 (0.0%) | 0 (0.0%) |
Disability Class: Cognitive Difficulty
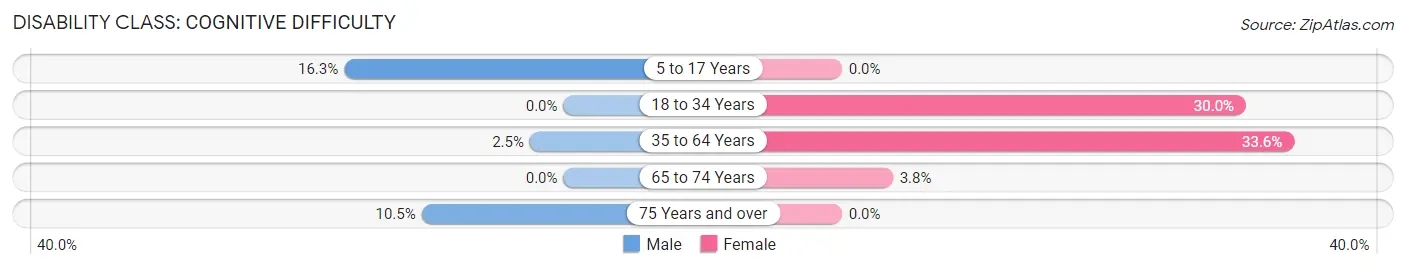
| Age Bracket | Male | Female |
| 5 to 17 Years | 21 (16.3%) | 0 (0.0%) |
| 18 to 34 Years | 0 (0.0%) | 6 (30.0%) |
| 35 to 64 Years | 8 (2.5%) | 90 (33.6%) |
| 65 to 74 Years | 0 (0.0%) | 7 (3.8%) |
| 75 Years and over | 2 (10.5%) | 0 (0.0%) |
Disability Class: Ambulatory Difficulty
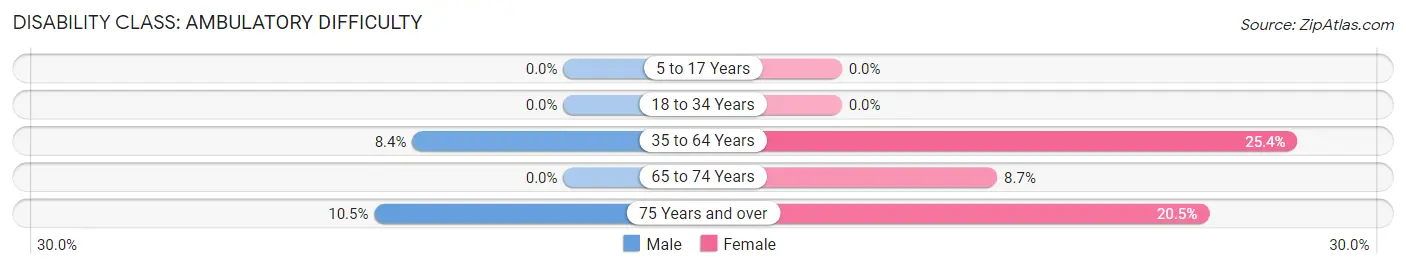
| Age Bracket | Male | Female |
| 5 to 17 Years | 0 (0.0%) | 0 (0.0%) |
| 18 to 34 Years | 0 (0.0%) | 0 (0.0%) |
| 35 to 64 Years | 27 (8.4%) | 68 (25.4%) |
| 65 to 74 Years | 0 (0.0%) | 16 (8.6%) |
| 75 Years and over | 2 (10.5%) | 9 (20.4%) |
Disability Class: Self-Care Difficulty
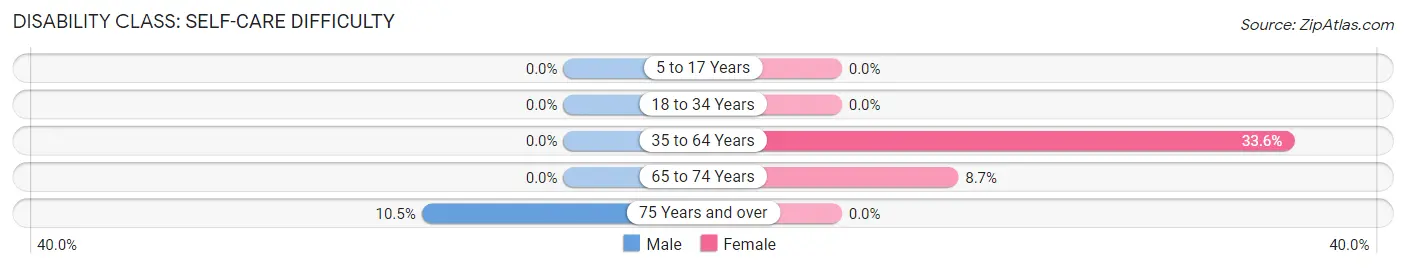
| Age Bracket | Male | Female |
| 5 to 17 Years | 0 (0.0%) | 0 (0.0%) |
| 18 to 34 Years | 0 (0.0%) | 0 (0.0%) |
| 35 to 64 Years | 0 (0.0%) | 90 (33.6%) |
| 65 to 74 Years | 0 (0.0%) | 16 (8.6%) |
| 75 Years and over | 2 (10.5%) | 0 (0.0%) |
Technology Access in Pioneer
Computing Device Access in Pioneer
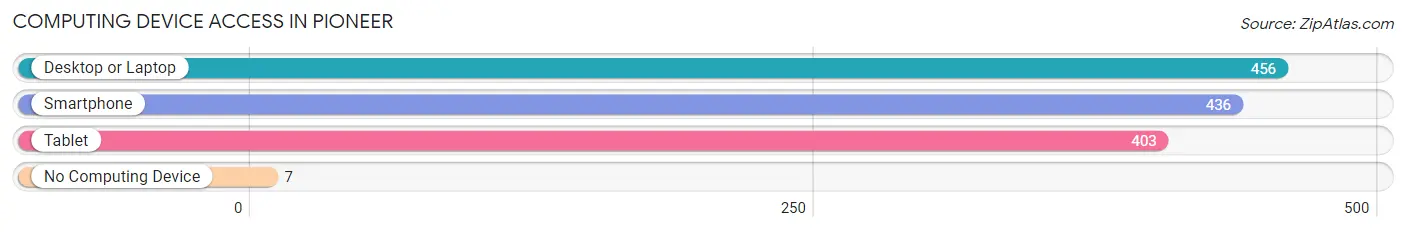
| Device Type | # Households | % Households |
| Desktop or Laptop | 456 | 92.5% |
| Smartphone | 436 | 88.4% |
| Tablet | 403 | 81.7% |
| No Computing Device | 7 | 1.4% |
| Total | 493 | 100.0% |
Internet Access in Pioneer
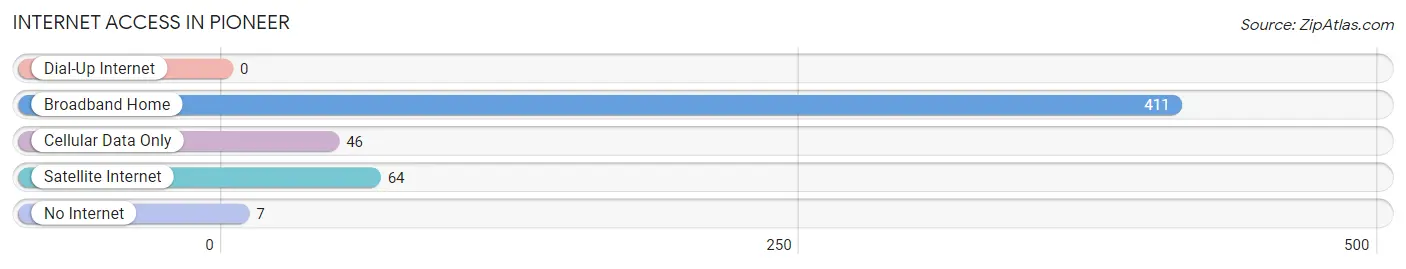
| Internet Type | # Households | % Households |
| Dial-Up Internet | 0 | 0.0% |
| Broadband Home | 411 | 83.4% |
| Cellular Data Only | 46 | 9.3% |
| Satellite Internet | 64 | 13.0% |
| No Internet | 7 | 1.4% |
| Total | 493 | 100.0% |
Pioneer Summary
Pioneer is a small unincorporated community located in Amador County, California. It is situated in the Sierra Nevada foothills, approximately 40 miles east of Sacramento and 80 miles northeast of San Francisco. The town is located in the heart of the Gold Country, and is home to a population of approximately 1,000 people.
History
Pioneer was founded in 1849 during the California Gold Rush. The town was originally known as “Pioneer Station” and was a stop on the stagecoach line between Sacramento and Placerville. The town was officially incorporated in 1854 and was named after the first settler in the area, John C. Pioneer.
In the late 1800s, Pioneer was a bustling mining town with a population of over 1,000 people. The town was home to several saloons, hotels, and stores. The town also had a post office, a school, and a newspaper.
In the early 1900s, the population of Pioneer began to decline as the gold rush ended and the town’s economy shifted to agriculture. The town’s population dropped to just over 500 people by the 1950s.
Geography
Pioneer is located in the Sierra Nevada foothills, approximately 40 miles east of Sacramento and 80 miles northeast of San Francisco. The town is situated at an elevation of 1,400 feet and is surrounded by rolling hills and oak-studded meadows.
The town is located in the heart of the Gold Country and is home to several historic sites, including the Pioneer Cemetery, the Pioneer Museum, and the Pioneer Hotel.
Economy
Pioneer’s economy is largely based on agriculture and tourism. The town is home to several wineries, including the Amador County Winery and the Pioneer Winery. The town is also home to several restaurants, shops, and galleries.
The town is also home to several small businesses, including a hardware store, a grocery store, and a gas station.
Demographics
As of the 2010 census, the population of Pioneer was 1,037. The racial makeup of the town was 94.3% White, 0.7% African American, 0.7% Native American, 0.7% Asian, 0.2% Pacific Islander, 1.2% from other races, and 2.1% from two or more races. Hispanic or Latino of any race were 4.2% of the population.
The median household income in Pioneer was $45,000, and the median family income was $50,000. The per capita income for the town was $20,000. About 10.3% of families and 13.2% of the population were below the poverty line, including 16.7% of those under age 18 and 8.3% of those age 65 or over.
Common Questions
What is Per Capita Income in Pioneer?
Per Capita income in Pioneer is $45,660.
What is the Median Family Income in Pioneer?
Median Family Income in Pioneer is $71,393.
What is the Median Household income in Pioneer?
Median Household Income in Pioneer is $71,278.
What is Inequality or Gini Index in Pioneer?
Inequality or Gini Index in Pioneer is 0.46.
What is the Total Population of Pioneer?
Total Population of Pioneer is 1,322.
What is the Total Male Population of Pioneer?
Total Male Population of Pioneer is 718.
What is the Total Female Population of Pioneer?
Total Female Population of Pioneer is 604.
What is the Ratio of Males per 100 Females in Pioneer?
There are 118.87 Males per 100 Females in Pioneer.
What is the Ratio of Females per 100 Males in Pioneer?
There are 84.12 Females per 100 Males in Pioneer.
What is the Median Population Age in Pioneer?
Median Population Age in Pioneer is 58.8 Years.
What is the Average Family Size in Pioneer
Average Family Size in Pioneer is 3.3 People.
What is the Average Household Size in Pioneer
Average Household Size in Pioneer is 2.7 People.
How Large is the Labor Force in Pioneer?
There are 589 People in the Labor Forcein in Pioneer.
What is the Percentage of People in the Labor Force in Pioneer?
53.3% of People are in the Labor Force in Pioneer.
What is the Unemployment Rate in Pioneer?
Unemployment Rate in Pioneer is 6.3%.