Zip Codes with the Highest Percentage of Population Employed in Computer & Mathematics in Porterville, CA

RELATED REPORTS & OPTIONS

Computer & Mathematics
Population
Families and Households
Race (Community Size)
Race (Percentage)
Ancestry (Community Size)
Ancestry (Percentage)
Immigrant Origin (Total)
Immigrant Origin (Percentage)
Income
Income (Families)
Income (Households)
Poverty
Poverty (Families)
Unemployment
Employment Occupations
Employment Industries
Employer Class
Commute Time
Commute Means
School Enrollment
Education by Degree Field
Occupancy
Finances
Physical Characteristics
Porterville
States
California Cities
AlamedaAlhambraAnaheimAntiochApple ValleyArcadiaAuburnBakersfieldBerkeleyBeverly HillsBreaBuena ParkBurbankCamarilloCanoga ParkCanyon CountryCarlsbadCarsonCastro ValleyChicoChinoChula VistaCitrus HeightsClovisComptonConcordCoronaCosta MesaCovinaCulver CityDaly CityDanvilleDavisDesert Hot SpringsDowneyDuarteEl CajonEl MonteElk GroveEncinoEscondidoEurekaFairfieldFontanaFremontFresnoFullertonGarden GroveGardenaGlendaleGlendoraGrass ValleyHaywardHemetHesperiaHuntington BeachIndioInglewoodIrvineLa JollaLa MesaLa MiradaLa PuenteLake ElsinoreLakewoodLancasterLivermoreLodiLompocLong BeachLos AltosLos AngelesLos GatosMaderaMalibuMantecaMenifeeMercedMission ViejoModestoMonterey ParkMoragaMoreno ValleyMountain ViewMurrietaNapaNewport BeachNorth HollywoodNorthridgeNovatoOaklandOceansideOntarioOrangeOrovilleOxnardPalm DesertPalm SpringsPalmdalePalo AltoPasadenaPerrisPetalumaPleasantonPomonaPortervilleRancho CordovaRancho CucamongaReddingRedlandsRedondo BeachRedwood CityRialtoRichmondRiversideRocklinRosevilleSacramentoSalinasSan BernardinoSan ClementeSan DiegoSan FranciscoSan GabrielSan JacintoSan JoseSan LeandroSan Luis ObispoSan MarcosSan MateoSan PedroSan RafaelSan RamonSanta AnaSanta BarbaraSanta ClaraSanta ClaritaSanta CruzSanta MariaSanta MonicaSanta RosaSherman OaksSimi ValleySpring ValleyStocktonSunnyvaleTemeculaThousand OaksTorranceTrabuco CanyonTracyTurlockTustinUplandVacavilleValenciaVallejoVan NuysVenturaVictorvilleVisaliaVistaWalnut CreekWest CovinaWest SacramentoWhittierWoodlandWoodland HillsYorba LindaYuba City
Compare Zip Codes
Comparison Subject

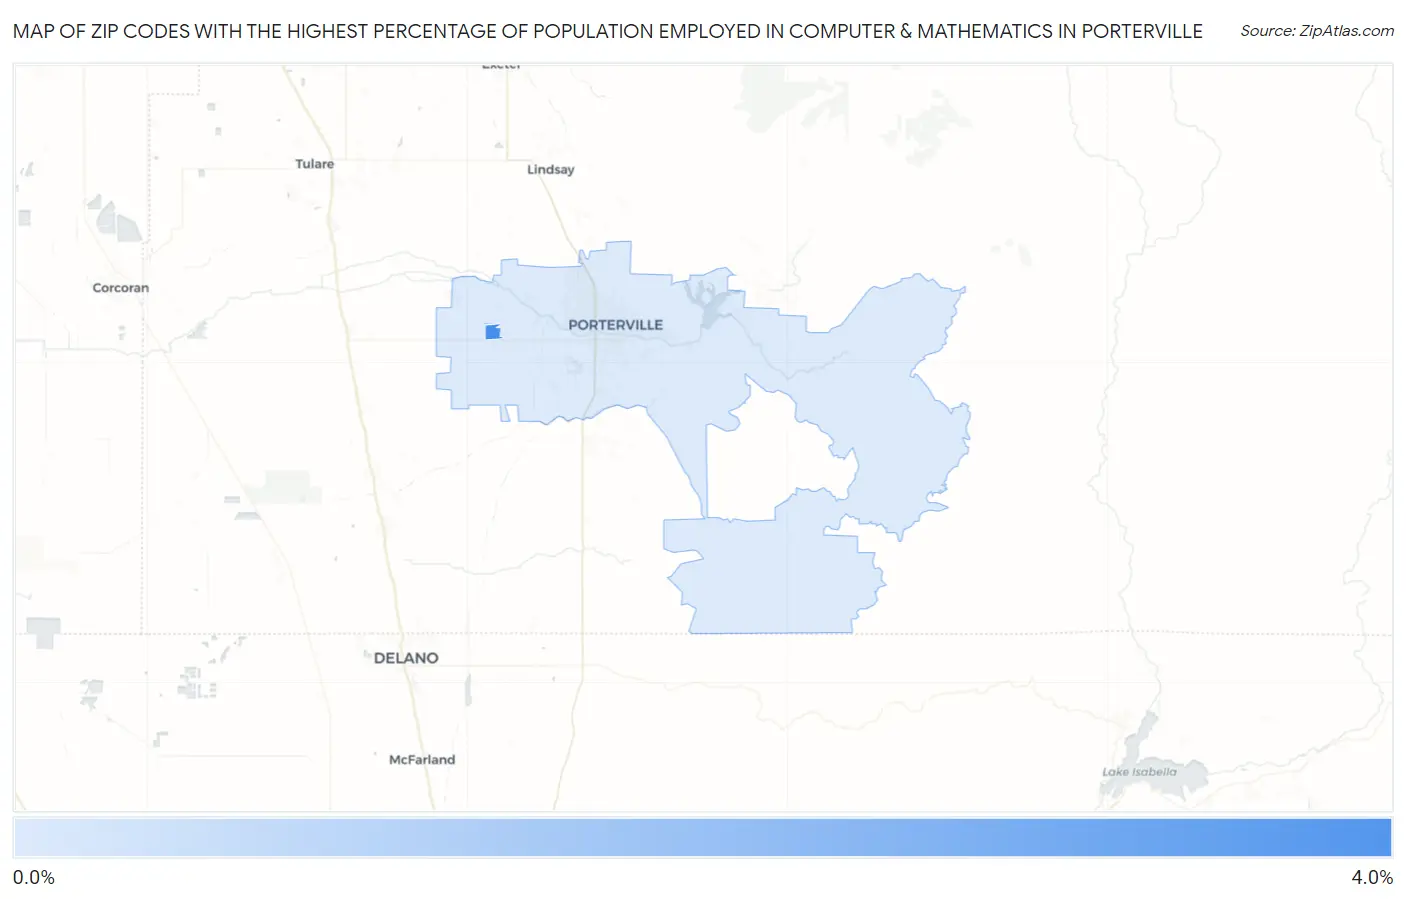
Map of Zip Codes with the Highest Percentage of Population Employed in Computer & Mathematics in Porterville

0.0%
4.0%
Zip Codes with the Highest Percentage of Population Employed in Computer & Mathematics in Porterville Map

Zip Codes with the Highest Percentage of Population Employed in Computer & Mathematics in Porterville, CA

Zip Code % Employed vs State vs National
1.932583.1%4.1%(-0.963)#5983.5%(-0.386)#7,296
2.932570.54%4.1%(-3.57)#1,2603.5%(-2.99)#20,267

Common Questions

What are the Top Zip Codes with the Highest Percentage of Population Employed in Computer & Mathematics in Porterville, CA?
Top Zip Codes with the Highest Percentage of Population Employed in Computer & Mathematics in Porterville, CA are:
#1
3.1%
#2
0.54%
What zip code has the Highest Percentage of Population Employed in Computer & Mathematics in Porterville, CA?
93258 has the Highest Percentage of Population Employed in Computer & Mathematics in Porterville, CA with 3.1%.
What is the Percentage of Population Employed in Computer & Mathematics in Porterville, CA?
Percentage of Population Employed in Computer & Mathematics in Porterville is 0.53%.
What is the Percentage of Population Employed in Computer & Mathematics in California?
Percentage of Population Employed in Computer & Mathematics in California is 4.1%.
What is the Percentage of Population Employed in Computer & Mathematics in the United States?
Percentage of Population Employed in Computer & Mathematics in the United States is 3.5%.