Cities with the Highest Percentage of Population Employed in Computer & Mathematics in Hawaii
RELATED REPORTS & OPTIONS
Computer & Mathematics
Hawaii
Compare Cities
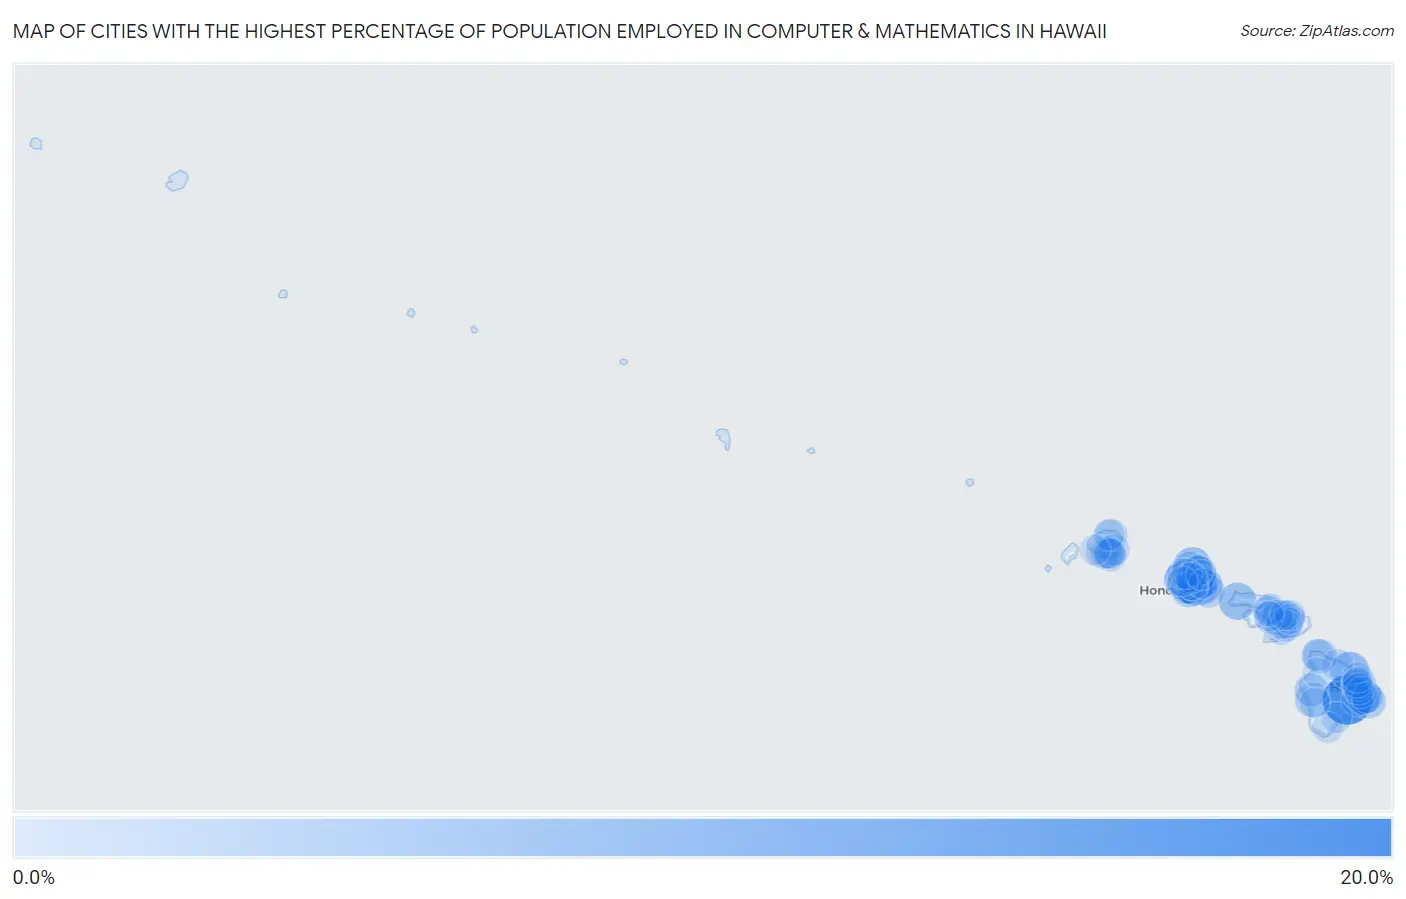
Map of Cities with the Highest Percentage of Population Employed in Computer & Mathematics in Hawaii
0.0%
20.0%
Cities with the Highest Percentage of Population Employed in Computer & Mathematics in Hawaii
| City | % Employed | vs State | vs National | |
| 1. | Volcano | 19.0% | 2.3%(+16.7)#1 | 3.5%(+15.5)#189 |
| 2. | Volcano Golf Course | 11.6% | 2.3%(+9.29)#2 | 3.5%(+8.08)#531 |
| 3. | Laupahoehoe | 8.5% | 2.3%(+6.23)#3 | 3.5%(+5.02)#1,048 |
| 4. | Kawela Bay | 8.0% | 2.3%(+5.64)#4 | 3.5%(+4.43)#1,242 |
| 5. | Orchidlands Estates | 7.6% | 2.3%(+5.25)#5 | 3.5%(+4.04)#1,384 |
| 6. | Helemano | 7.3% | 2.3%(+5.03)#6 | 3.5%(+3.82)#1,457 |
| 7. | Maunaloa | 7.3% | 2.3%(+4.95)#7 | 3.5%(+3.73)#1,490 |
| 8. | Waikoloa Beach Resort | 6.4% | 2.3%(+4.05)#8 | 3.5%(+2.84)#1,930 |
| 9. | Punaluu | 6.2% | 2.3%(+3.85)#9 | 3.5%(+2.64)#2,060 |
| 10. | Makaha Valley | 5.6% | 2.3%(+3.24)#10 | 3.5%(+2.03)#2,530 |
| 11. | Waimalu | 5.1% | 2.3%(+2.78)#11 | 3.5%(+1.57)#2,976 |
| 12. | Kalaeloa | 5.0% | 2.3%(+2.68)#12 | 3.5%(+1.47)#3,104 |
| 13. | Hickam Housing | 4.8% | 2.3%(+2.54)#13 | 3.5%(+1.33)#3,265 |
| 14. | Captain Cook | 4.8% | 2.3%(+2.49)#14 | 3.5%(+1.28)#3,325 |
| 15. | Paukaa | 4.7% | 2.3%(+2.43)#15 | 3.5%(+1.22)#3,390 |
| 16. | Mililani Mauka | 4.5% | 2.3%(+2.16)#16 | 3.5%(+0.944)#3,719 |
| 17. | Halaula | 4.4% | 2.3%(+2.07)#17 | 3.5%(+0.861)#3,844 |
| 18. | East Kapolei | 4.4% | 2.3%(+2.05)#18 | 3.5%(+0.838)#3,875 |
| 19. | Leilani Estates | 4.3% | 2.3%(+2.01)#19 | 3.5%(+0.800)#3,939 |
| 20. | West Loch Estate | 4.2% | 2.3%(+1.90)#20 | 3.5%(+0.688)#4,108 |
| 21. | Pupukea | 4.2% | 2.3%(+1.85)#21 | 3.5%(+0.633)#4,213 |
| 22. | Ocean Pointe | 4.0% | 2.3%(+1.70)#22 | 3.5%(+0.493)#4,425 |
| 23. | Kaneohe | 3.9% | 2.3%(+1.61)#23 | 3.5%(+0.401)#4,586 |
| 24. | Makakilo | 3.9% | 2.3%(+1.56)#24 | 3.5%(+0.352)#4,681 |
| 25. | Holualoa | 3.8% | 2.3%(+1.47)#25 | 3.5%(+0.263)#4,857 |
| 26. | Iroquois Point | 3.6% | 2.3%(+1.29)#26 | 3.5%(+0.078)#5,198 |
| 27. | Kapolei | 3.5% | 2.3%(+1.23)#27 | 3.5%(+0.017)#5,334 |
| 28. | Pearl City | 3.4% | 2.3%(+1.10)#28 | 3.5%(-0.112)#5,612 |
| 29. | Waikele | 3.3% | 2.3%(+0.945)#29 | 3.5%(-0.266)#5,966 |
| 30. | Kahaluu | 3.2% | 2.3%(+0.895)#30 | 3.5%(-0.317)#6,097 |
| 31. | Eden Roc | 3.1% | 2.3%(+0.788)#31 | 3.5%(-0.424)#6,352 |
| 32. | Maunawili | 3.0% | 2.3%(+0.709)#32 | 3.5%(-0.503)#6,548 |
| 33. | Poipu | 3.0% | 2.3%(+0.646)#33 | 3.5%(-0.566)#6,699 |
| 34. | Urban Honolulu | 3.0% | 2.3%(+0.639)#34 | 3.5%(-0.573)#6,716 |
| 35. | Makawao | 2.9% | 2.3%(+0.595)#35 | 3.5%(-0.617)#6,812 |
| 36. | Makaha | 2.9% | 2.3%(+0.556)#36 | 3.5%(-0.655)#6,914 |
| 37. | Halawa | 2.7% | 2.3%(+0.436)#37 | 3.5%(-0.775)#7,245 |
| 38. | Aiea | 2.7% | 2.3%(+0.428)#38 | 3.5%(-0.784)#7,264 |
| 39. | East Honolulu | 2.7% | 2.3%(+0.389)#39 | 3.5%(-0.822)#7,377 |
| 40. | Hanapepe | 2.7% | 2.3%(+0.383)#40 | 3.5%(-0.828)#7,388 |
| 41. | Waipio | 2.7% | 2.3%(+0.367)#41 | 3.5%(-0.845)#7,432 |
| 42. | Kalihiwai | 2.6% | 2.3%(+0.319)#42 | 3.5%(-0.893)#7,565 |
| 43. | Mililani Town | 2.6% | 2.3%(+0.314)#43 | 3.5%(-0.897)#7,576 |
| 44. | Wailea | 2.4% | 2.3%(+0.133)#44 | 3.5%(-1.08)#8,111 |
| 45. | Waikapu | 2.4% | 2.3%(+0.118)#45 | 3.5%(-1.09)#8,162 |
| 46. | Royal Kunia | 2.4% | 2.3%(+0.111)#46 | 3.5%(-1.10)#8,184 |
| 47. | Ewa Villages | 2.4% | 2.3%(+0.110)#47 | 3.5%(-1.10)#8,188 |
| 48. | Kapaau | 2.4% | 2.3%(+0.089)#48 | 3.5%(-1.12)#8,256 |
| 49. | Waimea Cdp Kauai County | 2.3% | 2.3%(+0.033)#49 | 3.5%(-1.18)#8,444 |
| 50. | Kalaheo | 2.3% | 2.3%(+0.031)#50 | 3.5%(-1.18)#8,455 |
| 51. | Ahuimanu | 2.2% | 2.3%(-0.110)#51 | 3.5%(-1.32)#8,936 |
| 52. | Kailua Cdp Honolulu County | 2.2% | 2.3%(-0.112)#52 | 3.5%(-1.32)#8,940 |
| 53. | Ewa Gentry | 2.2% | 2.3%(-0.112)#53 | 3.5%(-1.32)#8,942 |
| 54. | Wahiawa | 2.2% | 2.3%(-0.117)#54 | 3.5%(-1.33)#8,959 |
| 55. | Honokaa | 2.2% | 2.3%(-0.122)#55 | 3.5%(-1.33)#8,973 |
| 56. | Launiupoko | 2.1% | 2.3%(-0.170)#56 | 3.5%(-1.38)#9,150 |
| 57. | Omao | 2.1% | 2.3%(-0.179)#57 | 3.5%(-1.39)#9,180 |
| 58. | Ainaloa | 2.0% | 2.3%(-0.297)#58 | 3.5%(-1.51)#9,576 |
| 59. | Waipio Acres | 1.9% | 2.3%(-0.376)#59 | 3.5%(-1.59)#9,884 |
| 60. | Maili | 1.9% | 2.3%(-0.382)#60 | 3.5%(-1.59)#9,913 |
| 61. | Puhi | 1.9% | 2.3%(-0.382)#61 | 3.5%(-1.59)#9,915 |
| 62. | Wainaku | 1.8% | 2.3%(-0.490)#62 | 3.5%(-1.70)#10,322 |
| 63. | Kahului | 1.8% | 2.3%(-0.543)#63 | 3.5%(-1.75)#10,557 |
| 64. | Napili Honokowai | 1.8% | 2.3%(-0.558)#64 | 3.5%(-1.77)#10,610 |
| 65. | Kula | 1.7% | 2.3%(-0.587)#65 | 3.5%(-1.80)#10,727 |
| 66. | Keaau | 1.7% | 2.3%(-0.595)#66 | 3.5%(-1.81)#10,775 |
| 67. | Hilo | 1.7% | 2.3%(-0.654)#67 | 3.5%(-1.87)#10,998 |
| 68. | Schofield Barracks | 1.6% | 2.3%(-0.702)#68 | 3.5%(-1.91)#11,231 |
| 69. | Hauula | 1.6% | 2.3%(-0.729)#69 | 3.5%(-1.94)#11,336 |
| 70. | Keokea | 1.6% | 2.3%(-0.736)#70 | 3.5%(-1.95)#11,369 |
| 71. | Laie | 1.6% | 2.3%(-0.741)#71 | 3.5%(-1.95)#11,395 |
| 72. | Hawaiian Beaches | 1.5% | 2.3%(-0.780)#72 | 3.5%(-1.99)#11,534 |
| 73. | Discovery Harbour | 1.5% | 2.3%(-0.794)#73 | 3.5%(-2.01)#11,607 |
| 74. | Pahala | 1.5% | 2.3%(-0.823)#74 | 3.5%(-2.03)#11,727 |
| 75. | Princeville | 1.4% | 2.3%(-0.904)#75 | 3.5%(-2.12)#12,059 |
| 76. | Ewa Beach | 1.4% | 2.3%(-0.922)#76 | 3.5%(-2.13)#12,134 |
| 77. | Kailua Cdp Hawaii County | 1.4% | 2.3%(-0.948)#77 | 3.5%(-2.16)#12,249 |
| 78. | Ko Olina | 1.3% | 2.3%(-0.985)#78 | 3.5%(-2.20)#12,412 |
| 79. | Mokuleia | 1.3% | 2.3%(-1.04)#79 | 3.5%(-2.25)#12,666 |
| 80. | Koloa | 1.3% | 2.3%(-1.05)#80 | 3.5%(-2.26)#12,703 |
| 81. | Waipahu | 1.2% | 2.3%(-1.07)#81 | 3.5%(-2.28)#12,823 |
| 82. | Whitmore Village | 1.2% | 2.3%(-1.08)#82 | 3.5%(-2.29)#12,857 |
| 83. | Kapalua | 1.1% | 2.3%(-1.21)#83 | 3.5%(-2.42)#13,444 |
| 84. | Wailuku | 1.1% | 2.3%(-1.22)#84 | 3.5%(-2.43)#13,475 |
| 85. | Kekaha | 1.1% | 2.3%(-1.22)#85 | 3.5%(-2.44)#13,520 |
| 86. | Waialua | 1.1% | 2.3%(-1.23)#86 | 3.5%(-2.44)#13,537 |
| 87. | Kihei | 1.1% | 2.3%(-1.24)#87 | 3.5%(-2.45)#13,567 |
| 88. | Haiku Pauwela | 1.1% | 2.3%(-1.25)#88 | 3.5%(-2.46)#13,657 |
| 89. | Honomu | 0.96% | 2.3%(-1.36)#89 | 3.5%(-2.57)#14,092 |
| 90. | Honaunau Napoopoo | 0.88% | 2.3%(-1.44)#90 | 3.5%(-2.65)#14,489 |
| 91. | Olinda | 0.87% | 2.3%(-1.44)#91 | 3.5%(-2.65)#14,500 |
| 92. | Mahinahina | 0.77% | 2.3%(-1.54)#92 | 3.5%(-2.75)#14,976 |
| 93. | Heeia | 0.77% | 2.3%(-1.54)#93 | 3.5%(-2.76)#14,995 |
| 94. | Lahaina | 0.76% | 2.3%(-1.55)#94 | 3.5%(-2.76)#15,041 |
| 95. | Waianae | 0.75% | 2.3%(-1.57)#95 | 3.5%(-2.78)#15,108 |
| 96. | Papaikou | 0.74% | 2.3%(-1.57)#96 | 3.5%(-2.79)#15,136 |
| 97. | Kaiminani | 0.73% | 2.3%(-1.58)#97 | 3.5%(-2.79)#15,176 |
| 98. | Waikoloa Village | 0.67% | 2.3%(-1.64)#98 | 3.5%(-2.85)#15,454 |
| 99. | Kaaawa | 0.65% | 2.3%(-1.66)#99 | 3.5%(-2.87)#15,538 |
| 100. | Paia | 0.64% | 2.3%(-1.68)#100 | 3.5%(-2.89)#15,638 |
1
2Common Questions
What are the Top 10 Cities with the Highest Percentage of Population Employed in Computer & Mathematics in Hawaii?
Top 10 Cities with the Highest Percentage of Population Employed in Computer & Mathematics in Hawaii are:
#1
19.0%
#2
8.5%
#3
8.0%
#4
7.6%
#5
7.3%
#6
6.2%
#7
5.6%
#8
5.1%
#9
5.0%
#10
4.8%
What city has the Highest Percentage of Population Employed in Computer & Mathematics in Hawaii?
Volcano has the Highest Percentage of Population Employed in Computer & Mathematics in Hawaii with 19.0%.
What is the Percentage of Population Employed in Computer & Mathematics in the State of Hawaii?
Percentage of Population Employed in Computer & Mathematics in Hawaii is 2.3%.
What is the Percentage of Population Employed in Computer & Mathematics in the United States?
Percentage of Population Employed in Computer & Mathematics in the United States is 3.5%.