Cities with the Highest Percentage of Population Employed in Computer & Mathematics in Louisiana
RELATED REPORTS & OPTIONS
Computer & Mathematics
Louisiana
Compare Cities
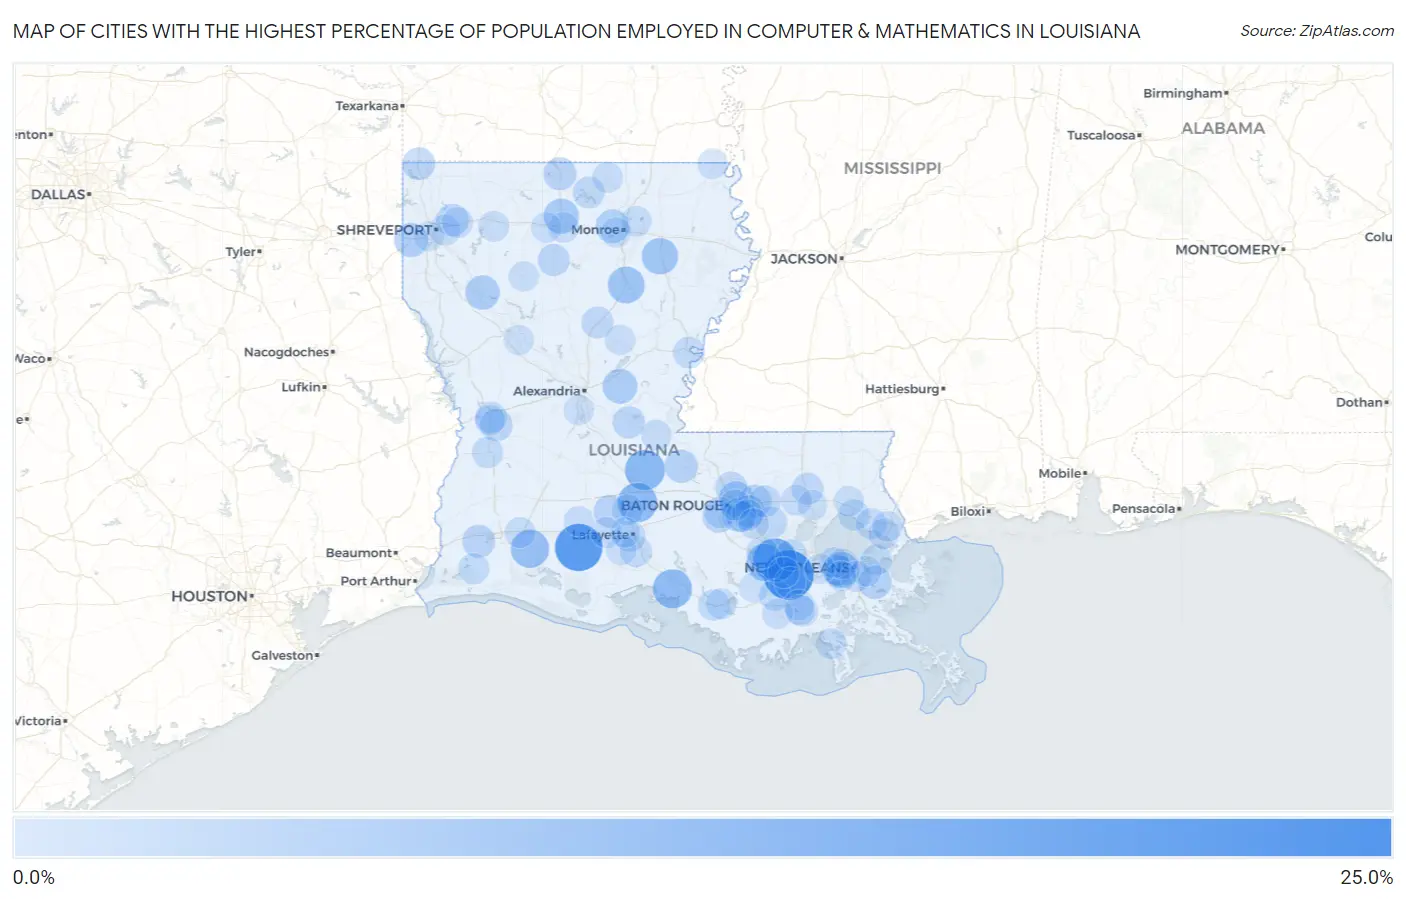
Map of Cities with the Highest Percentage of Population Employed in Computer & Mathematics in Louisiana
0.0%
25.0%
Cities with the Highest Percentage of Population Employed in Computer & Mathematics in Louisiana
| City | % Employed | vs State | vs National | |
| 1. | Pleasure Bend | 23.0% | 1.7%(+21.3)#1 | 3.5%(+19.5)#121 |
| 2. | Morse | 20.5% | 1.7%(+18.8)#2 | 3.5%(+17.0)#162 |
| 3. | Hester | 16.2% | 1.7%(+14.5)#3 | 3.5%(+12.7)#260 |
| 4. | Palmetto | 12.3% | 1.7%(+10.6)#4 | 3.5%(+8.78)#473 |
| 5. | Leonville | 11.5% | 1.7%(+9.84)#5 | 3.5%(+8.00)#537 |
| 6. | Glencoe | 11.2% | 1.7%(+9.55)#6 | 3.5%(+7.71)#568 |
| 7. | Hayes | 10.2% | 1.7%(+8.50)#7 | 3.5%(+6.67)#700 |
| 8. | St James | 9.5% | 1.7%(+7.80)#8 | 3.5%(+5.96)#838 |
| 9. | Columbia | 8.6% | 1.7%(+6.93)#9 | 3.5%(+5.10)#1,030 |
| 10. | Mangham | 8.3% | 1.7%(+6.57)#10 | 3.5%(+4.73)#1,131 |
| 11. | Elmwood | 8.1% | 1.7%(+6.39)#11 | 3.5%(+4.55)#1,189 |
| 12. | Vienna | 7.0% | 1.7%(+5.29)#12 | 3.5%(+3.45)#1,610 |
| 13. | Deville | 6.5% | 1.7%(+4.83)#13 | 3.5%(+3.00)#1,859 |
| 14. | Merrydale | 6.4% | 1.7%(+4.71)#14 | 3.5%(+2.87)#1,914 |
| 15. | Edgefield | 6.1% | 1.7%(+4.39)#15 | 3.5%(+2.55)#2,118 |
| 16. | Greenwood | 5.7% | 1.7%(+3.99)#16 | 3.5%(+2.16)#2,417 |
| 17. | Claiborne | 5.6% | 1.7%(+3.88)#17 | 3.5%(+2.04)#2,514 |
| 18. | Oak Hills Place | 5.3% | 1.7%(+3.65)#18 | 3.5%(+1.81)#2,738 |
| 19. | Poydras | 5.0% | 1.7%(+3.27)#19 | 3.5%(+1.43)#3,136 |
| 20. | Morganza | 4.9% | 1.7%(+3.23)#20 | 3.5%(+1.39)#3,180 |
| 21. | Denham Springs | 4.6% | 1.7%(+2.89)#21 | 3.5%(+1.05)#3,588 |
| 22. | Church Point | 4.5% | 1.7%(+2.84)#22 | 3.5%(+1.00)#3,654 |
| 23. | Lillie | 4.5% | 1.7%(+2.79)#23 | 3.5%(+0.953)#3,708 |
| 24. | Carlyss | 4.5% | 1.7%(+2.79)#24 | 3.5%(+0.952)#3,710 |
| 25. | Addis | 4.4% | 1.7%(+2.71)#25 | 3.5%(+0.873)#3,825 |
| 26. | Ida | 4.3% | 1.7%(+2.60)#26 | 3.5%(+0.761)#3,999 |
| 27. | Fort Polk South | 4.1% | 1.7%(+2.41)#27 | 3.5%(+0.572)#4,315 |
| 28. | Red Chute | 4.0% | 1.7%(+2.29)#28 | 3.5%(+0.449)#4,506 |
| 29. | Mansura | 3.9% | 1.7%(+2.23)#29 | 3.5%(+0.397)#4,595 |
| 30. | Shenandoah | 3.9% | 1.7%(+2.23)#30 | 3.5%(+0.396)#4,604 |
| 31. | North Hodge | 3.6% | 1.7%(+1.93)#31 | 3.5%(+0.090)#5,175 |
| 32. | Tickfaw | 3.5% | 1.7%(+1.81)#32 | 3.5%(-0.025)#5,426 |
| 33. | Farmerville | 3.5% | 1.7%(+1.77)#33 | 3.5%(-0.069)#5,513 |
| 34. | Tullos | 3.4% | 1.7%(+1.70)#34 | 3.5%(-0.135)#5,659 |
| 35. | Baker | 3.4% | 1.7%(+1.67)#35 | 3.5%(-0.169)#5,735 |
| 36. | French Settlement | 3.3% | 1.7%(+1.59)#36 | 3.5%(-0.246)#5,922 |
| 37. | Walker | 3.2% | 1.7%(+1.51)#37 | 3.5%(-0.329)#6,127 |
| 38. | Leesville | 3.1% | 1.7%(+1.45)#38 | 3.5%(-0.383)#6,258 |
| 39. | Ridgecrest | 3.1% | 1.7%(+1.44)#39 | 3.5%(-0.400)#6,300 |
| 40. | Lafourche Crossing | 3.1% | 1.7%(+1.43)#40 | 3.5%(-0.406)#6,310 |
| 41. | Youngsville | 3.1% | 1.7%(+1.37)#41 | 3.5%(-0.472)#6,474 |
| 42. | Union | 2.9% | 1.7%(+1.25)#42 | 3.5%(-0.583)#6,743 |
| 43. | Patterson | 2.9% | 1.7%(+1.22)#43 | 3.5%(-0.618)#6,813 |
| 44. | Garyville | 2.8% | 1.7%(+1.13)#44 | 3.5%(-0.706)#7,042 |
| 45. | Deridder | 2.8% | 1.7%(+1.12)#45 | 3.5%(-0.717)#7,076 |
| 46. | Brusly | 2.8% | 1.7%(+1.10)#46 | 3.5%(-0.734)#7,122 |
| 47. | Harahan | 2.8% | 1.7%(+1.09)#47 | 3.5%(-0.745)#7,157 |
| 48. | Kraemer | 2.8% | 1.7%(+1.07)#48 | 3.5%(-0.765)#7,219 |
| 49. | Mandeville | 2.7% | 1.7%(+1.06)#49 | 3.5%(-0.780)#7,255 |
| 50. | Lafayette | 2.7% | 1.7%(+0.987)#50 | 3.5%(-0.851)#7,446 |
| 51. | Lacombe | 2.7% | 1.7%(+0.965)#51 | 3.5%(-0.873)#7,510 |
| 52. | Village St George | 2.6% | 1.7%(+0.930)#52 | 3.5%(-0.908)#7,600 |
| 53. | South Vacherie | 2.6% | 1.7%(+0.908)#53 | 3.5%(-0.930)#7,646 |
| 54. | New Orleans | 2.6% | 1.7%(+0.900)#54 | 3.5%(-0.938)#7,668 |
| 55. | Sunset | 2.6% | 1.7%(+0.893)#55 | 3.5%(-0.944)#7,687 |
| 56. | Old Jefferson | 2.6% | 1.7%(+0.872)#56 | 3.5%(-0.965)#7,761 |
| 57. | Rayne | 2.5% | 1.7%(+0.829)#57 | 3.5%(-1.01)#7,887 |
| 58. | Baton Rouge | 2.5% | 1.7%(+0.798)#58 | 3.5%(-1.04)#7,979 |
| 59. | River Ridge | 2.5% | 1.7%(+0.796)#59 | 3.5%(-1.04)#7,985 |
| 60. | Hackberry | 2.5% | 1.7%(+0.794)#60 | 3.5%(-1.04)#7,991 |
| 61. | Lockport | 2.5% | 1.7%(+0.782)#61 | 3.5%(-1.06)#8,028 |
| 62. | Bossier City | 2.4% | 1.7%(+0.749)#62 | 3.5%(-1.09)#8,150 |
| 63. | Eastwood | 2.4% | 1.7%(+0.729)#63 | 3.5%(-1.11)#8,210 |
| 64. | Dubberly | 2.3% | 1.7%(+0.652)#64 | 3.5%(-1.19)#8,473 |
| 65. | Berwick | 2.3% | 1.7%(+0.637)#65 | 3.5%(-1.20)#8,539 |
| 66. | Iowa | 2.3% | 1.7%(+0.633)#66 | 3.5%(-1.20)#8,551 |
| 67. | Gretna | 2.3% | 1.7%(+0.625)#67 | 3.5%(-1.21)#8,581 |
| 68. | Perry | 2.3% | 1.7%(+0.622)#68 | 3.5%(-1.22)#8,596 |
| 69. | Golden Meadow | 2.3% | 1.7%(+0.586)#69 | 3.5%(-1.25)#8,703 |
| 70. | Kenner | 2.3% | 1.7%(+0.578)#70 | 3.5%(-1.26)#8,738 |
| 71. | Simmesport | 2.2% | 1.7%(+0.530)#71 | 3.5%(-1.31)#8,896 |
| 72. | Marion | 2.2% | 1.7%(+0.506)#72 | 3.5%(-1.33)#8,966 |
| 73. | Swartz | 2.2% | 1.7%(+0.495)#73 | 3.5%(-1.34)#9,010 |
| 74. | Eden Isle | 2.2% | 1.7%(+0.482)#74 | 3.5%(-1.36)#9,054 |
| 75. | Ruston | 2.2% | 1.7%(+0.466)#75 | 3.5%(-1.37)#9,110 |
| 76. | Albany | 2.1% | 1.7%(+0.445)#76 | 3.5%(-1.39)#9,188 |
| 77. | Mathews | 2.1% | 1.7%(+0.415)#77 | 3.5%(-1.42)#9,294 |
| 78. | Prairieville | 2.1% | 1.7%(+0.407)#78 | 3.5%(-1.43)#9,321 |
| 79. | Slidell | 2.0% | 1.7%(+0.329)#79 | 3.5%(-1.51)#9,572 |
| 80. | Metairie | 2.0% | 1.7%(+0.296)#80 | 3.5%(-1.54)#9,706 |
| 81. | Chalmette | 2.0% | 1.7%(+0.267)#81 | 3.5%(-1.57)#9,823 |
| 82. | Bayou Cane | 2.0% | 1.7%(+0.265)#82 | 3.5%(-1.57)#9,832 |
| 83. | Simsboro | 1.9% | 1.7%(+0.263)#83 | 3.5%(-1.57)#9,843 |
| 84. | Kilbourne | 1.9% | 1.7%(+0.236)#84 | 3.5%(-1.60)#9,955 |
| 85. | Lockport Heights | 1.9% | 1.7%(+0.197)#85 | 3.5%(-1.64)#10,097 |
| 86. | Woodworth | 1.9% | 1.7%(+0.171)#86 | 3.5%(-1.67)#10,182 |
| 87. | New Llano | 1.9% | 1.7%(+0.171)#87 | 3.5%(-1.67)#10,183 |
| 88. | Iota | 1.9% | 1.7%(+0.168)#88 | 3.5%(-1.67)#10,194 |
| 89. | Covington | 1.8% | 1.7%(+0.122)#89 | 3.5%(-1.72)#10,376 |
| 90. | Jena | 1.8% | 1.7%(+0.121)#90 | 3.5%(-1.72)#10,381 |
| 91. | Maurice | 1.8% | 1.7%(+0.106)#91 | 3.5%(-1.73)#10,456 |
| 92. | Saline | 1.8% | 1.7%(+0.083)#92 | 3.5%(-1.75)#10,566 |
| 93. | Point Place | 1.7% | 1.7%(+0.047)#93 | 3.5%(-1.79)#10,698 |
| 94. | Destrehan | 1.7% | 1.7%(+0.012)#94 | 3.5%(-1.83)#10,847 |
| 95. | Brownsville | 1.7% | 1.7%(-0.034)#95 | 3.5%(-1.87)#11,031 |
| 96. | Avondale | 1.7% | 1.7%(-0.036)#96 | 3.5%(-1.87)#11,045 |
| 97. | Labadieville | 1.6% | 1.7%(-0.087)#97 | 3.5%(-1.92)#11,271 |
| 98. | Shreveport | 1.6% | 1.7%(-0.101)#98 | 3.5%(-1.94)#11,329 |
| 99. | Scott | 1.6% | 1.7%(-0.124)#99 | 3.5%(-1.96)#11,424 |
| 100. | Ponchatoula | 1.6% | 1.7%(-0.128)#100 | 3.5%(-1.97)#11,448 |
Common Questions
What are the Top 10 Cities with the Highest Percentage of Population Employed in Computer & Mathematics in Louisiana?
Top 10 Cities with the Highest Percentage of Population Employed in Computer & Mathematics in Louisiana are:
What city has the Highest Percentage of Population Employed in Computer & Mathematics in Louisiana?
Pleasure Bend has the Highest Percentage of Population Employed in Computer & Mathematics in Louisiana with 23.0%.
What is the Percentage of Population Employed in Computer & Mathematics in the State of Louisiana?
Percentage of Population Employed in Computer & Mathematics in Louisiana is 1.7%.
What is the Percentage of Population Employed in Computer & Mathematics in the United States?
Percentage of Population Employed in Computer & Mathematics in the United States is 3.5%.