Cities with the Highest Percentage of Population Employed in Computer & Mathematics in South Dakota
RELATED REPORTS & OPTIONS
Computer & Mathematics
South Dakota
Compare Cities
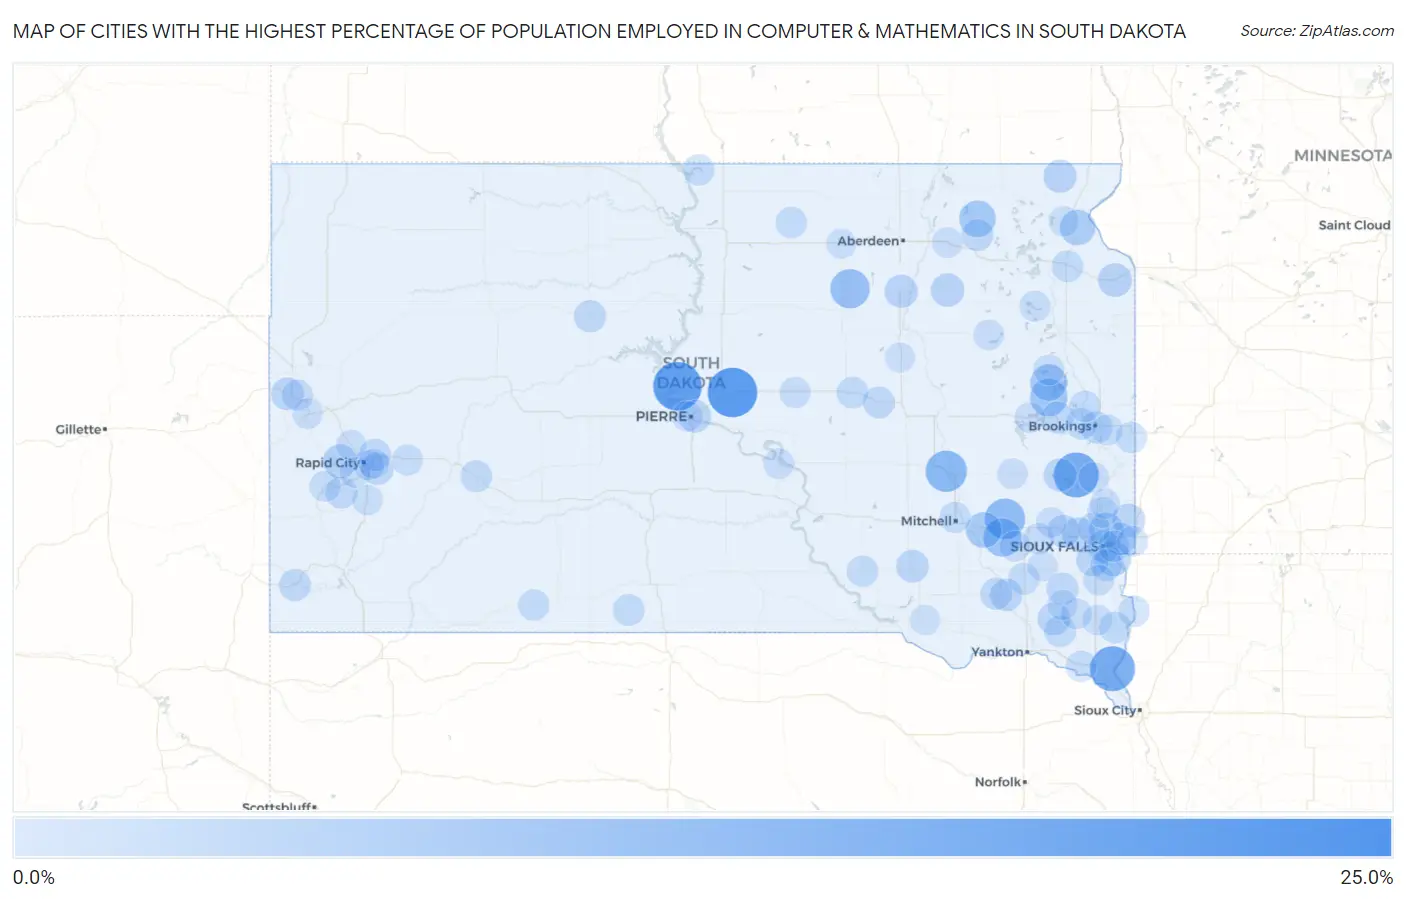
Map of Cities with the Highest Percentage of Population Employed in Computer & Mathematics in South Dakota
0.0%
25.0%
Cities with the Highest Percentage of Population Employed in Computer & Mathematics in South Dakota
| City | % Employed | vs State | vs National | |
| 1. | Wonderland Homes | 21.0% | 2.0%(+19.0)#1 | 3.5%(+17.5)#155 |
| 2. | Blunt | 18.8% | 2.0%(+16.8)#2 | 3.5%(+15.3)#193 |
| 3. | Cow Creek | 17.9% | 2.0%(+15.8)#3 | 3.5%(+14.3)#211 |
| 4. | Richland | 14.6% | 2.0%(+12.6)#4 | 3.5%(+11.1)#335 |
| 5. | Wentworth | 14.5% | 2.0%(+12.5)#5 | 3.5%(+11.0)#340 |
| 6. | Forestburg | 11.1% | 2.0%(+9.10)#6 | 3.5%(+7.59)#581 |
| 7. | Spencer | 10.3% | 2.0%(+8.24)#7 | 3.5%(+6.73)#689 |
| 8. | Cresbard | 9.3% | 2.0%(+7.29)#8 | 3.5%(+5.78)#874 |
| 9. | Emery | 8.4% | 2.0%(+6.35)#9 | 3.5%(+4.84)#1,098 |
| 10. | Badger | 7.7% | 2.0%(+5.68)#10 | 3.5%(+4.17)#1,335 |
| 11. | Lake Norden | 6.9% | 2.0%(+4.91)#11 | 3.5%(+3.40)#1,633 |
| 12. | Langford | 6.8% | 2.0%(+4.75)#12 | 3.5%(+3.24)#1,727 |
| 13. | Alexandria | 6.0% | 2.0%(+4.03)#13 | 3.5%(+2.52)#2,140 |
| 14. | Peever | 6.0% | 2.0%(+3.99)#14 | 3.5%(+2.48)#2,169 |
| 15. | Shindler | 4.9% | 2.0%(+2.85)#15 | 3.5%(+1.34)#3,249 |
| 16. | Renner Corner | 4.9% | 2.0%(+2.84)#16 | 3.5%(+1.33)#3,259 |
| 17. | Johnson Siding | 4.4% | 2.0%(+2.36)#17 | 3.5%(+0.850)#3,856 |
| 18. | Milbank | 4.2% | 2.0%(+2.24)#18 | 3.5%(+0.724)#4,049 |
| 19. | Conde | 4.0% | 2.0%(+1.99)#19 | 3.5%(+0.475)#4,462 |
| 20. | Claire City | 3.9% | 2.0%(+1.91)#20 | 3.5%(+0.397)#4,602 |
| 21. | Mellette | 3.8% | 2.0%(+1.78)#21 | 3.5%(+0.273)#4,832 |
| 22. | Hartford | 3.7% | 2.0%(+1.69)#22 | 3.5%(+0.179)#4,992 |
| 23. | Madison | 3.7% | 2.0%(+1.67)#23 | 3.5%(+0.157)#5,044 |
| 24. | Sioux Falls | 3.6% | 2.0%(+1.58)#24 | 3.5%(+0.071)#5,215 |
| 25. | Garretson | 3.5% | 2.0%(+1.53)#25 | 3.5%(+0.018)#5,331 |
| 26. | North Spearfish | 3.4% | 2.0%(+1.43)#26 | 3.5%(-0.076)#5,527 |
| 27. | Humboldt | 3.4% | 2.0%(+1.41)#27 | 3.5%(-0.096)#5,579 |
| 28. | Tea | 3.4% | 2.0%(+1.39)#28 | 3.5%(-0.119)#5,627 |
| 29. | Brandon | 3.4% | 2.0%(+1.39)#29 | 3.5%(-0.121)#5,630 |
| 30. | Corsica | 3.4% | 2.0%(+1.38)#30 | 3.5%(-0.135)#5,656 |
| 31. | Irene | 3.4% | 2.0%(+1.34)#31 | 3.5%(-0.166)#5,729 |
| 32. | Pierre | 3.4% | 2.0%(+1.34)#32 | 3.5%(-0.172)#5,739 |
| 33. | Menno | 3.2% | 2.0%(+1.20)#33 | 3.5%(-0.307)#6,071 |
| 34. | Green Valley | 3.1% | 2.0%(+1.07)#34 | 3.5%(-0.439)#6,395 |
| 35. | Eagle Butte | 3.0% | 2.0%(+1.01)#35 | 3.5%(-0.501)#6,546 |
| 36. | Hurley | 3.0% | 2.0%(+0.962)#36 | 3.5%(-0.548)#6,659 |
| 37. | Crooks | 2.9% | 2.0%(+0.921)#37 | 3.5%(-0.590)#6,762 |
| 38. | Ashland Heights | 2.9% | 2.0%(+0.913)#38 | 3.5%(-0.598)#6,779 |
| 39. | Brookings | 2.9% | 2.0%(+0.884)#39 | 3.5%(-0.627)#6,842 |
| 40. | Edgemont | 2.9% | 2.0%(+0.857)#40 | 3.5%(-0.654)#6,912 |
| 41. | Olivet | 2.9% | 2.0%(+0.843)#41 | 3.5%(-0.667)#6,958 |
| 42. | Arlington | 2.8% | 2.0%(+0.803)#42 | 3.5%(-0.708)#7,046 |
| 43. | Keystone | 2.8% | 2.0%(+0.777)#43 | 3.5%(-0.734)#7,123 |
| 44. | Pierpont | 2.8% | 2.0%(+0.764)#44 | 3.5%(-0.747)#7,175 |
| 45. | Wessington | 2.8% | 2.0%(+0.738)#45 | 3.5%(-0.772)#7,236 |
| 46. | Wall | 2.7% | 2.0%(+0.662)#46 | 3.5%(-0.849)#7,445 |
| 47. | Alcester | 2.6% | 2.0%(+0.618)#47 | 3.5%(-0.893)#7,558 |
| 48. | St Lawrence | 2.6% | 2.0%(+0.618)#48 | 3.5%(-0.893)#7,568 |
| 49. | Volga | 2.6% | 2.0%(+0.575)#49 | 3.5%(-0.936)#7,662 |
| 50. | Harrisburg | 2.5% | 2.0%(+0.532)#50 | 3.5%(-0.979)#7,813 |
| 51. | St Francis | 2.5% | 2.0%(+0.499)#51 | 3.5%(-1.01)#7,897 |
| 52. | Summit | 2.5% | 2.0%(+0.455)#52 | 3.5%(-1.06)#8,032 |
| 53. | Wakonda | 2.4% | 2.0%(+0.425)#53 | 3.5%(-1.09)#8,138 |
| 54. | Freeman | 2.4% | 2.0%(+0.353)#54 | 3.5%(-1.16)#8,378 |
| 55. | Bruce | 2.4% | 2.0%(+0.348)#55 | 3.5%(-1.16)#8,385 |
| 56. | Boulder Canyon | 2.3% | 2.0%(+0.305)#56 | 3.5%(-1.21)#8,557 |
| 57. | Elkton | 2.3% | 2.0%(+0.294)#57 | 3.5%(-1.22)#8,600 |
| 58. | Platte | 2.3% | 2.0%(+0.288)#58 | 3.5%(-1.22)#8,618 |
| 59. | Pine Lakes Addition | 2.3% | 2.0%(+0.285)#59 | 3.5%(-1.23)#8,626 |
| 60. | Martin | 2.2% | 2.0%(+0.187)#60 | 3.5%(-1.32)#8,944 |
| 61. | Hosmer | 2.2% | 2.0%(+0.137)#61 | 3.5%(-1.37)#9,123 |
| 62. | Hudson | 2.1% | 2.0%(+0.123)#62 | 3.5%(-1.39)#9,171 |
| 63. | Pollock | 2.1% | 2.0%(+0.099)#63 | 3.5%(-1.41)#9,256 |
| 64. | Mitchell | 2.1% | 2.0%(+0.040)#64 | 3.5%(-1.47)#9,462 |
| 65. | Vermillion | 2.0% | 2.0%(+0.022)#65 | 3.5%(-1.49)#9,511 |
| 66. | Spearfish | 2.0% | 2.0%(+0.001)#66 | 3.5%(-1.51)#9,579 |
| 67. | Florence | 2.0% | 2.0%(-0.000)#67 | 3.5%(-1.51)#9,590 |
| 68. | Canistota | 2.0% | 2.0%(-0.008)#68 | 3.5%(-1.52)#9,615 |
| 69. | Highmore | 2.0% | 2.0%(-0.009)#69 | 3.5%(-1.52)#9,619 |
| 70. | New Underwood | 1.9% | 2.0%(-0.127)#70 | 3.5%(-1.64)#10,088 |
| 71. | Hill City | 1.9% | 2.0%(-0.137)#71 | 3.5%(-1.65)#10,118 |
| 72. | Centerville | 1.8% | 2.0%(-0.200)#72 | 3.5%(-1.71)#10,359 |
| 73. | Baltic | 1.8% | 2.0%(-0.203)#73 | 3.5%(-1.71)#10,368 |
| 74. | Aurora | 1.8% | 2.0%(-0.234)#74 | 3.5%(-1.74)#10,520 |
| 75. | Worthing | 1.8% | 2.0%(-0.246)#75 | 3.5%(-1.76)#10,570 |
| 76. | Hayti | 1.7% | 2.0%(-0.282)#76 | 3.5%(-1.79)#10,708 |
| 77. | Howard | 1.6% | 2.0%(-0.378)#77 | 3.5%(-1.89)#11,110 |
| 78. | Clark | 1.6% | 2.0%(-0.380)#78 | 3.5%(-1.89)#11,116 |
| 79. | Lower Brule | 1.6% | 2.0%(-0.388)#79 | 3.5%(-1.90)#11,143 |
| 80. | Fort Pierre | 1.6% | 2.0%(-0.401)#80 | 3.5%(-1.91)#11,212 |
| 81. | Valley Springs | 1.6% | 2.0%(-0.401)#81 | 3.5%(-1.91)#11,214 |
| 82. | Bridgewater | 1.6% | 2.0%(-0.401)#82 | 3.5%(-1.91)#11,217 |
| 83. | Hermosa | 1.6% | 2.0%(-0.418)#83 | 3.5%(-1.93)#11,293 |
| 84. | Lake Preston | 1.6% | 2.0%(-0.433)#84 | 3.5%(-1.94)#11,348 |
| 85. | Groton | 1.6% | 2.0%(-0.450)#85 | 3.5%(-1.96)#11,423 |
| 86. | Montrose | 1.5% | 2.0%(-0.494)#86 | 3.5%(-2.00)#11,602 |
| 87. | Deadwood | 1.5% | 2.0%(-0.515)#87 | 3.5%(-2.03)#11,693 |
| 88. | Colman | 1.5% | 2.0%(-0.540)#88 | 3.5%(-2.05)#11,802 |
| 89. | Beresford | 1.4% | 2.0%(-0.573)#89 | 3.5%(-2.08)#11,931 |
| 90. | Colonial Pine Hills | 1.4% | 2.0%(-0.574)#90 | 3.5%(-2.09)#11,933 |
| 91. | Rapid City | 1.4% | 2.0%(-0.579)#91 | 3.5%(-2.09)#11,955 |
| 92. | Summerset | 1.4% | 2.0%(-0.602)#92 | 3.5%(-2.11)#12,051 |
| 93. | Viborg | 1.4% | 2.0%(-0.651)#93 | 3.5%(-2.16)#12,256 |
| 94. | Agency Village | 1.4% | 2.0%(-0.659)#94 | 3.5%(-2.17)#12,292 |
| 95. | Rapid Valley | 1.3% | 2.0%(-0.701)#95 | 3.5%(-2.21)#12,486 |
| 96. | Marion | 1.3% | 2.0%(-0.721)#96 | 3.5%(-2.23)#12,577 |
| 97. | Dell Rapids | 1.3% | 2.0%(-0.732)#97 | 3.5%(-2.24)#12,617 |
| 98. | Wagner | 1.3% | 2.0%(-0.732)#98 | 3.5%(-2.24)#12,619 |
| 99. | Ipswich | 1.2% | 2.0%(-0.794)#99 | 3.5%(-2.31)#12,908 |
| 100. | Tulare | 1.2% | 2.0%(-0.794)#100 | 3.5%(-2.31)#12,914 |
Common Questions
What are the Top 10 Cities with the Highest Percentage of Population Employed in Computer & Mathematics in South Dakota?
Top 10 Cities with the Highest Percentage of Population Employed in Computer & Mathematics in South Dakota are:
#1
18.8%
#2
17.9%
#3
14.6%
#4
14.5%
#5
11.1%
#6
10.3%
#7
9.3%
#8
8.4%
#9
7.7%
#10
6.9%
What city has the Highest Percentage of Population Employed in Computer & Mathematics in South Dakota?
Blunt has the Highest Percentage of Population Employed in Computer & Mathematics in South Dakota with 18.8%.
What is the Percentage of Population Employed in Computer & Mathematics in the State of South Dakota?
Percentage of Population Employed in Computer & Mathematics in South Dakota is 2.0%.
What is the Percentage of Population Employed in Computer & Mathematics in the United States?
Percentage of Population Employed in Computer & Mathematics in the United States is 3.5%.