Cities with the Highest Percentage of Population Employed in Computer & Mathematics in West Virginia
RELATED REPORTS & OPTIONS
Computer & Mathematics
West Virginia
Compare Cities
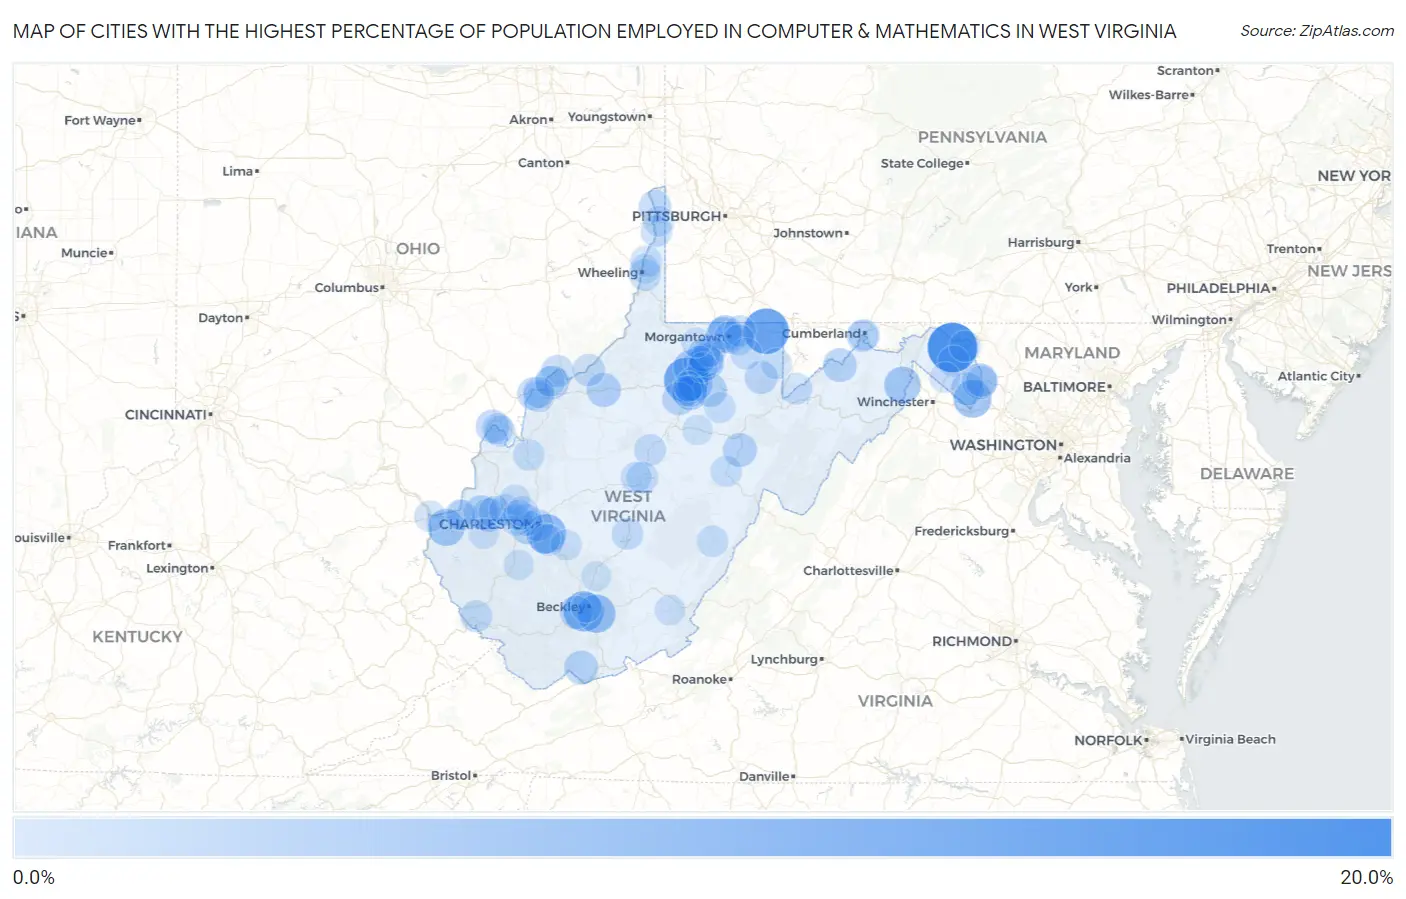
Map of Cities with the Highest Percentage of Population Employed in Computer & Mathematics in West Virginia
0.0%
20.0%
Cities with the Highest Percentage of Population Employed in Computer & Mathematics in West Virginia
| City | % Employed | vs State | vs National | |
| 1. | Hedgesville | 17.5% | 1.9%(+15.6)#1 | 3.5%(+14.0)#218 |
| 2. | Crooked Creek | 15.1% | 1.9%(+13.2)#2 | 3.5%(+11.6)#308 |
| 3. | Brandonville | 13.9% | 1.9%(+11.9)#3 | 3.5%(+10.3)#374 |
| 4. | Hepzibah | 13.1% | 1.9%(+11.2)#4 | 3.5%(+9.62)#422 |
| 5. | East View | 11.9% | 1.9%(+10.00)#5 | 3.5%(+8.39)#502 |
| 6. | Crab Orchard | 9.6% | 1.9%(+7.69)#6 | 3.5%(+6.09)#811 |
| 7. | Rand | 8.9% | 1.9%(+7.01)#7 | 3.5%(+5.41)#952 |
| 8. | Daniels | 8.0% | 1.9%(+6.09)#8 | 3.5%(+4.49)#1,209 |
| 9. | Shannondale | 7.6% | 1.9%(+5.69)#9 | 3.5%(+4.08)#1,366 |
| 10. | Lavalette | 6.7% | 1.9%(+4.75)#10 | 3.5%(+3.14)#1,771 |
| 11. | Capon Bridge | 6.6% | 1.9%(+4.63)#11 | 3.5%(+3.03)#1,844 |
| 12. | Enterprise | 5.8% | 1.9%(+3.86)#12 | 3.5%(+2.26)#2,326 |
| 13. | Bolivar | 5.7% | 1.9%(+3.79)#13 | 3.5%(+2.18)#2,388 |
| 14. | Westover | 5.7% | 1.9%(+3.77)#14 | 3.5%(+2.17)#2,402 |
| 15. | Pleasant Valley | 5.5% | 1.9%(+3.54)#15 | 3.5%(+1.93)#2,609 |
| 16. | Stonewood | 5.4% | 1.9%(+3.45)#16 | 3.5%(+1.85)#2,702 |
| 17. | Bridgeport | 5.3% | 1.9%(+3.39)#17 | 3.5%(+1.78)#2,769 |
| 18. | Star City | 4.8% | 1.9%(+2.86)#18 | 3.5%(+1.25)#3,354 |
| 19. | Milton | 4.6% | 1.9%(+2.67)#19 | 3.5%(+1.07)#3,569 |
| 20. | Ellenboro | 4.5% | 1.9%(+2.62)#20 | 3.5%(+1.02)#3,625 |
| 21. | Beverly | 4.3% | 1.9%(+2.40)#21 | 3.5%(+0.800)#3,941 |
| 22. | Ranson Corporation | 4.3% | 1.9%(+2.39)#22 | 3.5%(+0.785)#3,966 |
| 23. | Flemington | 4.3% | 1.9%(+2.38)#23 | 3.5%(+0.776)#3,983 |
| 24. | Montcalm | 4.3% | 1.9%(+2.36)#24 | 3.5%(+0.756)#4,005 |
| 25. | Keyser | 4.2% | 1.9%(+2.30)#25 | 3.5%(+0.695)#4,099 |
| 26. | Culloden | 4.2% | 1.9%(+2.29)#26 | 3.5%(+0.689)#4,107 |
| 27. | Booth | 4.2% | 1.9%(+2.29)#27 | 3.5%(+0.686)#4,110 |
| 28. | South Charleston | 4.1% | 1.9%(+2.15)#28 | 3.5%(+0.551)#4,355 |
| 29. | North Hills | 4.1% | 1.9%(+2.14)#29 | 3.5%(+0.540)#4,366 |
| 30. | Fairmont | 4.0% | 1.9%(+2.04)#30 | 3.5%(+0.436)#4,535 |
| 31. | Institute | 3.9% | 1.9%(+1.98)#31 | 3.5%(+0.372)#4,643 |
| 32. | Mason | 3.8% | 1.9%(+1.89)#32 | 3.5%(+0.289)#4,796 |
| 33. | Lester | 3.8% | 1.9%(+1.89)#33 | 3.5%(+0.285)#4,805 |
| 34. | Charles Town | 3.8% | 1.9%(+1.85)#34 | 3.5%(+0.242)#4,881 |
| 35. | Hurricane | 3.6% | 1.9%(+1.71)#35 | 3.5%(+0.103)#5,156 |
| 36. | West Milford | 3.6% | 1.9%(+1.69)#36 | 3.5%(+0.086)#5,184 |
| 37. | Washington | 3.6% | 1.9%(+1.65)#37 | 3.5%(+0.047)#5,256 |
| 38. | Rowlesburg | 3.6% | 1.9%(+1.63)#38 | 3.5%(+0.031)#5,294 |
| 39. | Barrackville | 3.5% | 1.9%(+1.58)#39 | 3.5%(-0.028)#5,429 |
| 40. | West Dunbar | 3.4% | 1.9%(+1.44)#40 | 3.5%(-0.163)#5,721 |
| 41. | Williamstown | 3.3% | 1.9%(+1.36)#41 | 3.5%(-0.245)#5,917 |
| 42. | New Cumberland | 3.0% | 1.9%(+1.12)#42 | 3.5%(-0.479)#6,491 |
| 43. | St Marys | 3.0% | 1.9%(+1.08)#43 | 3.5%(-0.526)#6,603 |
| 44. | Morgantown | 2.9% | 1.9%(+0.994)#44 | 3.5%(-0.610)#6,796 |
| 45. | Charleston | 2.8% | 1.9%(+0.855)#45 | 3.5%(-0.749)#7,178 |
| 46. | Dunbar | 2.7% | 1.9%(+0.828)#46 | 3.5%(-0.776)#7,246 |
| 47. | Bethlehem | 2.7% | 1.9%(+0.790)#47 | 3.5%(-0.813)#7,352 |
| 48. | Delbarton | 2.7% | 1.9%(+0.764)#48 | 3.5%(-0.840)#7,421 |
| 49. | Carpendale | 2.7% | 1.9%(+0.737)#49 | 3.5%(-0.867)#7,493 |
| 50. | Cheat Lake | 2.6% | 1.9%(+0.708)#50 | 3.5%(-0.896)#7,573 |
| 51. | Lubeck | 2.6% | 1.9%(+0.663)#51 | 3.5%(-0.941)#7,679 |
| 52. | Burnsville | 2.6% | 1.9%(+0.643)#52 | 3.5%(-0.960)#7,742 |
| 53. | Bayard | 2.6% | 1.9%(+0.643)#53 | 3.5%(-0.960)#7,747 |
| 54. | Rivesville | 2.6% | 1.9%(+0.636)#54 | 3.5%(-0.968)#7,771 |
| 55. | Follansbee | 2.6% | 1.9%(+0.635)#55 | 3.5%(-0.969)#7,777 |
| 56. | Summersville | 2.5% | 1.9%(+0.602)#56 | 3.5%(-1.00)#7,868 |
| 57. | Marlinton | 2.5% | 1.9%(+0.558)#57 | 3.5%(-1.05)#7,997 |
| 58. | Teays Valley | 2.5% | 1.9%(+0.552)#58 | 3.5%(-1.05)#8,017 |
| 59. | St Albans | 2.5% | 1.9%(+0.531)#59 | 3.5%(-1.07)#8,094 |
| 60. | Sutton | 2.4% | 1.9%(+0.518)#60 | 3.5%(-1.09)#8,136 |
| 61. | Martinsburg | 2.4% | 1.9%(+0.488)#61 | 3.5%(-1.12)#8,230 |
| 62. | Reedsville | 2.4% | 1.9%(+0.438)#62 | 3.5%(-1.17)#8,391 |
| 63. | Ridgeley | 2.3% | 1.9%(+0.418)#63 | 3.5%(-1.19)#8,474 |
| 64. | Falling Waters | 2.3% | 1.9%(+0.414)#64 | 3.5%(-1.19)#8,487 |
| 65. | Clearview | 2.3% | 1.9%(+0.412)#65 | 3.5%(-1.19)#8,495 |
| 66. | Ripley | 2.3% | 1.9%(+0.401)#66 | 3.5%(-1.20)#8,548 |
| 67. | Anmoore | 2.3% | 1.9%(+0.383)#67 | 3.5%(-1.22)#8,612 |
| 68. | Belle | 2.3% | 1.9%(+0.372)#68 | 3.5%(-1.23)#8,643 |
| 69. | Blennerhassett | 2.3% | 1.9%(+0.368)#69 | 3.5%(-1.24)#8,652 |
| 70. | Brookhaven | 2.3% | 1.9%(+0.330)#70 | 3.5%(-1.27)#8,779 |
| 71. | New Haven | 2.2% | 1.9%(+0.321)#71 | 3.5%(-1.28)#8,807 |
| 72. | Kenova | 2.2% | 1.9%(+0.301)#72 | 3.5%(-1.30)#8,865 |
| 73. | Harpers Ferry | 2.2% | 1.9%(+0.301)#73 | 3.5%(-1.30)#8,876 |
| 74. | Huttonsville | 2.2% | 1.9%(+0.277)#74 | 3.5%(-1.33)#8,954 |
| 75. | Hartford City | 2.2% | 1.9%(+0.272)#75 | 3.5%(-1.33)#8,967 |
| 76. | Terra Alta | 2.1% | 1.9%(+0.152)#76 | 3.5%(-1.45)#9,402 |
| 77. | Monongah | 2.1% | 1.9%(+0.151)#77 | 3.5%(-1.45)#9,408 |
| 78. | Philippi | 2.0% | 1.9%(+0.111)#78 | 3.5%(-1.49)#9,524 |
| 79. | Barboursville | 2.0% | 1.9%(+0.089)#79 | 3.5%(-1.51)#9,599 |
| 80. | Gassaway | 2.0% | 1.9%(+0.059)#80 | 3.5%(-1.54)#9,713 |
| 81. | Pratt | 1.9% | 1.9%(+0.015)#81 | 3.5%(-1.59)#9,888 |
| 82. | Bancroft | 1.9% | 1.9%(+0.010)#82 | 3.5%(-1.59)#9,919 |
| 83. | Nitro | 1.8% | 1.9%(-0.111)#83 | 3.5%(-1.71)#10,374 |
| 84. | Weirton | 1.8% | 1.9%(-0.122)#84 | 3.5%(-1.73)#10,429 |
| 85. | Inwood | 1.8% | 1.9%(-0.134)#85 | 3.5%(-1.74)#10,479 |
| 86. | Cross Lanes | 1.8% | 1.9%(-0.141)#86 | 3.5%(-1.74)#10,521 |
| 87. | Marmet | 1.8% | 1.9%(-0.154)#87 | 3.5%(-1.76)#10,572 |
| 88. | Ronceverte | 1.7% | 1.9%(-0.224)#88 | 3.5%(-1.83)#10,854 |
| 89. | Hamlin | 1.6% | 1.9%(-0.288)#89 | 3.5%(-1.89)#11,120 |
| 90. | Pea Ridge | 1.6% | 1.9%(-0.301)#90 | 3.5%(-1.90)#11,177 |
| 91. | Madison | 1.5% | 1.9%(-0.448)#91 | 3.5%(-2.05)#11,807 |
| 92. | Buckhannon | 1.5% | 1.9%(-0.463)#92 | 3.5%(-2.07)#11,873 |
| 93. | Nutter Fort | 1.4% | 1.9%(-0.473)#93 | 3.5%(-2.08)#11,910 |
| 94. | Mabscott | 1.4% | 1.9%(-0.534)#94 | 3.5%(-2.14)#12,153 |
| 95. | Vienna | 1.4% | 1.9%(-0.561)#95 | 3.5%(-2.17)#12,275 |
| 96. | White Hall | 1.4% | 1.9%(-0.562)#96 | 3.5%(-2.17)#12,276 |
| 97. | Fairview | 1.3% | 1.9%(-0.605)#97 | 3.5%(-2.21)#12,473 |
| 98. | Despard | 1.3% | 1.9%(-0.626)#98 | 3.5%(-2.23)#12,573 |
| 99. | Wheeling | 1.3% | 1.9%(-0.630)#99 | 3.5%(-2.23)#12,588 |
| 100. | Oak Hill | 1.3% | 1.9%(-0.654)#100 | 3.5%(-2.26)#12,704 |
Common Questions
What are the Top 10 Cities with the Highest Percentage of Population Employed in Computer & Mathematics in West Virginia?
Top 10 Cities with the Highest Percentage of Population Employed in Computer & Mathematics in West Virginia are:
#1
17.5%
#2
13.9%
#3
13.1%
#4
9.6%
#5
8.9%
#6
8.0%
#7
7.6%
#8
6.7%
#9
6.6%
#10
5.8%
What city has the Highest Percentage of Population Employed in Computer & Mathematics in West Virginia?
Hedgesville has the Highest Percentage of Population Employed in Computer & Mathematics in West Virginia with 17.5%.
What is the Percentage of Population Employed in Computer & Mathematics in the State of West Virginia?
Percentage of Population Employed in Computer & Mathematics in West Virginia is 1.9%.
What is the Percentage of Population Employed in Computer & Mathematics in the United States?
Percentage of Population Employed in Computer & Mathematics in the United States is 3.5%.