Cities with the Highest Percentage of Population Employed in Computer & Mathematics in North Carolina
RELATED REPORTS & OPTIONS
Computer & Mathematics
North Carolina
Compare Cities
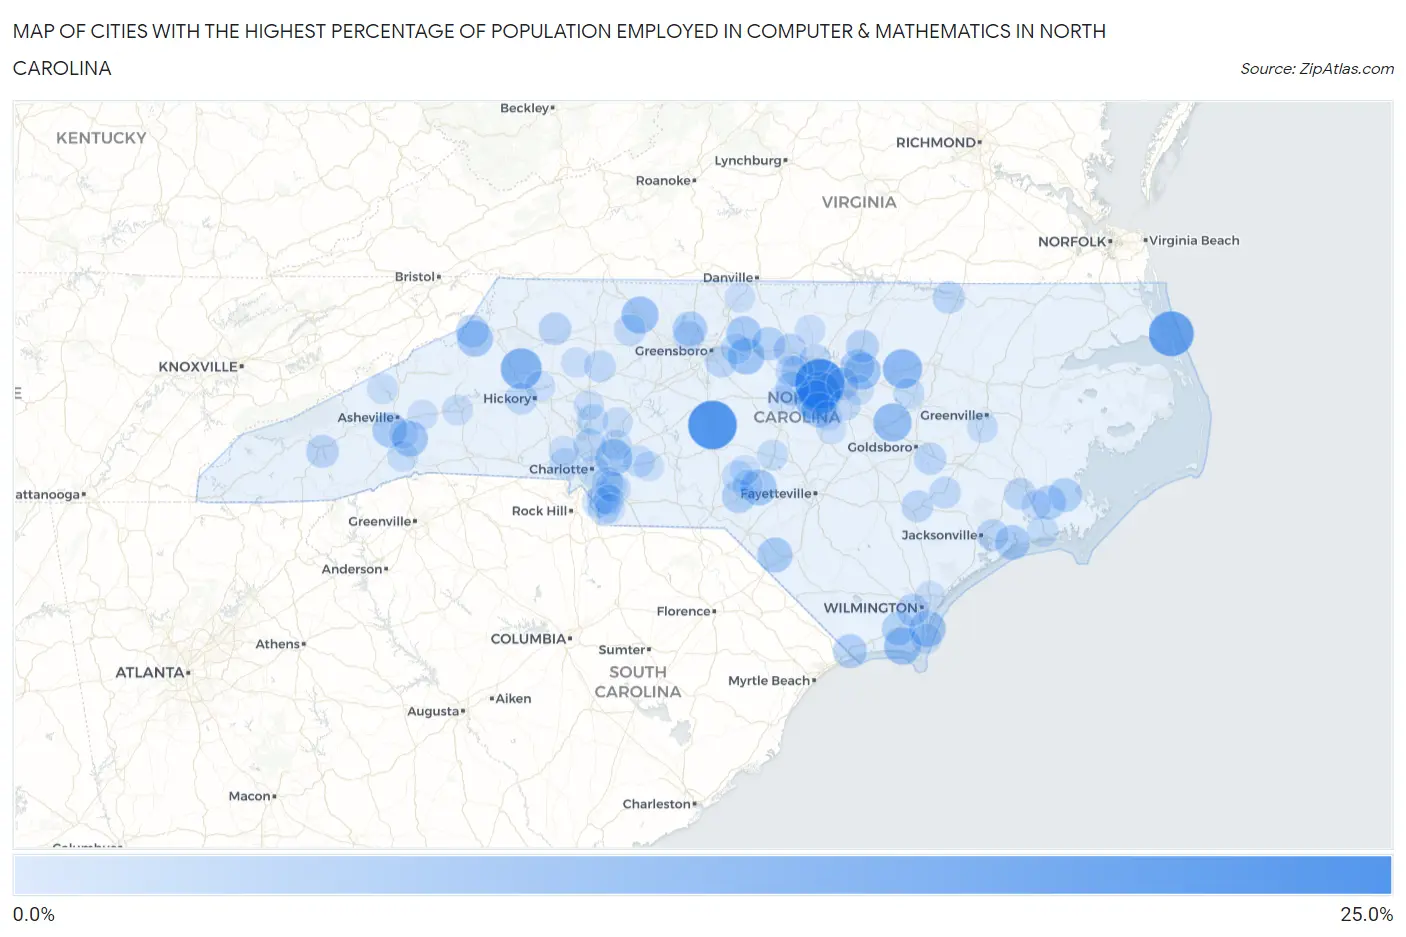
Map of Cities with the Highest Percentage of Population Employed in Computer & Mathematics in North Carolina
0.0%
25.0%
Cities with the Highest Percentage of Population Employed in Computer & Mathematics in North Carolina
| City | % Employed | vs State | vs National | |
| 1. | Morrisville | 22.2% | 3.5%(+18.6)#1 | 3.5%(+18.6)#133 |
| 2. | Seagrove | 21.3% | 3.5%(+17.7)#2 | 3.5%(+17.8)#148 |
| 3. | Duck | 18.0% | 3.5%(+14.4)#3 | 3.5%(+14.4)#209 |
| 4. | Cary | 14.6% | 3.5%(+11.0)#4 | 3.5%(+11.1)#336 |
| 5. | Cedar Rock | 14.1% | 3.5%(+10.5)#5 | 3.5%(+10.5)#364 |
| 6. | Apex | 13.2% | 3.5%(+9.65)#6 | 3.5%(+9.67)#416 |
| 7. | Spring Hope | 12.5% | 3.5%(+8.93)#7 | 3.5%(+8.95)#459 |
| 8. | Micro | 11.6% | 3.5%(+8.05)#8 | 3.5%(+8.08)#532 |
| 9. | St James | 10.5% | 3.5%(+6.95)#9 | 3.5%(+6.97)#655 |
| 10. | Pinnacle | 10.4% | 3.5%(+6.89)#10 | 3.5%(+6.91)#666 |
| 11. | Harrisburg | 10.2% | 3.5%(+6.64)#11 | 3.5%(+6.66)#702 |
| 12. | Sea Breeze | 10.0% | 3.5%(+6.48)#12 | 3.5%(+6.51)#727 |
| 13. | Alamance | 9.8% | 3.5%(+6.29)#13 | 3.5%(+6.32)#759 |
| 14. | Rolesville | 9.8% | 3.5%(+6.25)#14 | 3.5%(+6.28)#771 |
| 15. | Ashley Heights | 9.5% | 3.5%(+5.92)#15 | 3.5%(+5.94)#842 |
| 16. | Banner Elk | 9.4% | 3.5%(+5.89)#16 | 3.5%(+5.91)#849 |
| 17. | Hoopers Creek | 9.3% | 3.5%(+5.76)#17 | 3.5%(+5.78)#873 |
| 18. | Briar Chapel | 9.2% | 3.5%(+5.65)#18 | 3.5%(+5.67)#894 |
| 19. | Altamahaw | 8.8% | 3.5%(+5.22)#19 | 3.5%(+5.24)#988 |
| 20. | Bent Creek | 8.7% | 3.5%(+5.19)#20 | 3.5%(+5.22)#996 |
| 21. | Holly Springs | 8.7% | 3.5%(+5.12)#21 | 3.5%(+5.14)#1,015 |
| 22. | Elrod | 8.6% | 3.5%(+5.09)#22 | 3.5%(+5.12)#1,024 |
| 23. | Swansboro | 8.5% | 3.5%(+4.92)#23 | 3.5%(+4.94)#1,066 |
| 24. | Stokesdale | 8.2% | 3.5%(+4.68)#24 | 3.5%(+4.70)#1,138 |
| 25. | Fearrington Village | 7.7% | 3.5%(+4.20)#25 | 3.5%(+4.22)#1,315 |
| 26. | Carolina Shores | 7.7% | 3.5%(+4.16)#26 | 3.5%(+4.18)#1,329 |
| 27. | Minnesott Beach | 7.7% | 3.5%(+4.15)#27 | 3.5%(+4.17)#1,334 |
| 28. | Wake Forest | 7.7% | 3.5%(+4.14)#28 | 3.5%(+4.16)#1,343 |
| 29. | Oriental | 7.6% | 3.5%(+4.05)#29 | 3.5%(+4.07)#1,371 |
| 30. | Bolivia | 7.6% | 3.5%(+4.03)#30 | 3.5%(+4.05)#1,377 |
| 31. | Hoffman | 7.4% | 3.5%(+3.85)#31 | 3.5%(+3.87)#1,439 |
| 32. | Woodlawn | 7.3% | 3.5%(+3.73)#32 | 3.5%(+3.75)#1,481 |
| 33. | Franklinton | 6.9% | 3.5%(+3.38)#33 | 3.5%(+3.40)#1,634 |
| 34. | Beech Mountain | 6.9% | 3.5%(+3.33)#34 | 3.5%(+3.35)#1,663 |
| 35. | Governors | 6.8% | 3.5%(+3.24)#35 | 3.5%(+3.26)#1,713 |
| 36. | Hillsborough | 6.7% | 3.5%(+3.20)#36 | 3.5%(+3.22)#1,735 |
| 37. | Webster | 6.7% | 3.5%(+3.17)#37 | 3.5%(+3.19)#1,752 |
| 38. | Emma | 6.7% | 3.5%(+3.12)#38 | 3.5%(+3.14)#1,769 |
| 39. | Mulberry | 6.6% | 3.5%(+3.10)#39 | 3.5%(+3.12)#1,788 |
| 40. | Weddington | 6.6% | 3.5%(+3.06)#40 | 3.5%(+3.08)#1,810 |
| 41. | Belville | 6.5% | 3.5%(+2.99)#41 | 3.5%(+3.01)#1,853 |
| 42. | Forest Oaks | 6.4% | 3.5%(+2.83)#42 | 3.5%(+2.86)#1,923 |
| 43. | South Rosemary | 6.3% | 3.5%(+2.77)#43 | 3.5%(+2.79)#1,959 |
| 44. | Walnut Creek | 6.3% | 3.5%(+2.72)#44 | 3.5%(+2.74)#1,984 |
| 45. | Raleigh | 6.2% | 3.5%(+2.69)#45 | 3.5%(+2.71)#2,003 |
| 46. | Huntersville | 6.2% | 3.5%(+2.68)#46 | 3.5%(+2.70)#2,010 |
| 47. | Brices Creek | 6.0% | 3.5%(+2.44)#47 | 3.5%(+2.46)#2,179 |
| 48. | Chapel Hill | 6.0% | 3.5%(+2.41)#48 | 3.5%(+2.43)#2,200 |
| 49. | Kenansville | 5.9% | 3.5%(+2.40)#49 | 3.5%(+2.42)#2,211 |
| 50. | Durham | 5.9% | 3.5%(+2.35)#50 | 3.5%(+2.37)#2,246 |
| 51. | Piney Green | 5.9% | 3.5%(+2.34)#51 | 3.5%(+2.36)#2,249 |
| 52. | Waxhaw | 5.8% | 3.5%(+2.28)#52 | 3.5%(+2.30)#2,297 |
| 53. | Icard | 5.8% | 3.5%(+2.24)#53 | 3.5%(+2.26)#2,323 |
| 54. | East Bend | 5.8% | 3.5%(+2.21)#54 | 3.5%(+2.23)#2,345 |
| 55. | Carrboro | 5.7% | 3.5%(+2.12)#55 | 3.5%(+2.15)#2,426 |
| 56. | Harmony | 5.7% | 3.5%(+2.11)#56 | 3.5%(+2.14)#2,432 |
| 57. | Pink Hill | 5.6% | 3.5%(+2.08)#57 | 3.5%(+2.10)#2,469 |
| 58. | Garner | 5.6% | 3.5%(+2.06)#58 | 3.5%(+2.08)#2,478 |
| 59. | Newport | 5.5% | 3.5%(+2.00)#59 | 3.5%(+2.02)#2,535 |
| 60. | Foxfire | 5.5% | 3.5%(+1.98)#60 | 3.5%(+2.00)#2,550 |
| 61. | Charlotte | 5.5% | 3.5%(+1.95)#61 | 3.5%(+1.97)#2,573 |
| 62. | Sims | 5.5% | 3.5%(+1.95)#62 | 3.5%(+1.97)#2,575 |
| 63. | Lake Park | 5.5% | 3.5%(+1.93)#63 | 3.5%(+1.95)#2,588 |
| 64. | Locust | 5.5% | 3.5%(+1.92)#64 | 3.5%(+1.94)#2,601 |
| 65. | Mooresville | 5.4% | 3.5%(+1.86)#65 | 3.5%(+1.88)#2,664 |
| 66. | Matthews | 5.4% | 3.5%(+1.83)#66 | 3.5%(+1.85)#2,697 |
| 67. | Oak Ridge | 5.3% | 3.5%(+1.76)#67 | 3.5%(+1.78)#2,767 |
| 68. | Mcadenville | 5.3% | 3.5%(+1.74)#68 | 3.5%(+1.76)#2,792 |
| 69. | Nebo | 5.2% | 3.5%(+1.66)#69 | 3.5%(+1.69)#2,848 |
| 70. | Whitsett | 5.2% | 3.5%(+1.64)#70 | 3.5%(+1.66)#2,880 |
| 71. | Marvin | 5.2% | 3.5%(+1.60)#71 | 3.5%(+1.63)#2,918 |
| 72. | Cameron | 5.1% | 3.5%(+1.55)#72 | 3.5%(+1.57)#2,971 |
| 73. | Laurel Park | 5.0% | 3.5%(+1.50)#73 | 3.5%(+1.52)#3,035 |
| 74. | Concord | 5.0% | 3.5%(+1.47)#74 | 3.5%(+1.50)#3,065 |
| 75. | Winterville | 5.0% | 3.5%(+1.45)#75 | 3.5%(+1.47)#3,101 |
| 76. | West Marion | 4.9% | 3.5%(+1.34)#76 | 3.5%(+1.36)#3,220 |
| 77. | Marshall | 4.9% | 3.5%(+1.33)#77 | 3.5%(+1.35)#3,232 |
| 78. | Stallings | 4.8% | 3.5%(+1.28)#78 | 3.5%(+1.30)#3,295 |
| 79. | Wesley Chapel | 4.7% | 3.5%(+1.16)#79 | 3.5%(+1.18)#3,441 |
| 80. | Landis | 4.7% | 3.5%(+1.15)#80 | 3.5%(+1.17)#3,448 |
| 81. | Angier | 4.7% | 3.5%(+1.11)#81 | 3.5%(+1.14)#3,495 |
| 82. | Love Valley | 4.7% | 3.5%(+1.10)#82 | 3.5%(+1.13)#3,515 |
| 83. | Stanley | 4.6% | 3.5%(+1.09)#83 | 3.5%(+1.12)#3,519 |
| 84. | Rougemont | 4.6% | 3.5%(+1.04)#84 | 3.5%(+1.06)#3,571 |
| 85. | Cape Colony | 4.6% | 3.5%(+1.04)#85 | 3.5%(+1.06)#3,580 |
| 86. | Ruffin | 4.5% | 3.5%(+0.998)#86 | 3.5%(+1.02)#3,621 |
| 87. | Black Mountain | 4.5% | 3.5%(+0.982)#87 | 3.5%(+1.00)#3,651 |
| 88. | Kure Beach | 4.5% | 3.5%(+0.976)#88 | 3.5%(+0.999)#3,655 |
| 89. | Knightdale | 4.5% | 3.5%(+0.975)#89 | 3.5%(+0.997)#3,658 |
| 90. | Northchase | 4.5% | 3.5%(+0.939)#90 | 3.5%(+0.962)#3,694 |
| 91. | Neuse Forest | 4.5% | 3.5%(+0.916)#91 | 3.5%(+0.938)#3,727 |
| 92. | Pinebluff | 4.4% | 3.5%(+0.894)#92 | 3.5%(+0.917)#3,749 |
| 93. | Troutman | 4.4% | 3.5%(+0.882)#93 | 3.5%(+0.905)#3,764 |
| 94. | Fuquay Varina | 4.4% | 3.5%(+0.864)#94 | 3.5%(+0.887)#3,796 |
| 95. | Bethlehem | 4.4% | 3.5%(+0.864)#95 | 3.5%(+0.886)#3,797 |
| 96. | Oakboro | 4.4% | 3.5%(+0.847)#96 | 3.5%(+0.869)#3,834 |
| 97. | Taylortown | 4.3% | 3.5%(+0.801)#97 | 3.5%(+0.823)#3,895 |
| 98. | Mineral Springs | 4.3% | 3.5%(+0.754)#98 | 3.5%(+0.777)#3,980 |
| 99. | Pittsboro | 4.3% | 3.5%(+0.729)#99 | 3.5%(+0.752)#4,009 |
| 100. | Royal Pines | 4.2% | 3.5%(+0.680)#100 | 3.5%(+0.703)#4,085 |
Common Questions
What are the Top 10 Cities with the Highest Percentage of Population Employed in Computer & Mathematics in North Carolina?
Top 10 Cities with the Highest Percentage of Population Employed in Computer & Mathematics in North Carolina are:
#1
22.2%
#2
21.3%
#3
18.0%
#4
14.6%
#5
14.1%
#6
13.2%
#7
12.5%
#8
11.6%
#9
10.5%
#10
10.4%
What city has the Highest Percentage of Population Employed in Computer & Mathematics in North Carolina?
Morrisville has the Highest Percentage of Population Employed in Computer & Mathematics in North Carolina with 22.2%.
What is the Percentage of Population Employed in Computer & Mathematics in the State of North Carolina?
Percentage of Population Employed in Computer & Mathematics in North Carolina is 3.5%.
What is the Percentage of Population Employed in Computer & Mathematics in the United States?
Percentage of Population Employed in Computer & Mathematics in the United States is 3.5%.