Cities with the Highest Percentage of Population Employed in Computer & Mathematics in Colorado
RELATED REPORTS & OPTIONS
Computer & Mathematics
Colorado
Compare Cities
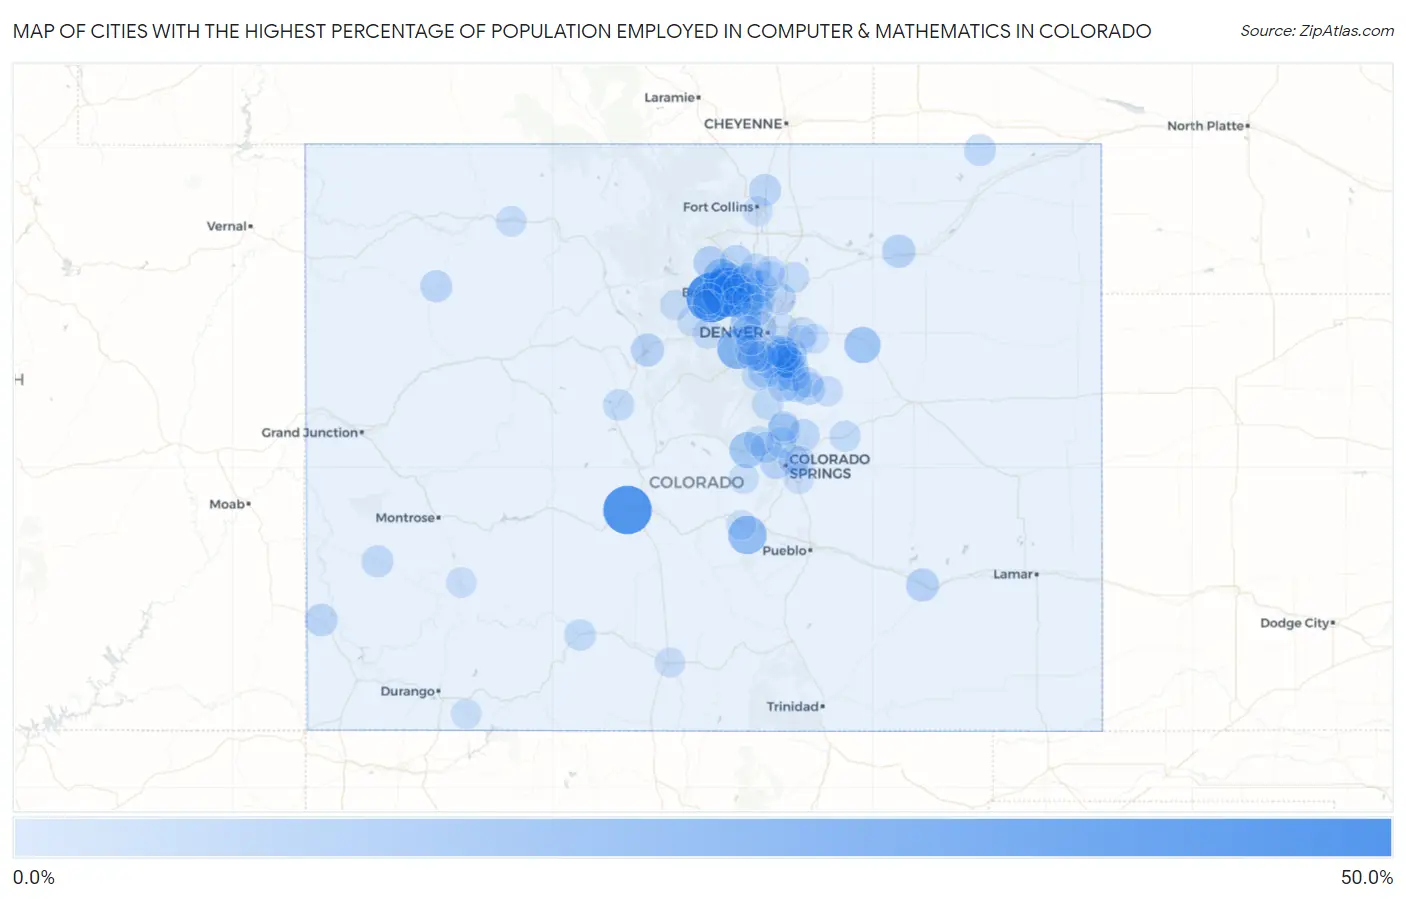
Map of Cities with the Highest Percentage of Population Employed in Computer & Mathematics in Colorado
0.0%
50.0%
Cities with the Highest Percentage of Population Employed in Computer & Mathematics in Colorado
| City | % Employed | vs State | vs National | |
| 1. | Bonanza Mountain Estates | 40.6% | 4.8%(+35.8)#1 | 3.5%(+37.1)#35 |
| 2. | Tall Timber | 39.4% | 4.8%(+34.7)#2 | 3.5%(+35.9)#37 |
| 3. | Maysville | 38.6% | 4.8%(+33.9)#3 | 3.5%(+35.1)#40 |
| 4. | Indian Hills | 23.5% | 4.8%(+18.7)#4 | 3.5%(+20.0)#115 |
| 5. | Rockvale | 19.6% | 4.8%(+14.9)#5 | 3.5%(+16.1)#173 |
| 6. | Lazy Acres | 17.3% | 4.8%(+12.5)#6 | 3.5%(+13.7)#228 |
| 7. | Upper Witter Gulch | 17.2% | 4.8%(+12.4)#7 | 3.5%(+13.7)#231 |
| 8. | Sierra Ridge | 16.2% | 4.8%(+11.5)#8 | 3.5%(+12.7)#258 |
| 9. | Peoria | 15.6% | 4.8%(+10.9)#9 | 3.5%(+12.1)#287 |
| 10. | Divide | 15.0% | 4.8%(+10.3)#10 | 3.5%(+11.5)#313 |
| 11. | Gunbarrel | 13.5% | 4.8%(+8.79)#11 | 3.5%(+10.0)#390 |
| 12. | Jamestown | 13.4% | 4.8%(+8.61)#12 | 3.5%(+9.84)#402 |
| 13. | Superior | 11.3% | 4.8%(+6.54)#13 | 3.5%(+7.77)#558 |
| 14. | Franktown | 10.9% | 4.8%(+6.14)#14 | 3.5%(+7.37)#606 |
| 15. | Foxfield | 10.8% | 4.8%(+6.09)#15 | 3.5%(+7.32)#613 |
| 16. | Inverness | 10.7% | 4.8%(+5.94)#16 | 3.5%(+7.17)#629 |
| 17. | Sterling Ranch | 10.2% | 4.8%(+5.49)#17 | 3.5%(+6.72)#690 |
| 18. | Morgan Heights | 10.0% | 4.8%(+5.24)#18 | 3.5%(+6.48)#733 |
| 19. | Dillon | 9.9% | 4.8%(+5.10)#19 | 3.5%(+6.33)#756 |
| 20. | Louviers | 9.7% | 4.8%(+4.97)#20 | 3.5%(+6.20)#786 |
| 21. | Lone Tree | 9.7% | 4.8%(+4.96)#21 | 3.5%(+6.19)#788 |
| 22. | Allenspark | 9.7% | 4.8%(+4.95)#22 | 3.5%(+6.18)#790 |
| 23. | Swink | 9.7% | 4.8%(+4.93)#23 | 3.5%(+6.16)#793 |
| 24. | Meridian | 9.4% | 4.8%(+4.65)#24 | 3.5%(+5.88)#856 |
| 25. | Mountain View | 9.3% | 4.8%(+4.52)#25 | 3.5%(+5.75)#879 |
| 26. | Manitou Springs | 9.2% | 4.8%(+4.49)#26 | 3.5%(+5.72)#886 |
| 27. | Elizabeth | 9.1% | 4.8%(+4.32)#27 | 3.5%(+5.55)#926 |
| 28. | Lyons | 9.1% | 4.8%(+4.32)#28 | 3.5%(+5.55)#927 |
| 29. | Lafayette | 9.1% | 4.8%(+4.30)#29 | 3.5%(+5.53)#930 |
| 30. | Dove Creek | 9.0% | 4.8%(+4.21)#30 | 3.5%(+5.45)#945 |
| 31. | Grand View Estates | 8.8% | 4.8%(+4.09)#31 | 3.5%(+5.32)#968 |
| 32. | Monument | 8.8% | 4.8%(+4.09)#32 | 3.5%(+5.32)#970 |
| 33. | Stepping Stone | 8.7% | 4.8%(+3.98)#33 | 3.5%(+5.21)#1,000 |
| 34. | Broomfield | 8.7% | 4.8%(+3.97)#34 | 3.5%(+5.20)#1,003 |
| 35. | Pine Brook Hill | 8.7% | 4.8%(+3.91)#35 | 3.5%(+5.14)#1,017 |
| 36. | Cherry Creek | 8.6% | 4.8%(+3.82)#36 | 3.5%(+5.06)#1,041 |
| 37. | The Pinery | 8.4% | 4.8%(+3.65)#37 | 3.5%(+4.88)#1,089 |
| 38. | Parker | 8.2% | 4.8%(+3.46)#38 | 3.5%(+4.69)#1,142 |
| 39. | Castle Pines | 8.0% | 4.8%(+3.24)#39 | 3.5%(+4.47)#1,220 |
| 40. | Todd Creek | 8.0% | 4.8%(+3.23)#40 | 3.5%(+4.46)#1,227 |
| 41. | Wellington | 8.0% | 4.8%(+3.20)#41 | 3.5%(+4.43)#1,244 |
| 42. | Meeker | 7.9% | 4.8%(+3.15)#42 | 3.5%(+4.38)#1,260 |
| 43. | Peetz | 7.8% | 4.8%(+3.06)#43 | 3.5%(+4.29)#1,294 |
| 44. | Erie | 7.7% | 4.8%(+2.96)#44 | 3.5%(+4.19)#1,324 |
| 45. | Highlands Ranch | 7.7% | 4.8%(+2.90)#45 | 3.5%(+4.13)#1,352 |
| 46. | Redvale | 7.6% | 4.8%(+2.85)#46 | 3.5%(+4.08)#1,368 |
| 47. | Black Forest | 7.6% | 4.8%(+2.84)#47 | 3.5%(+4.07)#1,370 |
| 48. | Stonegate | 7.6% | 4.8%(+2.81)#48 | 3.5%(+4.04)#1,380 |
| 49. | Niwot | 7.5% | 4.8%(+2.78)#49 | 3.5%(+4.02)#1,393 |
| 50. | Boulder | 7.4% | 4.8%(+2.69)#50 | 3.5%(+3.92)#1,420 |
| 51. | Greenwood Village | 7.4% | 4.8%(+2.61)#51 | 3.5%(+3.84)#1,449 |
| 52. | South Fork | 7.3% | 4.8%(+2.52)#52 | 3.5%(+3.75)#1,485 |
| 53. | Perry Park | 7.2% | 4.8%(+2.46)#53 | 3.5%(+3.69)#1,506 |
| 54. | Roxborough Park | 7.1% | 4.8%(+2.39)#54 | 3.5%(+3.62)#1,541 |
| 55. | Nederland | 7.0% | 4.8%(+2.28)#55 | 3.5%(+3.51)#1,580 |
| 56. | Centennial | 7.0% | 4.8%(+2.24)#56 | 3.5%(+3.47)#1,598 |
| 57. | Louisville | 6.9% | 4.8%(+2.16)#57 | 3.5%(+3.39)#1,645 |
| 58. | Castle Rock | 6.9% | 4.8%(+2.12)#58 | 3.5%(+3.35)#1,662 |
| 59. | Fairmount | 6.8% | 4.8%(+2.08)#59 | 3.5%(+3.31)#1,693 |
| 60. | Leadville | 6.8% | 4.8%(+2.03)#60 | 3.5%(+3.26)#1,718 |
| 61. | Calhan | 6.7% | 4.8%(+1.95)#61 | 3.5%(+3.18)#1,756 |
| 62. | Cascade Chipita Park | 6.6% | 4.8%(+1.86)#62 | 3.5%(+3.09)#1,801 |
| 63. | Longmont | 6.6% | 4.8%(+1.85)#63 | 3.5%(+3.08)#1,811 |
| 64. | Air Force Academy | 6.4% | 4.8%(+1.60)#64 | 3.5%(+2.83)#1,940 |
| 65. | Arvada | 6.3% | 4.8%(+1.53)#65 | 3.5%(+2.76)#1,976 |
| 66. | Westminster | 6.2% | 4.8%(+1.45)#66 | 3.5%(+2.68)#2,023 |
| 67. | Columbine | 6.2% | 4.8%(+1.43)#67 | 3.5%(+2.66)#2,045 |
| 68. | Woodmoor | 6.1% | 4.8%(+1.37)#68 | 3.5%(+2.60)#2,087 |
| 69. | Aristocrat Ranchettes | 6.1% | 4.8%(+1.34)#69 | 3.5%(+2.57)#2,100 |
| 70. | Aetna Estates | 5.9% | 4.8%(+1.17)#70 | 3.5%(+2.40)#2,226 |
| 71. | Dove Valley | 5.9% | 4.8%(+1.12)#71 | 3.5%(+2.35)#2,263 |
| 72. | Colorado Springs | 5.8% | 4.8%(+1.04)#72 | 3.5%(+2.27)#2,316 |
| 73. | Eldorado Springs | 5.7% | 4.8%(+0.935)#73 | 3.5%(+2.17)#2,406 |
| 74. | Ponderosa Park | 5.7% | 4.8%(+0.932)#74 | 3.5%(+2.16)#2,410 |
| 75. | Dakota Ridge | 5.7% | 4.8%(+0.930)#75 | 3.5%(+2.16)#2,413 |
| 76. | Applewood | 5.6% | 4.8%(+0.889)#76 | 3.5%(+2.12)#2,448 |
| 77. | Hayden | 5.5% | 4.8%(+0.728)#77 | 3.5%(+1.96)#2,584 |
| 78. | Littleton | 5.4% | 4.8%(+0.674)#78 | 3.5%(+1.90)#2,632 |
| 79. | Denver | 5.3% | 4.8%(+0.564)#79 | 3.5%(+1.80)#2,755 |
| 80. | Kiowa | 5.3% | 4.8%(+0.560)#80 | 3.5%(+1.79)#2,761 |
| 81. | St Mary S | 5.3% | 4.8%(+0.554)#81 | 3.5%(+1.79)#2,766 |
| 82. | Fort Collins | 5.2% | 4.8%(+0.431)#82 | 3.5%(+1.66)#2,878 |
| 83. | Cimarron Hills | 5.2% | 4.8%(+0.415)#83 | 3.5%(+1.65)#2,893 |
| 84. | Ouray | 5.1% | 4.8%(+0.387)#84 | 3.5%(+1.62)#2,928 |
| 85. | Frederick | 5.1% | 4.8%(+0.343)#85 | 3.5%(+1.57)#2,970 |
| 86. | Woodland Park | 5.1% | 4.8%(+0.335)#86 | 3.5%(+1.57)#2,978 |
| 87. | Firestone | 5.1% | 4.8%(+0.325)#87 | 3.5%(+1.56)#2,993 |
| 88. | Security Widefield | 5.1% | 4.8%(+0.323)#88 | 3.5%(+1.55)#2,997 |
| 89. | Park Center | 5.1% | 4.8%(+0.312)#89 | 3.5%(+1.54)#3,010 |
| 90. | Ignacio | 5.0% | 4.8%(+0.285)#90 | 3.5%(+1.52)#3,042 |
| 91. | Watkins | 5.0% | 4.8%(+0.275)#91 | 3.5%(+1.51)#3,058 |
| 92. | Idaho Springs | 5.0% | 4.8%(+0.244)#92 | 3.5%(+1.48)#3,086 |
| 93. | Rollinsville | 5.0% | 4.8%(+0.244)#93 | 3.5%(+1.48)#3,092 |
| 94. | Alamosa East | 5.0% | 4.8%(+0.232)#94 | 3.5%(+1.46)#3,113 |
| 95. | Fraser | 4.9% | 4.8%(+0.156)#95 | 3.5%(+1.39)#3,190 |
| 96. | Cripple Creek | 4.9% | 4.8%(+0.144)#96 | 3.5%(+1.37)#3,202 |
| 97. | Ken Caryl | 4.8% | 4.8%(+0.083)#97 | 3.5%(+1.31)#3,277 |
| 98. | Lakewood | 4.8% | 4.8%(+0.001)#98 | 3.5%(+1.23)#3,371 |
| 99. | Aurora | 4.7% | 4.8%(-0.060)#99 | 3.5%(+1.17)#3,447 |
| 100. | Lincoln Park | 4.6% | 4.8%(-0.179)#100 | 3.5%(+1.05)#3,587 |
Common Questions
What are the Top 10 Cities with the Highest Percentage of Population Employed in Computer & Mathematics in Colorado?
Top 10 Cities with the Highest Percentage of Population Employed in Computer & Mathematics in Colorado are:
#1
40.6%
#2
39.4%
#3
38.6%
#4
23.5%
#5
19.6%
#6
17.3%
#7
15.6%
#8
15.0%
#9
13.5%
#10
13.4%
What city has the Highest Percentage of Population Employed in Computer & Mathematics in Colorado?
Bonanza Mountain Estates has the Highest Percentage of Population Employed in Computer & Mathematics in Colorado with 40.6%.
What is the Percentage of Population Employed in Computer & Mathematics in the State of Colorado?
Percentage of Population Employed in Computer & Mathematics in Colorado is 4.8%.
What is the Percentage of Population Employed in Computer & Mathematics in the United States?
Percentage of Population Employed in Computer & Mathematics in the United States is 3.5%.