Cities with the Highest Percentage of Population Employed in Computer & Mathematics in Missouri
RELATED REPORTS & OPTIONS
Computer & Mathematics
Missouri
Compare Cities
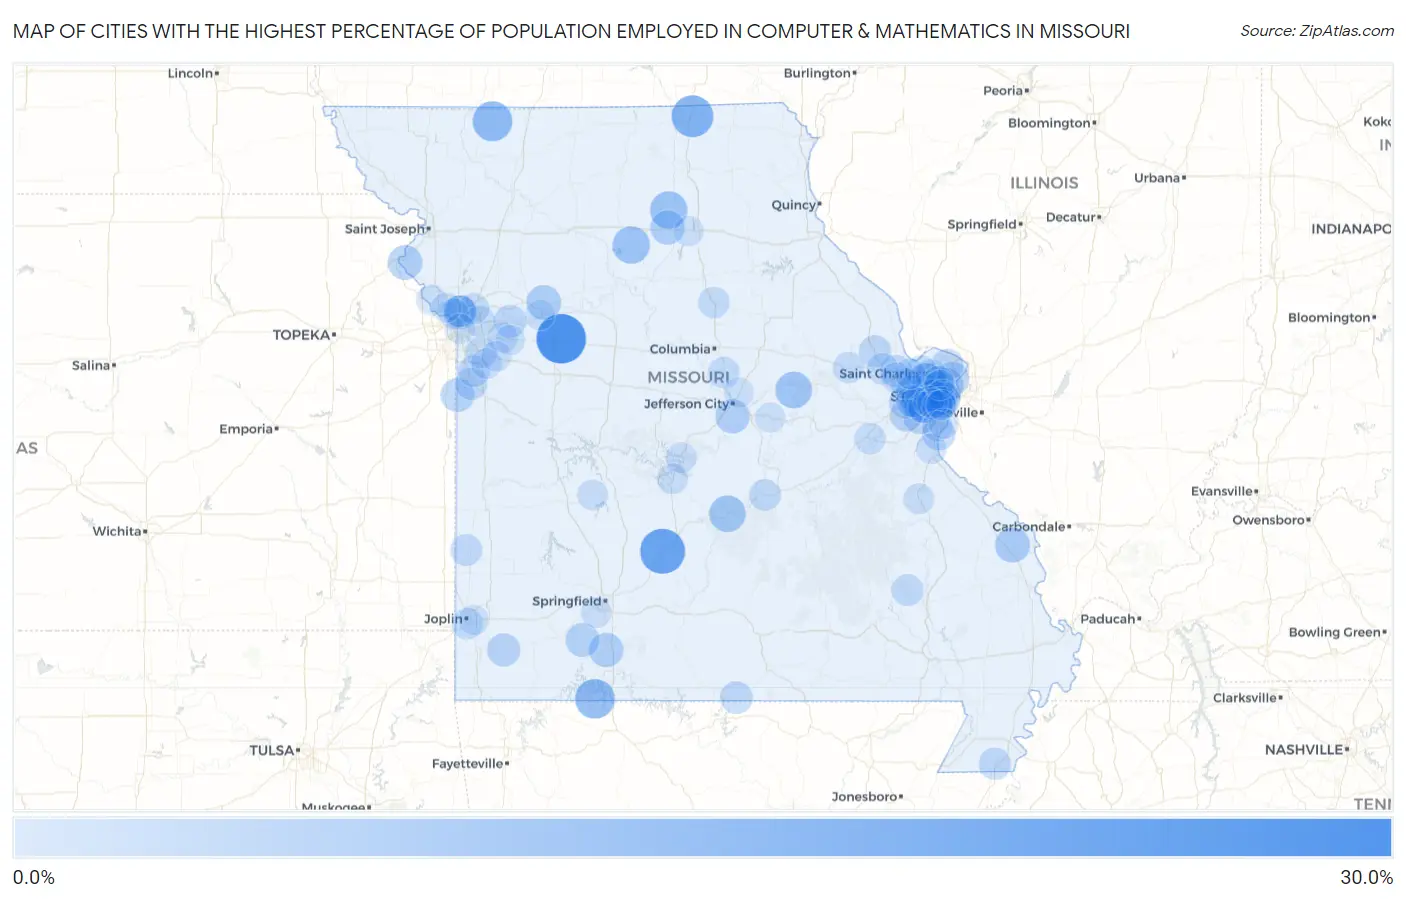
Map of Cities with the Highest Percentage of Population Employed in Computer & Mathematics in Missouri
0.0%
30.0%
Cities with the Highest Percentage of Population Employed in Computer & Mathematics in Missouri
| City | % Employed | vs State | vs National | |
| 1. | Aullville | 27.5% | 3.2%(+24.3)#1 | 3.5%(+23.9)#87 |
| 2. | Phillipsburg | 22.1% | 3.2%(+18.9)#2 | 3.5%(+18.6)#136 |
| 3. | New Market | 20.4% | 3.2%(+17.2)#3 | 3.5%(+16.9)#163 |
| 4. | Lancaster | 17.8% | 3.2%(+14.6)#4 | 3.5%(+14.3)#213 |
| 5. | Allendale | 15.4% | 3.2%(+12.2)#5 | 3.5%(+11.9)#296 |
| 6. | Blue Eye | 15.3% | 3.2%(+12.1)#6 | 3.5%(+11.8)#301 |
| 7. | Maryland Heights | 14.1% | 3.2%(+10.9)#7 | 3.5%(+10.5)#365 |
| 8. | Rothville | 12.5% | 3.2%(+9.31)#8 | 3.5%(+8.98)#457 |
| 9. | Ethel | 12.5% | 3.2%(+9.31)#9 | 3.5%(+8.98)#458 |
| 10. | Briarwood Estates | 12.1% | 3.2%(+8.90)#10 | 3.5%(+8.56)#490 |
| 11. | Morrison | 11.8% | 3.2%(+8.57)#11 | 3.5%(+8.24)#521 |
| 12. | Waynesville | 11.6% | 3.2%(+8.39)#12 | 3.5%(+8.05)#534 |
| 13. | Creve Coeur | 10.7% | 3.2%(+7.50)#13 | 3.5%(+7.17)#630 |
| 14. | Manchester | 10.6% | 3.2%(+7.40)#14 | 3.5%(+7.07)#640 |
| 15. | Medill | 10.3% | 3.2%(+7.11)#15 | 3.5%(+6.78)#681 |
| 16. | Twin Oaks | 9.8% | 3.2%(+6.62)#16 | 3.5%(+6.28)#765 |
| 17. | Chesterfield | 9.8% | 3.2%(+6.61)#17 | 3.5%(+6.28)#766 |
| 18. | Old Appleton | 9.8% | 3.2%(+6.61)#18 | 3.5%(+6.28)#767 |
| 19. | Hardin | 9.5% | 3.2%(+6.26)#19 | 3.5%(+5.93)#845 |
| 20. | Brentwood | 9.4% | 3.2%(+6.18)#20 | 3.5%(+5.84)#860 |
| 21. | Lewis And Clark Village | 9.3% | 3.2%(+6.07)#21 | 3.5%(+5.73)#884 |
| 22. | Spokane | 9.1% | 3.2%(+5.90)#22 | 3.5%(+5.57)#922 |
| 23. | Wardsville | 8.9% | 3.2%(+5.73)#23 | 3.5%(+5.40)#953 |
| 24. | New Cambria | 8.9% | 3.2%(+5.70)#24 | 3.5%(+5.36)#961 |
| 25. | Glen Echo Park | 8.9% | 3.2%(+5.70)#25 | 3.5%(+5.36)#962 |
| 26. | Hurley | 8.5% | 3.2%(+5.26)#26 | 3.5%(+4.93)#1,074 |
| 27. | Crystal Lake Park | 8.4% | 3.2%(+5.23)#27 | 3.5%(+4.90)#1,083 |
| 28. | West Line | 8.3% | 3.2%(+5.14)#28 | 3.5%(+4.81)#1,107 |
| 29. | Moline Acres | 8.2% | 3.2%(+4.97)#29 | 3.5%(+4.64)#1,160 |
| 30. | Olivette | 8.1% | 3.2%(+4.92)#30 | 3.5%(+4.59)#1,175 |
| 31. | Glendale | 8.0% | 3.2%(+4.83)#31 | 3.5%(+4.50)#1,206 |
| 32. | Oakwood | 8.0% | 3.2%(+4.81)#32 | 3.5%(+4.48)#1,216 |
| 33. | Stark City | 7.7% | 3.2%(+4.50)#33 | 3.5%(+4.17)#1,337 |
| 34. | Ballwin | 7.7% | 3.2%(+4.47)#34 | 3.5%(+4.14)#1,349 |
| 35. | Kimmswick | 7.5% | 3.2%(+4.35)#35 | 3.5%(+4.02)#1,391 |
| 36. | Parkdale | 7.5% | 3.2%(+4.31)#36 | 3.5%(+3.98)#1,404 |
| 37. | Maplewood | 7.4% | 3.2%(+4.21)#37 | 3.5%(+3.87)#1,437 |
| 38. | Eureka | 7.3% | 3.2%(+4.14)#38 | 3.5%(+3.81)#1,464 |
| 39. | Rock Hill | 7.3% | 3.2%(+4.13)#39 | 3.5%(+3.80)#1,466 |
| 40. | Frontenac | 7.2% | 3.2%(+3.96)#40 | 3.5%(+3.63)#1,528 |
| 41. | Levasy | 7.0% | 3.2%(+3.78)#41 | 3.5%(+3.45)#1,611 |
| 42. | Bakersfield | 6.9% | 3.2%(+3.70)#42 | 3.5%(+3.37)#1,654 |
| 43. | Oakview | 6.6% | 3.2%(+3.42)#43 | 3.5%(+3.08)#1,809 |
| 44. | Peculiar | 6.6% | 3.2%(+3.37)#44 | 3.5%(+3.04)#1,833 |
| 45. | O Fallon | 6.6% | 3.2%(+3.37)#45 | 3.5%(+3.04)#1,836 |
| 46. | Holland | 6.5% | 3.2%(+3.33)#46 | 3.5%(+3.00)#1,864 |
| 47. | Moscow Mills | 6.5% | 3.2%(+3.29)#47 | 3.5%(+2.96)#1,877 |
| 48. | Old Jamestown | 6.5% | 3.2%(+3.27)#48 | 3.5%(+2.94)#1,888 |
| 49. | Wildwood | 6.4% | 3.2%(+3.24)#49 | 3.5%(+2.91)#1,904 |
| 50. | Ellisville | 6.3% | 3.2%(+3.11)#50 | 3.5%(+2.77)#1,971 |
| 51. | Liberal | 6.1% | 3.2%(+2.89)#51 | 3.5%(+2.56)#2,114 |
| 52. | Des Arc | 6.0% | 3.2%(+2.83)#52 | 3.5%(+2.50)#2,154 |
| 53. | Doolittle | 6.0% | 3.2%(+2.76)#53 | 3.5%(+2.43)#2,203 |
| 54. | Raymore | 5.9% | 3.2%(+2.74)#54 | 3.5%(+2.41)#2,219 |
| 55. | Lee S Summit | 5.9% | 3.2%(+2.74)#55 | 3.5%(+2.41)#2,220 |
| 56. | Valley Park | 5.8% | 3.2%(+2.56)#56 | 3.5%(+2.23)#2,348 |
| 57. | Clark | 5.7% | 3.2%(+2.55)#57 | 3.5%(+2.22)#2,353 |
| 58. | Bridgeton | 5.7% | 3.2%(+2.48)#58 | 3.5%(+2.15)#2,421 |
| 59. | Webster Groves | 5.6% | 3.2%(+2.42)#59 | 3.5%(+2.09)#2,473 |
| 60. | Ashland | 5.6% | 3.2%(+2.39)#60 | 3.5%(+2.06)#2,498 |
| 61. | Wentzville | 5.6% | 3.2%(+2.38)#61 | 3.5%(+2.05)#2,512 |
| 62. | St Charles | 5.6% | 3.2%(+2.36)#62 | 3.5%(+2.03)#2,521 |
| 63. | Shrewsbury | 5.6% | 3.2%(+2.36)#63 | 3.5%(+2.03)#2,522 |
| 64. | Dennis Acres | 5.6% | 3.2%(+2.36)#64 | 3.5%(+2.03)#2,531 |
| 65. | Warrenton | 5.6% | 3.2%(+2.36)#65 | 3.5%(+2.03)#2,532 |
| 66. | Oakwood Park | 5.5% | 3.2%(+2.33)#66 | 3.5%(+2.00)#2,556 |
| 67. | Parkway | 5.5% | 3.2%(+2.26)#67 | 3.5%(+1.93)#2,613 |
| 68. | Sugar Creek | 5.4% | 3.2%(+2.23)#68 | 3.5%(+1.90)#2,639 |
| 69. | Weldon Spring | 5.3% | 3.2%(+2.13)#69 | 3.5%(+1.80)#2,753 |
| 70. | Glenaire | 5.2% | 3.2%(+2.02)#70 | 3.5%(+1.69)#2,849 |
| 71. | Woodson Terrace | 5.0% | 3.2%(+1.82)#71 | 3.5%(+1.48)#3,078 |
| 72. | Richmond Heights | 5.0% | 3.2%(+1.78)#72 | 3.5%(+1.45)#3,121 |
| 73. | Des Peres | 4.8% | 3.2%(+1.63)#73 | 3.5%(+1.30)#3,301 |
| 74. | Wheatland | 4.8% | 3.2%(+1.63)#74 | 3.5%(+1.29)#3,304 |
| 75. | Dardenne Prairie | 4.8% | 3.2%(+1.61)#75 | 3.5%(+1.28)#3,323 |
| 76. | Bonne Terre | 4.8% | 3.2%(+1.59)#76 | 3.5%(+1.26)#3,346 |
| 77. | Grain Valley | 4.8% | 3.2%(+1.57)#77 | 3.5%(+1.23)#3,370 |
| 78. | Linn Creek | 4.7% | 3.2%(+1.53)#78 | 3.5%(+1.20)#3,412 |
| 79. | Lake Ozark | 4.7% | 3.2%(+1.52)#79 | 3.5%(+1.19)#3,422 |
| 80. | Crestwood | 4.7% | 3.2%(+1.52)#80 | 3.5%(+1.19)#3,427 |
| 81. | Kirkwood | 4.7% | 3.2%(+1.50)#81 | 3.5%(+1.17)#3,450 |
| 82. | Greenwood | 4.7% | 3.2%(+1.48)#82 | 3.5%(+1.14)#3,484 |
| 83. | Arnold | 4.7% | 3.2%(+1.46)#83 | 3.5%(+1.13)#3,504 |
| 84. | St Peters | 4.6% | 3.2%(+1.41)#84 | 3.5%(+1.08)#3,557 |
| 85. | Battlefield | 4.6% | 3.2%(+1.36)#85 | 3.5%(+1.03)#3,609 |
| 86. | Lake Lotawana | 4.5% | 3.2%(+1.34)#86 | 3.5%(+1.01)#3,644 |
| 87. | Horine | 4.5% | 3.2%(+1.30)#87 | 3.5%(+0.966)#3,683 |
| 88. | Farley | 4.4% | 3.2%(+1.22)#88 | 3.5%(+0.887)#3,794 |
| 89. | Houston Lake | 4.4% | 3.2%(+1.20)#89 | 3.5%(+0.871)#3,829 |
| 90. | Sycamore Hills | 4.3% | 3.2%(+1.10)#90 | 3.5%(+0.771)#3,990 |
| 91. | Oakville | 4.3% | 3.2%(+1.09)#91 | 3.5%(+0.761)#4,000 |
| 92. | Kansas City | 4.3% | 3.2%(+1.08)#92 | 3.5%(+0.752)#4,008 |
| 93. | Holts Summit | 4.3% | 3.2%(+1.07)#93 | 3.5%(+0.735)#4,036 |
| 94. | Duquesne | 4.2% | 3.2%(+1.05)#94 | 3.5%(+0.718)#4,054 |
| 95. | Bevier | 4.2% | 3.2%(+1.05)#95 | 3.5%(+0.716)#4,056 |
| 96. | Lexington | 4.2% | 3.2%(+1.04)#96 | 3.5%(+0.711)#4,069 |
| 97. | Marlborough | 4.2% | 3.2%(+1.04)#97 | 3.5%(+0.709)#4,071 |
| 98. | Linn | 4.2% | 3.2%(+1.000)#98 | 3.5%(+0.668)#4,135 |
| 99. | Oak Grove | 4.1% | 3.2%(+0.952)#99 | 3.5%(+0.620)#4,236 |
| 100. | Weatherby Lake | 4.1% | 3.2%(+0.950)#100 | 3.5%(+0.618)#4,242 |
Common Questions
What are the Top 10 Cities with the Highest Percentage of Population Employed in Computer & Mathematics in Missouri?
Top 10 Cities with the Highest Percentage of Population Employed in Computer & Mathematics in Missouri are:
#1
27.5%
#2
22.1%
#3
17.8%
#4
15.4%
#5
15.3%
#6
14.1%
#7
12.5%
#8
12.5%
#9
11.8%
#10
11.6%
What city has the Highest Percentage of Population Employed in Computer & Mathematics in Missouri?
Aullville has the Highest Percentage of Population Employed in Computer & Mathematics in Missouri with 27.5%.
What is the Percentage of Population Employed in Computer & Mathematics in the State of Missouri?
Percentage of Population Employed in Computer & Mathematics in Missouri is 3.2%.
What is the Percentage of Population Employed in Computer & Mathematics in the United States?
Percentage of Population Employed in Computer & Mathematics in the United States is 3.5%.