Cities with the Highest Percentage of Population Employed in Computer & Mathematics in Ohio
RELATED REPORTS & OPTIONS
Computer & Mathematics
Ohio
Compare Cities
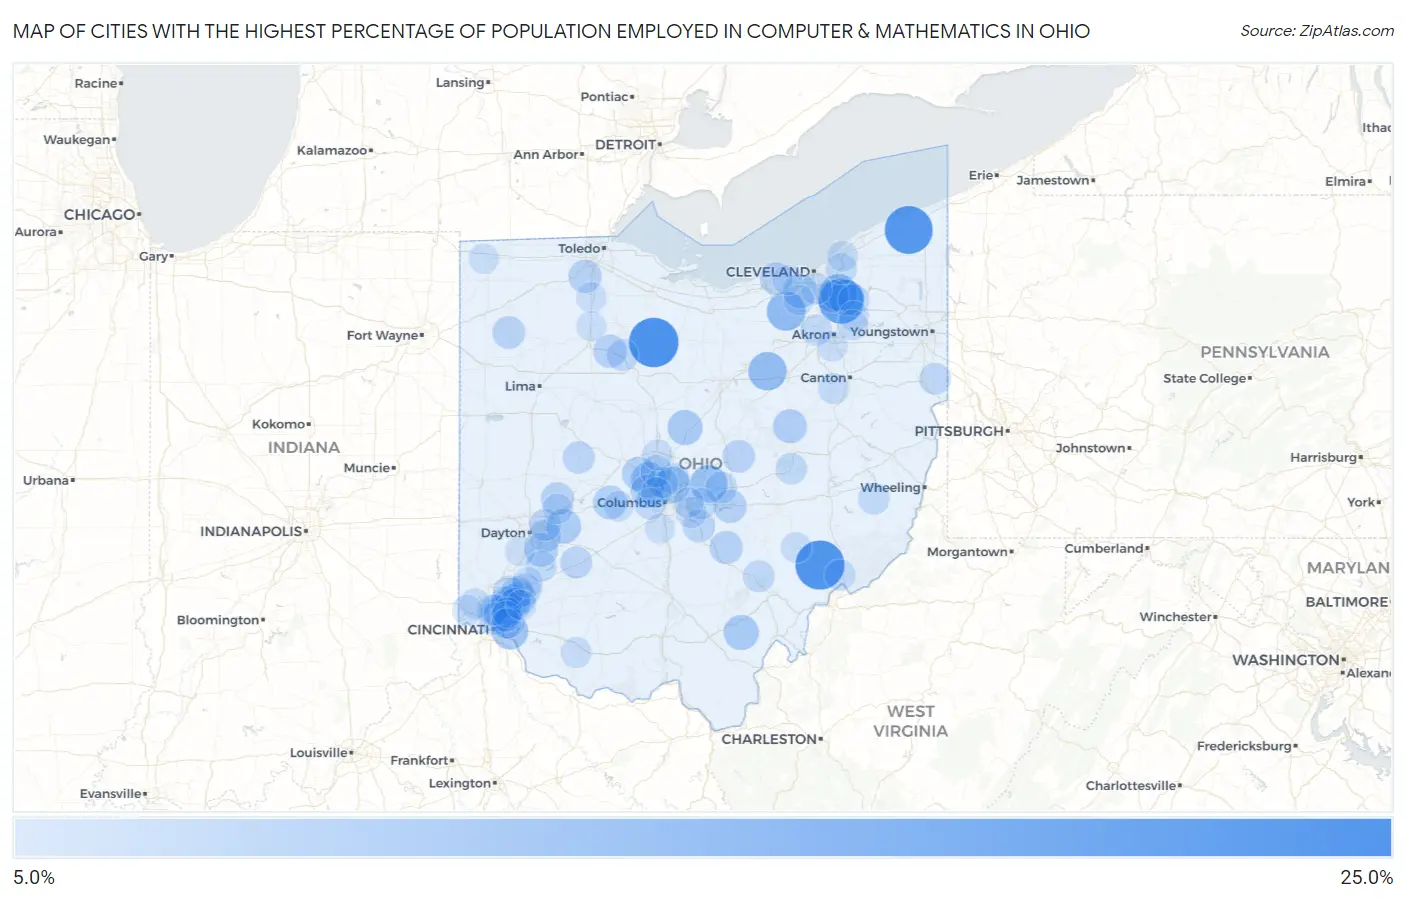
Map of Cities with the Highest Percentage of Population Employed in Computer & Mathematics in Ohio
0.0%
25.0%
Cities with the Highest Percentage of Population Employed in Computer & Mathematics in Ohio
| City | % Employed | vs State | vs National | |
| 1. | Melmore | 22.6% | 3.0%(+19.5)#1 | 3.5%(+19.1)#128 |
| 2. | Waterford | 22.1% | 3.0%(+19.1)#2 | 3.5%(+18.6)#134 |
| 3. | Austinburg | 21.1% | 3.0%(+18.0)#3 | 3.5%(+17.5)#152 |
| 4. | Twinsburg Heights | 18.5% | 3.0%(+15.5)#4 | 3.5%(+15.0)#199 |
| 5. | Brandt | 16.7% | 3.0%(+13.6)#5 | 3.5%(+13.1)#242 |
| 6. | Valley City | 13.0% | 3.0%(+9.95)#6 | 3.5%(+9.45)#435 |
| 7. | New Pittsburg | 12.5% | 3.0%(+9.47)#7 | 3.5%(+8.98)#456 |
| 8. | Gomer | 12.4% | 3.0%(+9.35)#8 | 3.5%(+8.86)#464 |
| 9. | West Logan | 11.9% | 3.0%(+8.92)#9 | 3.5%(+8.43)#501 |
| 10. | Blaine | 11.8% | 3.0%(+8.73)#10 | 3.5%(+8.24)#518 |
| 11. | Alexandria | 11.5% | 3.0%(+8.49)#11 | 3.5%(+8.00)#538 |
| 12. | Glenwillow | 11.3% | 3.0%(+8.24)#12 | 3.5%(+7.75)#563 |
| 13. | Sherwood | 10.7% | 3.0%(+7.70)#13 | 3.5%(+7.21)#623 |
| 14. | Minerva Park | 10.6% | 3.0%(+7.52)#14 | 3.5%(+7.03)#647 |
| 15. | Amberley | 10.1% | 3.0%(+7.08)#15 | 3.5%(+6.59)#714 |
| 16. | Reminderville | 10.1% | 3.0%(+7.08)#16 | 3.5%(+6.59)#715 |
| 17. | Dublin | 10.1% | 3.0%(+7.04)#17 | 3.5%(+6.55)#720 |
| 18. | Wilkesville | 9.6% | 3.0%(+6.62)#18 | 3.5%(+6.12)#803 |
| 19. | Fulton | 9.5% | 3.0%(+6.49)#19 | 3.5%(+6.00)#829 |
| 20. | Blue Ash | 9.5% | 3.0%(+6.48)#20 | 3.5%(+5.99)#833 |
| 21. | Yellow Springs | 9.2% | 3.0%(+6.13)#21 | 3.5%(+5.64)#904 |
| 22. | Middleburg Heights | 8.7% | 3.0%(+5.67)#22 | 3.5%(+5.18)#1,005 |
| 23. | Lake Buckhorn | 8.6% | 3.0%(+5.60)#23 | 3.5%(+5.11)#1,027 |
| 24. | Choctaw Lake | 8.5% | 3.0%(+5.43)#24 | 3.5%(+4.94)#1,067 |
| 25. | New California | 8.4% | 3.0%(+5.33)#25 | 3.5%(+4.84)#1,096 |
| 26. | Bellbrook | 8.3% | 3.0%(+5.23)#26 | 3.5%(+4.74)#1,130 |
| 27. | Woodsdale | 8.1% | 3.0%(+5.07)#27 | 3.5%(+4.58)#1,176 |
| 28. | Hilliard | 8.1% | 3.0%(+5.05)#28 | 3.5%(+4.56)#1,186 |
| 29. | Harbor Hills | 8.0% | 3.0%(+4.98)#29 | 3.5%(+4.49)#1,210 |
| 30. | Vanlue | 8.0% | 3.0%(+4.97)#30 | 3.5%(+4.48)#1,215 |
| 31. | Haskins | 8.0% | 3.0%(+4.95)#31 | 3.5%(+4.46)#1,230 |
| 32. | Hide A Way Hills | 8.0% | 3.0%(+4.95)#32 | 3.5%(+4.45)#1,231 |
| 33. | Highpoint | 7.9% | 3.0%(+4.89)#33 | 3.5%(+4.40)#1,254 |
| 34. | North Hampton | 7.9% | 3.0%(+4.89)#34 | 3.5%(+4.40)#1,255 |
| 35. | Oakwood | 7.6% | 3.0%(+4.59)#35 | 3.5%(+4.10)#1,358 |
| 36. | Northfield | 7.6% | 3.0%(+4.58)#36 | 3.5%(+4.09)#1,365 |
| 37. | Avon | 7.6% | 3.0%(+4.53)#37 | 3.5%(+4.04)#1,381 |
| 38. | Landen | 7.5% | 3.0%(+4.46)#38 | 3.5%(+3.97)#1,408 |
| 39. | Martinsburg | 7.5% | 3.0%(+4.43)#39 | 3.5%(+3.94)#1,416 |
| 40. | South Lebanon | 7.4% | 3.0%(+4.36)#40 | 3.5%(+3.87)#1,438 |
| 41. | Beavercreek | 7.3% | 3.0%(+4.25)#41 | 3.5%(+3.76)#1,479 |
| 42. | Sharonville | 7.1% | 3.0%(+4.10)#42 | 3.5%(+3.61)#1,544 |
| 43. | Mason | 7.1% | 3.0%(+4.07)#43 | 3.5%(+3.58)#1,554 |
| 44. | Sixteen Mile Stand | 7.0% | 3.0%(+4.00)#44 | 3.5%(+3.51)#1,582 |
| 45. | West Liberty | 7.0% | 3.0%(+3.98)#45 | 3.5%(+3.49)#1,590 |
| 46. | Carroll | 7.0% | 3.0%(+3.95)#46 | 3.5%(+3.46)#1,605 |
| 47. | Wright Patterson Afb | 7.0% | 3.0%(+3.95)#47 | 3.5%(+3.46)#1,607 |
| 48. | Madison Place | 7.0% | 3.0%(+3.93)#48 | 3.5%(+3.44)#1,616 |
| 49. | St Bernard | 6.9% | 3.0%(+3.91)#49 | 3.5%(+3.42)#1,623 |
| 50. | Port William | 6.9% | 3.0%(+3.90)#50 | 3.5%(+3.41)#1,631 |
| 51. | Mariemont | 6.8% | 3.0%(+3.81)#51 | 3.5%(+3.32)#1,681 |
| 52. | Carey | 6.8% | 3.0%(+3.81)#52 | 3.5%(+3.32)#1,684 |
| 53. | Powell | 6.8% | 3.0%(+3.73)#53 | 3.5%(+3.24)#1,725 |
| 54. | Granville | 6.7% | 3.0%(+3.68)#54 | 3.5%(+3.19)#1,751 |
| 55. | Buchtel | 6.7% | 3.0%(+3.63)#55 | 3.5%(+3.14)#1,774 |
| 56. | Rogers | 6.7% | 3.0%(+3.63)#56 | 3.5%(+3.14)#1,776 |
| 57. | Lincoln Village | 6.6% | 3.0%(+3.55)#57 | 3.5%(+3.06)#1,826 |
| 58. | Barnesville | 6.5% | 3.0%(+3.49)#58 | 3.5%(+2.99)#1,868 |
| 59. | Westerville | 6.4% | 3.0%(+3.40)#59 | 3.5%(+2.91)#1,903 |
| 60. | Aurora | 6.4% | 3.0%(+3.37)#60 | 3.5%(+2.87)#1,915 |
| 61. | Conesville | 6.4% | 3.0%(+3.35)#61 | 3.5%(+2.86)#1,922 |
| 62. | Pigeon Creek | 6.3% | 3.0%(+3.30)#62 | 3.5%(+2.80)#1,952 |
| 63. | Etna | 6.3% | 3.0%(+3.28)#63 | 3.5%(+2.79)#1,963 |
| 64. | Mayfield Heights | 6.2% | 3.0%(+3.22)#64 | 3.5%(+2.72)#1,997 |
| 65. | Wyoming | 6.2% | 3.0%(+3.18)#65 | 3.5%(+2.69)#2,015 |
| 66. | Seven Hills | 6.2% | 3.0%(+3.17)#66 | 3.5%(+2.68)#2,027 |
| 67. | Wetherington | 6.2% | 3.0%(+3.12)#67 | 3.5%(+2.63)#2,074 |
| 68. | Devola | 6.1% | 3.0%(+3.09)#68 | 3.5%(+2.60)#2,086 |
| 69. | Worthington | 6.1% | 3.0%(+3.05)#69 | 3.5%(+2.56)#2,113 |
| 70. | Pleasant Hills | 6.0% | 3.0%(+3.02)#70 | 3.5%(+2.52)#2,138 |
| 71. | Navarre | 6.0% | 3.0%(+2.97)#71 | 3.5%(+2.48)#2,163 |
| 72. | Waynesville | 6.0% | 3.0%(+2.96)#72 | 3.5%(+2.47)#2,171 |
| 73. | Pickerington | 6.0% | 3.0%(+2.93)#73 | 3.5%(+2.44)#2,195 |
| 74. | Delaware | 5.9% | 3.0%(+2.91)#74 | 3.5%(+2.42)#2,213 |
| 75. | Lake Waynoka | 5.9% | 3.0%(+2.91)#75 | 3.5%(+2.42)#2,214 |
| 76. | New Baltimore | 5.9% | 3.0%(+2.90)#76 | 3.5%(+2.41)#2,218 |
| 77. | Upper Arlington | 5.9% | 3.0%(+2.88)#77 | 3.5%(+2.39)#2,236 |
| 78. | Mcconnelsville | 5.8% | 3.0%(+2.79)#78 | 3.5%(+2.30)#2,302 |
| 79. | Willoughby Hills | 5.8% | 3.0%(+2.74)#79 | 3.5%(+2.25)#2,330 |
| 80. | Kent | 5.7% | 3.0%(+2.71)#80 | 3.5%(+2.21)#2,365 |
| 81. | Silverton | 5.7% | 3.0%(+2.65)#81 | 3.5%(+2.16)#2,418 |
| 82. | Strongsville | 5.7% | 3.0%(+2.64)#82 | 3.5%(+2.15)#2,423 |
| 83. | Lebanon | 5.7% | 3.0%(+2.64)#83 | 3.5%(+2.14)#2,429 |
| 84. | Sugar Bush Knolls | 5.7% | 3.0%(+2.63)#84 | 3.5%(+2.14)#2,433 |
| 85. | Portage Lakes | 5.6% | 3.0%(+2.59)#85 | 3.5%(+2.10)#2,470 |
| 86. | Portage | 5.6% | 3.0%(+2.52)#86 | 3.5%(+2.03)#2,526 |
| 87. | Rossmoyne | 5.5% | 3.0%(+2.47)#87 | 3.5%(+1.98)#2,565 |
| 88. | Montpelier | 5.5% | 3.0%(+2.45)#88 | 3.5%(+1.96)#2,579 |
| 89. | Lafayette | 5.5% | 3.0%(+2.45)#89 | 3.5%(+1.95)#2,590 |
| 90. | Reynoldsburg | 5.4% | 3.0%(+2.41)#90 | 3.5%(+1.92)#2,619 |
| 91. | Fairfax | 5.4% | 3.0%(+2.41)#91 | 3.5%(+1.91)#2,626 |
| 92. | Loveland | 5.4% | 3.0%(+2.41)#92 | 3.5%(+1.91)#2,627 |
| 93. | Blue Jay | 5.4% | 3.0%(+2.39)#93 | 3.5%(+1.90)#2,637 |
| 94. | Donnelsville | 5.4% | 3.0%(+2.39)#94 | 3.5%(+1.90)#2,645 |
| 95. | South Mount Vernon | 5.4% | 3.0%(+2.38)#95 | 3.5%(+1.89)#2,658 |
| 96. | Commercial Point | 5.4% | 3.0%(+2.36)#96 | 3.5%(+1.87)#2,681 |
| 97. | Miamisburg | 5.3% | 3.0%(+2.29)#97 | 3.5%(+1.80)#2,750 |
| 98. | Van Buren | 5.3% | 3.0%(+2.25)#98 | 3.5%(+1.76)#2,797 |
| 99. | Westlake | 5.3% | 3.0%(+2.23)#99 | 3.5%(+1.74)#2,801 |
| 100. | Jersey | 5.3% | 3.0%(+2.23)#100 | 3.5%(+1.74)#2,805 |
Common Questions
What are the Top 10 Cities with the Highest Percentage of Population Employed in Computer & Mathematics in Ohio?
Top 10 Cities with the Highest Percentage of Population Employed in Computer & Mathematics in Ohio are:
#1
22.6%
#2
22.1%
#3
21.1%
#4
18.5%
#5
13.0%
#6
12.5%
#7
11.5%
#8
11.3%
#9
10.7%
#10
10.6%
What city has the Highest Percentage of Population Employed in Computer & Mathematics in Ohio?
Melmore has the Highest Percentage of Population Employed in Computer & Mathematics in Ohio with 22.6%.
What is the Percentage of Population Employed in Computer & Mathematics in the State of Ohio?
Percentage of Population Employed in Computer & Mathematics in Ohio is 3.0%.
What is the Percentage of Population Employed in Computer & Mathematics in the United States?
Percentage of Population Employed in Computer & Mathematics in the United States is 3.5%.