Cities with the Highest Percentage of Population Employed in Computer & Mathematics in Oregon
RELATED REPORTS & OPTIONS
Computer & Mathematics
Oregon
Compare Cities
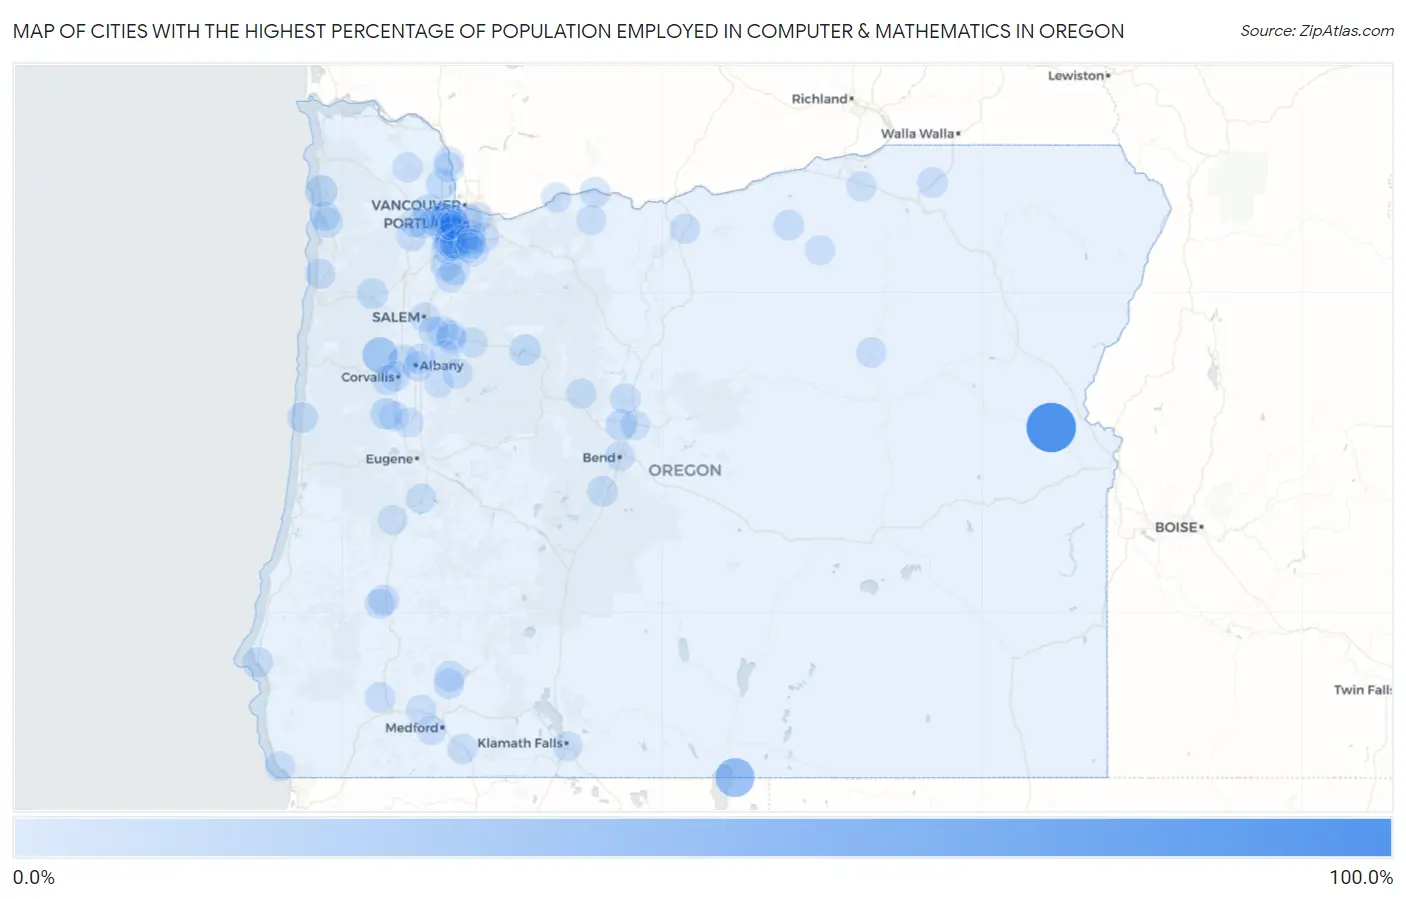
Map of Cities with the Highest Percentage of Population Employed in Computer & Mathematics in Oregon
0.0%
100.0%
Cities with the Highest Percentage of Population Employed in Computer & Mathematics in Oregon
| City | % Employed | vs State | vs National | |
| 1. | Brogan | 100.0% | 3.5%(+96.5)#1 | 3.5%(+96.5)#7 |
| 2. | New Pine Creek | 45.7% | 3.5%(+42.3)#2 | 3.5%(+42.2)#27 |
| 3. | Kings Valley | 28.2% | 3.5%(+24.8)#3 | 3.5%(+24.7)#80 |
| 4. | Wedderburn | 15.2% | 3.5%(+11.7)#4 | 3.5%(+11.6)#307 |
| 5. | Bethany | 14.4% | 3.5%(+11.0)#5 | 3.5%(+10.9)#346 |
| 6. | Manzanita | 12.7% | 3.5%(+9.21)#6 | 3.5%(+9.14)#452 |
| 7. | Alpine | 10.4% | 3.5%(+6.92)#7 | 3.5%(+6.85)#672 |
| 8. | North Plains | 10.2% | 3.5%(+6.71)#8 | 3.5%(+6.64)#708 |
| 9. | Detroit | 10.0% | 3.5%(+6.55)#9 | 3.5%(+6.48)#736 |
| 10. | Butteville | 9.3% | 3.5%(+5.89)#10 | 3.5%(+5.82)#867 |
| 11. | Eagle Crest | 9.3% | 3.5%(+5.81)#11 | 3.5%(+5.74)#883 |
| 12. | Oak Hills | 9.0% | 3.5%(+5.58)#12 | 3.5%(+5.51)#935 |
| 13. | Cedar Mill | 8.1% | 3.5%(+4.61)#13 | 3.5%(+4.54)#1,195 |
| 14. | Garden Home Whitford | 7.7% | 3.5%(+4.24)#14 | 3.5%(+4.17)#1,333 |
| 15. | Scappoose | 7.4% | 3.5%(+3.92)#15 | 3.5%(+3.84)#1,448 |
| 16. | Bull Mountain | 7.3% | 3.5%(+3.83)#16 | 3.5%(+3.76)#1,478 |
| 17. | Adair Village | 7.2% | 3.5%(+3.75)#17 | 3.5%(+3.68)#1,515 |
| 18. | Willamina | 7.1% | 3.5%(+3.69)#18 | 3.5%(+3.62)#1,531 |
| 19. | Aumsville | 7.1% | 3.5%(+3.68)#19 | 3.5%(+3.60)#1,546 |
| 20. | Beaverton | 6.9% | 3.5%(+3.48)#20 | 3.5%(+3.41)#1,626 |
| 21. | Trail | 6.8% | 3.5%(+3.36)#21 | 3.5%(+3.29)#1,701 |
| 22. | Port Orford | 6.5% | 3.5%(+3.09)#22 | 3.5%(+3.02)#1,849 |
| 23. | King City | 6.4% | 3.5%(+2.95)#23 | 3.5%(+2.88)#1,912 |
| 24. | Three Rivers | 6.4% | 3.5%(+2.94)#24 | 3.5%(+2.87)#1,916 |
| 25. | Yachats | 6.1% | 3.5%(+2.66)#25 | 3.5%(+2.59)#2,090 |
| 26. | Rockcreek | 6.1% | 3.5%(+2.64)#26 | 3.5%(+2.57)#2,099 |
| 27. | Aloha | 6.1% | 3.5%(+2.64)#27 | 3.5%(+2.57)#2,101 |
| 28. | Juniper Canyon | 6.0% | 3.5%(+2.59)#28 | 3.5%(+2.52)#2,144 |
| 29. | Ione | 6.0% | 3.5%(+2.59)#29 | 3.5%(+2.52)#2,145 |
| 30. | Shady Cove | 5.9% | 3.5%(+2.47)#30 | 3.5%(+2.40)#2,232 |
| 31. | Crooked River Ranch | 5.9% | 3.5%(+2.40)#31 | 3.5%(+2.33)#2,278 |
| 32. | Marlene | 5.8% | 3.5%(+2.36)#32 | 3.5%(+2.29)#2,305 |
| 33. | Raleigh Hills | 5.8% | 3.5%(+2.36)#33 | 3.5%(+2.29)#2,306 |
| 34. | Green | 5.7% | 3.5%(+2.25)#34 | 3.5%(+2.18)#2,395 |
| 35. | Hillsboro | 5.7% | 3.5%(+2.23)#35 | 3.5%(+2.16)#2,408 |
| 36. | Philomath | 5.5% | 3.5%(+2.08)#36 | 3.5%(+2.01)#2,544 |
| 37. | Bay City | 5.5% | 3.5%(+2.03)#37 | 3.5%(+1.95)#2,589 |
| 38. | Tigard | 5.4% | 3.5%(+1.91)#38 | 3.5%(+1.84)#2,717 |
| 39. | Aurora | 5.3% | 3.5%(+1.86)#39 | 3.5%(+1.79)#2,759 |
| 40. | West Slope | 5.1% | 3.5%(+1.63)#40 | 3.5%(+1.56)#2,985 |
| 41. | Rivergrove | 5.0% | 3.5%(+1.53)#41 | 3.5%(+1.45)#3,117 |
| 42. | Gold Hill | 5.0% | 3.5%(+1.50)#42 | 3.5%(+1.43)#3,143 |
| 43. | Corvallis | 4.9% | 3.5%(+1.42)#43 | 3.5%(+1.35)#3,228 |
| 44. | Portland | 4.9% | 3.5%(+1.42)#44 | 3.5%(+1.35)#3,238 |
| 45. | Happy Valley | 4.9% | 3.5%(+1.42)#45 | 3.5%(+1.35)#3,241 |
| 46. | Adams | 4.7% | 3.5%(+1.28)#46 | 3.5%(+1.21)#3,398 |
| 47. | Keno | 4.7% | 3.5%(+1.27)#47 | 3.5%(+1.20)#3,409 |
| 48. | Winston | 4.7% | 3.5%(+1.25)#48 | 3.5%(+1.18)#3,435 |
| 49. | Hood River | 4.7% | 3.5%(+1.22)#49 | 3.5%(+1.15)#3,483 |
| 50. | Merlin | 4.6% | 3.5%(+1.19)#50 | 3.5%(+1.12)#3,517 |
| 51. | Green Meadows | 4.6% | 3.5%(+1.18)#51 | 3.5%(+1.11)#3,526 |
| 52. | Lake Oswego | 4.6% | 3.5%(+1.15)#52 | 3.5%(+1.07)#3,561 |
| 53. | Moro | 4.6% | 3.5%(+1.12)#53 | 3.5%(+1.05)#3,591 |
| 54. | Long Creek | 4.5% | 3.5%(+1.09)#54 | 3.5%(+1.02)#3,626 |
| 55. | Sherwood | 4.5% | 3.5%(+1.01)#55 | 3.5%(+0.944)#3,718 |
| 56. | Maywood Park | 4.4% | 3.5%(+0.974)#56 | 3.5%(+0.903)#3,769 |
| 57. | Gaston | 4.4% | 3.5%(+0.938)#57 | 3.5%(+0.867)#3,837 |
| 58. | Millersburg | 4.2% | 3.5%(+0.750)#58 | 3.5%(+0.679)#4,121 |
| 59. | Pacific City | 4.2% | 3.5%(+0.726)#59 | 3.5%(+0.655)#4,163 |
| 60. | Brookings | 4.1% | 3.5%(+0.695)#60 | 3.5%(+0.625)#4,227 |
| 61. | Stayton | 4.1% | 3.5%(+0.691)#61 | 3.5%(+0.621)#4,234 |
| 62. | Cottage Grove | 4.1% | 3.5%(+0.664)#62 | 3.5%(+0.594)#4,281 |
| 63. | Tualatin | 4.0% | 3.5%(+0.527)#63 | 3.5%(+0.456)#4,491 |
| 64. | Camp Sherman | 3.9% | 3.5%(+0.442)#64 | 3.5%(+0.372)#4,645 |
| 65. | Ashland | 3.9% | 3.5%(+0.411)#65 | 3.5%(+0.341)#4,700 |
| 66. | Harrisburg | 3.7% | 3.5%(+0.283)#66 | 3.5%(+0.213)#4,938 |
| 67. | Mount Hood | 3.7% | 3.5%(+0.273)#67 | 3.5%(+0.203)#4,953 |
| 68. | Durham | 3.7% | 3.5%(+0.273)#68 | 3.5%(+0.202)#4,954 |
| 69. | Oak Grove | 3.7% | 3.5%(+0.270)#69 | 3.5%(+0.200)#4,958 |
| 70. | Oregon City | 3.7% | 3.5%(+0.245)#70 | 3.5%(+0.175)#5,011 |
| 71. | Vernonia | 3.7% | 3.5%(+0.240)#71 | 3.5%(+0.170)#5,019 |
| 72. | Salem | 3.7% | 3.5%(+0.226)#72 | 3.5%(+0.155)#5,046 |
| 73. | Hubbard | 3.7% | 3.5%(+0.222)#73 | 3.5%(+0.151)#5,053 |
| 74. | Milwaukie | 3.6% | 3.5%(+0.192)#74 | 3.5%(+0.122)#5,116 |
| 75. | Cornelius | 3.6% | 3.5%(+0.191)#75 | 3.5%(+0.121)#5,118 |
| 76. | Bend | 3.6% | 3.5%(+0.185)#76 | 3.5%(+0.115)#5,129 |
| 77. | St Helens | 3.6% | 3.5%(+0.150)#77 | 3.5%(+0.079)#5,194 |
| 78. | Drain | 3.6% | 3.5%(+0.110)#78 | 3.5%(+0.039)#5,280 |
| 79. | Echo | 3.6% | 3.5%(+0.101)#79 | 3.5%(+0.031)#5,295 |
| 80. | Albany | 3.6% | 3.5%(+0.096)#80 | 3.5%(+0.026)#5,307 |
| 81. | Cedar Hills | 3.5% | 3.5%(+0.089)#81 | 3.5%(+0.019)#5,329 |
| 82. | West Haven Sylvan | 3.5% | 3.5%(+0.072)#82 | 3.5%(+0.002)#5,365 |
| 83. | Heppner | 3.5% | 3.5%(+0.014)#83 | 3.5%(-0.056)#5,491 |
| 84. | West Linn | 3.5% | 3.5%(-0.002)#84 | 3.5%(-0.073)#5,522 |
| 85. | Jennings Lodge | 3.4% | 3.5%(-0.075)#85 | 3.5%(-0.145)#5,684 |
| 86. | Garibaldi | 3.4% | 3.5%(-0.087)#86 | 3.5%(-0.158)#5,709 |
| 87. | Monroe | 3.3% | 3.5%(-0.112)#87 | 3.5%(-0.183)#5,769 |
| 88. | Lebanon | 3.3% | 3.5%(-0.146)#88 | 3.5%(-0.217)#5,847 |
| 89. | Klamath Falls | 3.3% | 3.5%(-0.152)#89 | 3.5%(-0.222)#5,863 |
| 90. | Sublimity | 3.2% | 3.5%(-0.213)#90 | 3.5%(-0.283)#6,000 |
| 91. | Redmond | 3.2% | 3.5%(-0.249)#91 | 3.5%(-0.319)#6,102 |
| 92. | Columbia City | 3.2% | 3.5%(-0.273)#92 | 3.5%(-0.344)#6,160 |
| 93. | Lyons | 3.2% | 3.5%(-0.300)#93 | 3.5%(-0.371)#6,223 |
| 94. | Scio | 3.1% | 3.5%(-0.305)#94 | 3.5%(-0.375)#6,237 |
| 95. | Turner | 3.1% | 3.5%(-0.318)#95 | 3.5%(-0.389)#6,268 |
| 96. | Lacomb | 3.1% | 3.5%(-0.329)#96 | 3.5%(-0.400)#6,301 |
| 97. | Saunders Lake | 3.1% | 3.5%(-0.379)#97 | 3.5%(-0.450)#6,426 |
| 98. | Cascade Locks | 3.0% | 3.5%(-0.416)#98 | 3.5%(-0.486)#6,502 |
| 99. | Jacksonville | 3.0% | 3.5%(-0.500)#99 | 3.5%(-0.570)#6,710 |
| 100. | Forest Grove | 2.9% | 3.5%(-0.520)#100 | 3.5%(-0.591)#6,766 |
Common Questions
What are the Top 10 Cities with the Highest Percentage of Population Employed in Computer & Mathematics in Oregon?
Top 10 Cities with the Highest Percentage of Population Employed in Computer & Mathematics in Oregon are:
#1
100.0%
#2
45.7%
#3
28.2%
#4
14.4%
#5
12.7%
#6
10.4%
#7
10.2%
#8
10.0%
#9
9.3%
#10
9.3%
What city has the Highest Percentage of Population Employed in Computer & Mathematics in Oregon?
Brogan has the Highest Percentage of Population Employed in Computer & Mathematics in Oregon with 100.0%.
What is the Percentage of Population Employed in Computer & Mathematics in the State of Oregon?
Percentage of Population Employed in Computer & Mathematics in Oregon is 3.5%.
What is the Percentage of Population Employed in Computer & Mathematics in the United States?
Percentage of Population Employed in Computer & Mathematics in the United States is 3.5%.