Los Molinos, CA Map & Demographics
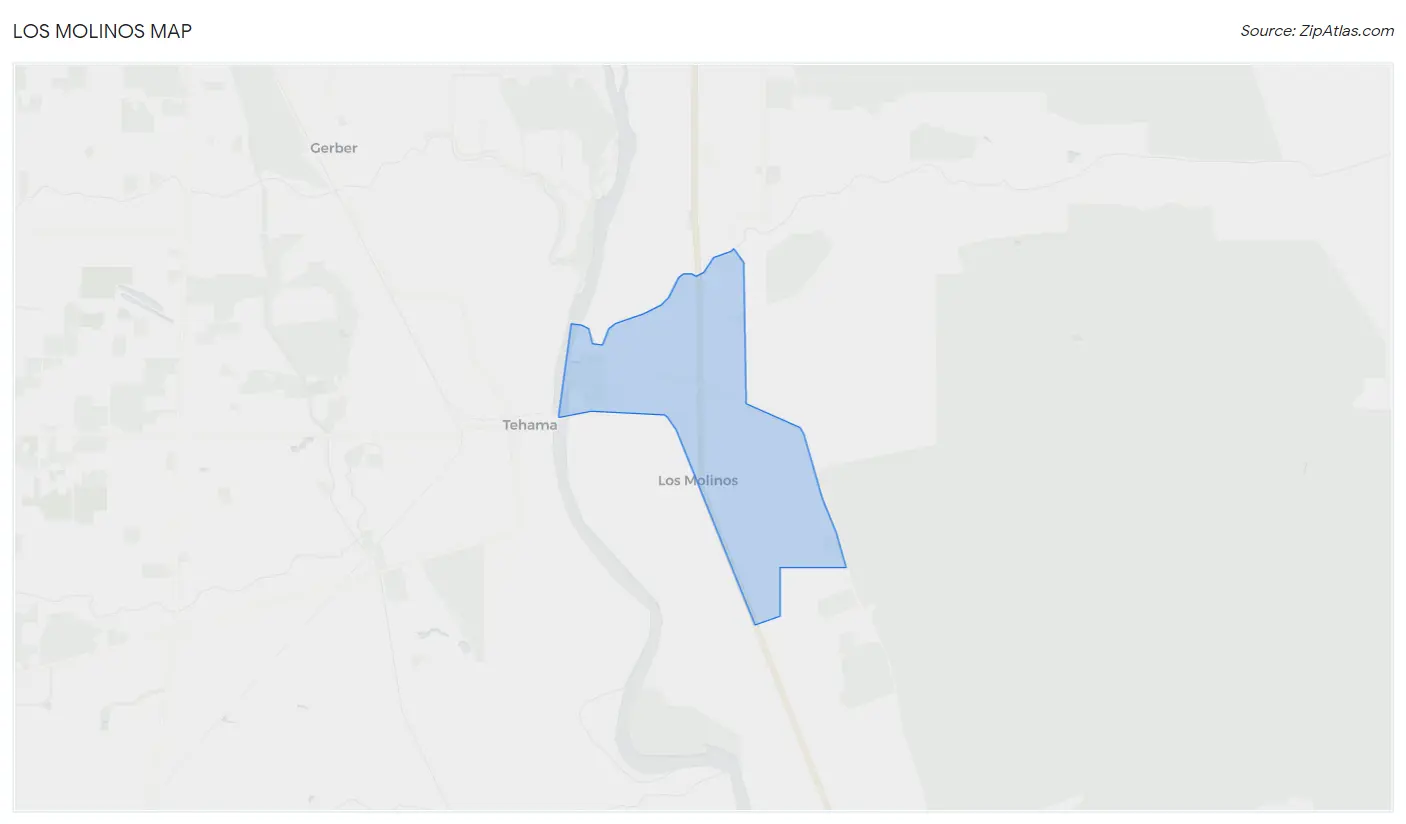
Los Molinos Map
Los Molinos Overview
$20,624
PER CAPITA INCOME
$70,441
AVG FAMILY INCOME
$28,385
AVG HOUSEHOLD INCOME
$11,350
FAMILY INCOME DEFICIT
0.52
INEQUALITY / GINI INDEX
1,649
TOTAL POPULATION
790
MALE POPULATION
859
FEMALE POPULATION
91.97
MALES / 100 FEMALES
108.73
FEMALES / 100 MALES
35.0
MEDIAN AGE
3.3
AVG FAMILY SIZE
2.4
AVG HOUSEHOLD SIZE
594
LABOR FORCE [ PEOPLE ]
49.6%
PERCENT IN LABOR FORCE
10.8%
UNEMPLOYMENT RATE
Los Molinos Zip Codes
Los Molinos Area Codes
Income in Los Molinos
Income Overview in Los Molinos
Per Capita Income in Los Molinos is $20,624, while median incomes of families and households are $70,441 and $28,385 respectively.
| Characteristic | Number | Measure |
| Per Capita Income | 1,649 | $20,624 |
| Median Family Income | 394 | $70,441 |
| Mean Family Income | 394 | $76,354 |
| Median Household Income | 691 | $28,385 |
| Mean Household Income | 691 | $53,121 |
| Income Deficit | 394 | $11,350 |
| Wage / Income Gap (%) | 1,649 | 0.00% |
| Wage / Income Gap ($) | 1,649 | 100.00¢ per $1 |
| Gini / Inequality Index | 1,649 | 0.52 |
Earnings by Sex in Los Molinos
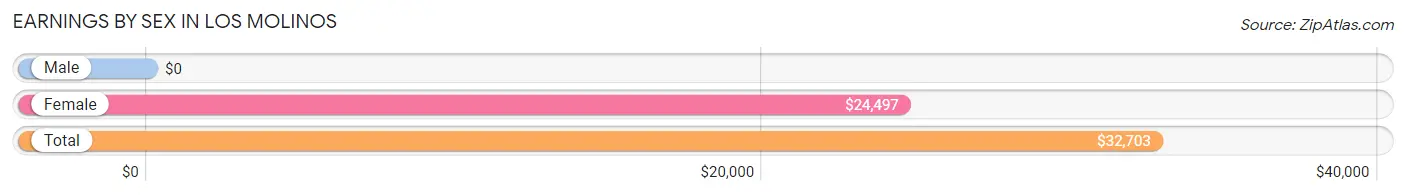
| Sex | Number | Average Earnings |
| Male | 268 (46.9%) | $0 |
| Female | 303 (53.1%) | $24,497 |
| Total | 571 (100.0%) | $32,703 |
Earnings by Sex by Income Bracket in Los Molinos
The most common earnings brackets in Los Molinos are $65,000 to $74,999 for men (66 | 24.6%) and $22,500 to $24,999 for women (77 | 25.4%).
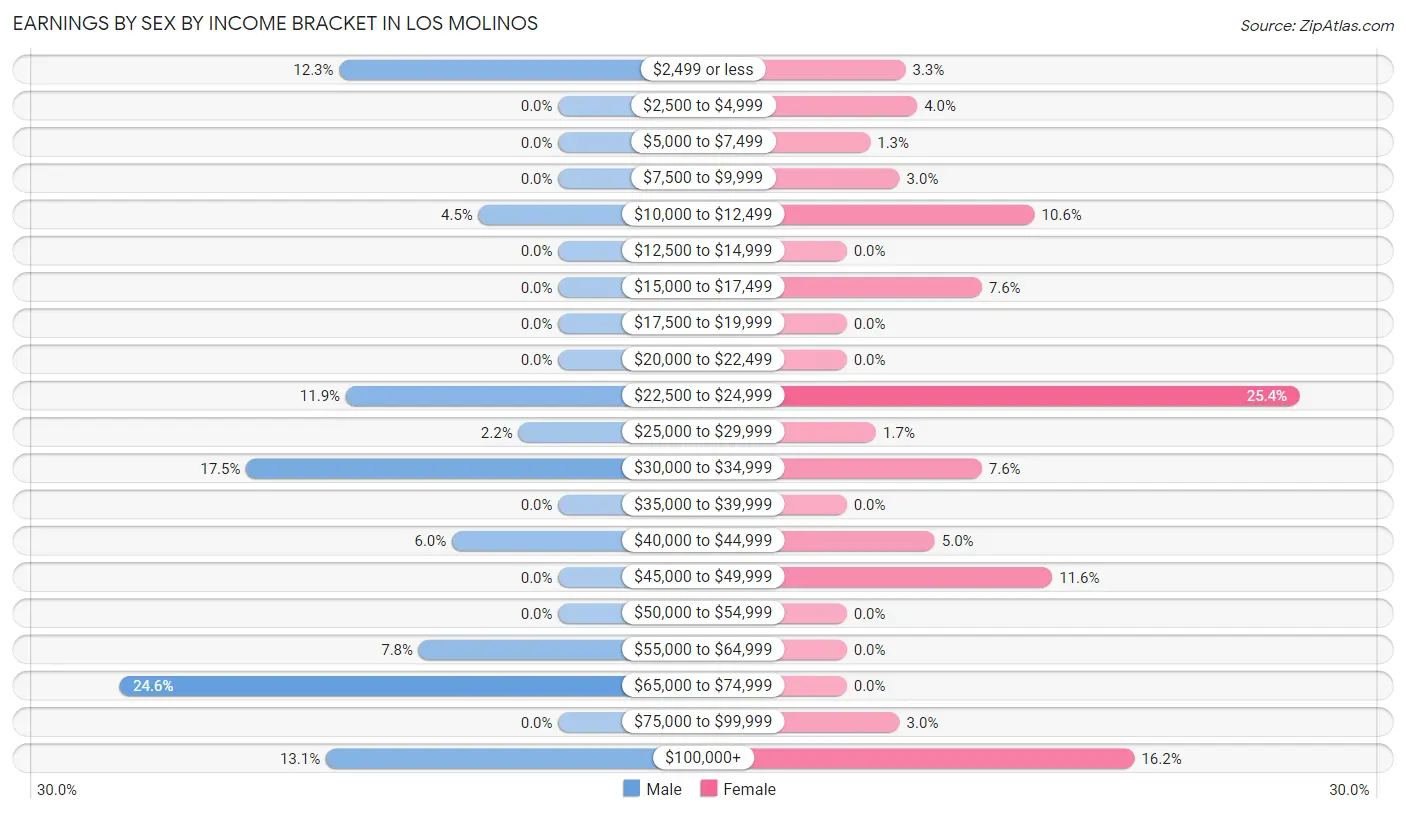
| Income | Male | Female |
| $2,499 or less | 33 (12.3%) | 10 (3.3%) |
| $2,500 to $4,999 | 0 (0.0%) | 12 (4.0%) |
| $5,000 to $7,499 | 0 (0.0%) | 4 (1.3%) |
| $7,500 to $9,999 | 0 (0.0%) | 9 (3.0%) |
| $10,000 to $12,499 | 12 (4.5%) | 32 (10.6%) |
| $12,500 to $14,999 | 0 (0.0%) | 0 (0.0%) |
| $15,000 to $17,499 | 0 (0.0%) | 23 (7.6%) |
| $17,500 to $19,999 | 0 (0.0%) | 0 (0.0%) |
| $20,000 to $22,499 | 0 (0.0%) | 0 (0.0%) |
| $22,500 to $24,999 | 32 (11.9%) | 77 (25.4%) |
| $25,000 to $29,999 | 6 (2.2%) | 5 (1.7%) |
| $30,000 to $34,999 | 47 (17.5%) | 23 (7.6%) |
| $35,000 to $39,999 | 0 (0.0%) | 0 (0.0%) |
| $40,000 to $44,999 | 16 (6.0%) | 15 (5.0%) |
| $45,000 to $49,999 | 0 (0.0%) | 35 (11.6%) |
| $50,000 to $54,999 | 0 (0.0%) | 0 (0.0%) |
| $55,000 to $64,999 | 21 (7.8%) | 0 (0.0%) |
| $65,000 to $74,999 | 66 (24.6%) | 0 (0.0%) |
| $75,000 to $99,999 | 0 (0.0%) | 9 (3.0%) |
| $100,000+ | 35 (13.1%) | 49 (16.2%) |
| Total | 268 (100.0%) | 303 (100.0%) |
Earnings by Sex by Educational Attainment in Los Molinos
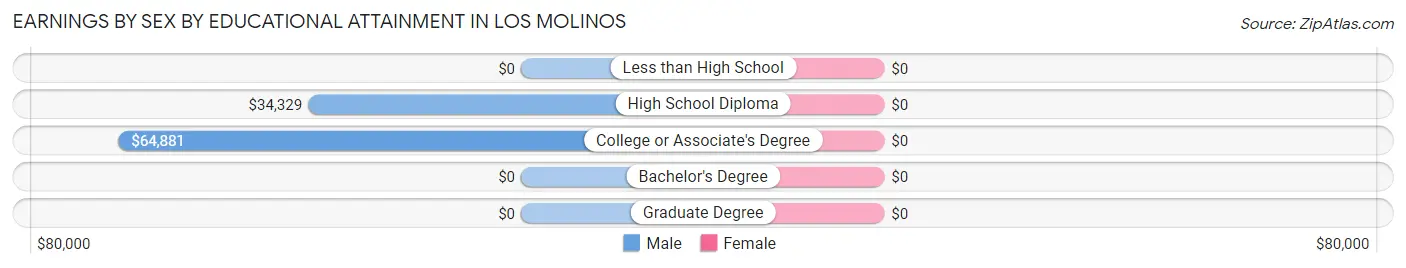
| Educational Attainment | Male Income | Female Income |
| Less than High School | - | - |
| High School Diploma | $34,329 | $0 |
| College or Associate's Degree | $64,881 | $0 |
| Bachelor's Degree | - | - |
| Graduate Degree | - | - |
| Total | $64,702 | $30,272 |
Family Income in Los Molinos
Family Income Brackets in Los Molinos
According to the Los Molinos family income data, there are 90 families falling into the $75,000 to $99,999 income range, which is the most common income bracket and makes up 22.8% of all families. Conversely, the less than $10,000 income bracket is the least frequent group with only 4 families (1.0%) belonging to this category.
| Income Bracket | # Families | % Families |
| Less than $10,000 | 4 | 1.0% |
| $10,000 to $14,999 | 54 | 13.7% |
| $15,000 to $24,999 | 21 | 5.3% |
| $25,000 to $34,999 | 68 | 17.3% |
| $35,000 to $49,999 | 9 | 2.3% |
| $50,000 to $74,999 | 55 | 14.0% |
| $75,000 to $99,999 | 90 | 22.8% |
| $100,000 to $149,999 | 58 | 14.7% |
| $150,000 to $199,999 | 4 | 1.0% |
| $200,000+ | 31 | 7.9% |
Family Income by Famaliy Size in Los Molinos
2-person families (212 | 53.8%) account for the highest median family income in Los Molinos with $66,908 per family, while 2-person families (212 | 53.8%) have the highest median income of $33,454 per family member.
| Income Bracket | # Families | Median Income |
| 2-Person Families | 212 (53.8%) | $66,908 |
| 3-Person Families | 5 (1.3%) | $0 |
| 4-Person Families | 71 (18.0%) | $0 |
| 5-Person Families | 63 (16.0%) | $0 |
| 6-Person Families | 43 (10.9%) | $0 |
| 7+ Person Families | 0 (0.0%) | $0 |
| Total | 394 (100.0%) | $70,441 |
Family Income by Number of Earners in Los Molinos
| Number of Earners | # Families | Median Income |
| No Earners | 80 (20.3%) | $26,000 |
| 1 Earner | 159 (40.4%) | $66,217 |
| 2 Earners | 114 (28.9%) | $110,476 |
| 3+ Earners | 41 (10.4%) | $0 |
| Total | 394 (100.0%) | $70,441 |
Household Income in Los Molinos
Household Income Brackets in Los Molinos
With 121 households falling in the category, the $25,000 to $34,999 income range is the most frequent in Los Molinos, accounting for 17.5% of all households.
| Income Bracket | # Households | % Households |
| Less than $10,000 | 77 | 11.1% |
| $10,000 to $14,999 | 116 | 16.8% |
| $15,000 to $24,999 | 93 | 13.5% |
| $25,000 to $34,999 | 121 | 17.5% |
| $35,000 to $49,999 | 29 | 4.2% |
| $50,000 to $74,999 | 55 | 8.0% |
| $75,000 to $99,999 | 107 | 15.5% |
| $100,000 to $149,999 | 58 | 8.4% |
| $150,000 to $199,999 | 0 | 0.0% |
| $200,000+ | 35 | 5.1% |
Household Income by Householder Age in Los Molinos
The median household income in Los Molinos is $28,385, with the highest median household income of $65,592 found in the 25 to 44 years age bracket for the primary householder. A total of 258 households (37.3%) fall into this category. Meanwhile, the 15 to 24 years age bracket for the primary householder has the lowest median household income of $0, with 11 households (1.6%) in this group.
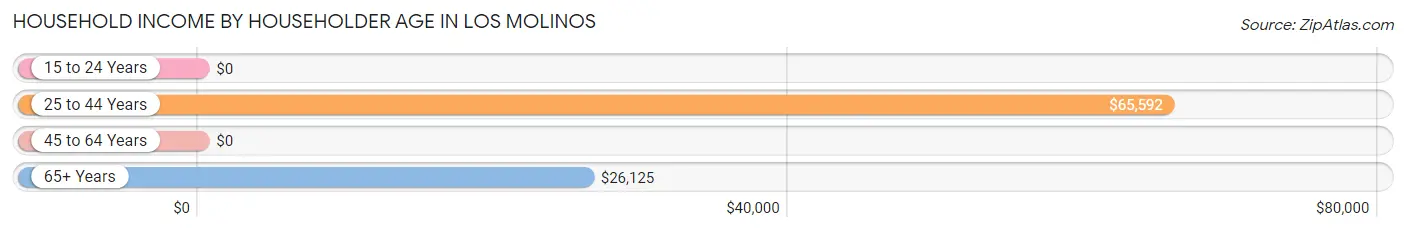
| Income Bracket | # Households | Median Income |
| 15 to 24 Years | 11 (1.6%) | $0 |
| 25 to 44 Years | 258 (37.3%) | $65,592 |
| 45 to 64 Years | 232 (33.6%) | $0 |
| 65+ Years | 190 (27.5%) | $26,125 |
| Total | 691 (100.0%) | $28,385 |
Poverty in Los Molinos
Income Below Poverty by Sex and Age in Los Molinos
With 54.2% poverty level for males and 28.5% for females among the residents of Los Molinos, 5 year old males and 45 to 54 year old females are the most vulnerable to poverty, with 44 males (100.0%) and 52 females (45.6%) in their respective age groups living below the poverty level.
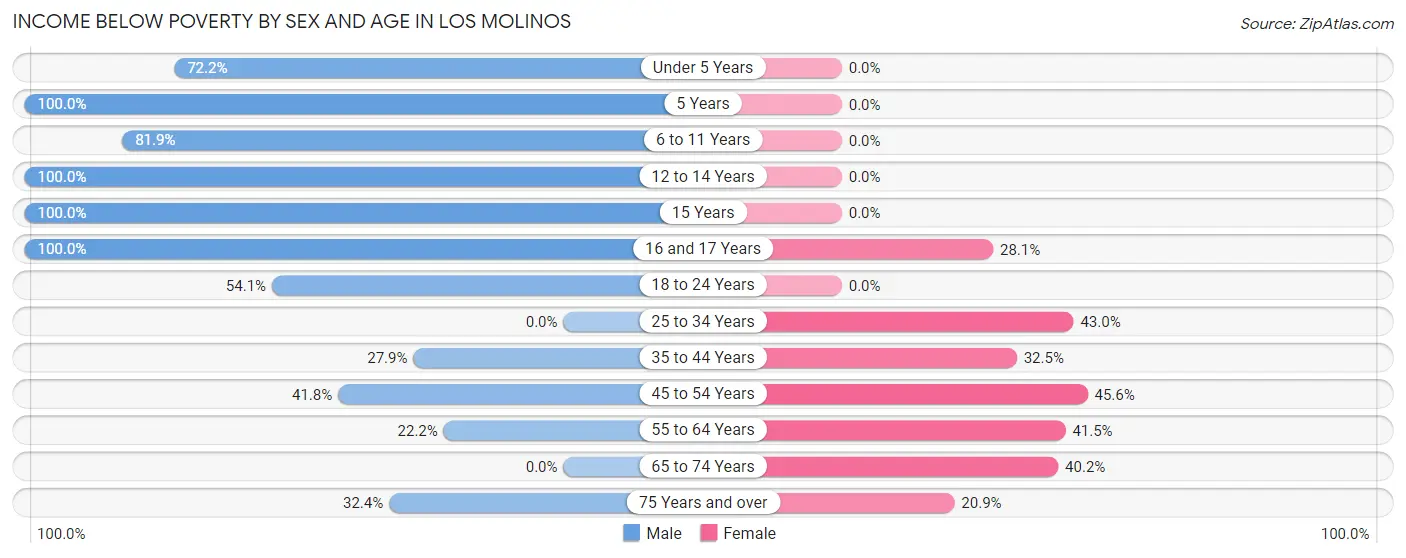
| Age Bracket | Male | Female |
| Under 5 Years | 26 (72.2%) | 0 (0.0%) |
| 5 Years | 44 (100.0%) | 0 (0.0%) |
| 6 to 11 Years | 131 (81.9%) | 0 (0.0%) |
| 12 to 14 Years | 35 (100.0%) | 0 (0.0%) |
| 15 Years | 29 (100.0%) | 0 (0.0%) |
| 16 and 17 Years | 39 (100.0%) | 16 (28.1%) |
| 18 to 24 Years | 33 (54.1%) | 0 (0.0%) |
| 25 to 34 Years | 0 (0.0%) | 40 (43.0%) |
| 35 to 44 Years | 22 (27.9%) | 50 (32.5%) |
| 45 to 54 Years | 46 (41.8%) | 52 (45.6%) |
| 55 to 64 Years | 12 (22.2%) | 22 (41.5%) |
| 65 to 74 Years | 0 (0.0%) | 51 (40.2%) |
| 75 Years and over | 11 (32.4%) | 14 (20.9%) |
| Total | 428 (54.2%) | 245 (28.5%) |
Income Above Poverty by Sex and Age in Los Molinos
According to the poverty statistics in Los Molinos, males aged 25 to 34 years and females aged under 5 years are the age groups that are most secure financially, with 100.0% of males and 100.0% of females in these age groups living above the poverty line.
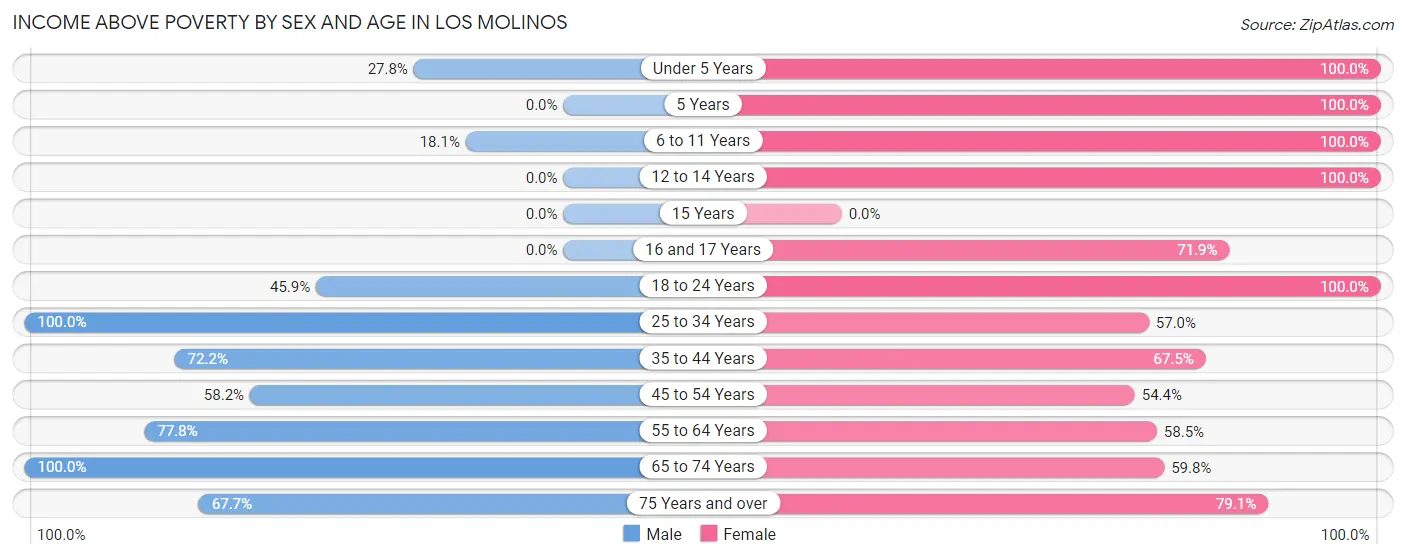
| Age Bracket | Male | Female |
| Under 5 Years | 10 (27.8%) | 53 (100.0%) |
| 5 Years | 0 (0.0%) | 22 (100.0%) |
| 6 to 11 Years | 29 (18.1%) | 34 (100.0%) |
| 12 to 14 Years | 0 (0.0%) | 39 (100.0%) |
| 15 Years | 0 (0.0%) | 0 (0.0%) |
| 16 and 17 Years | 0 (0.0%) | 41 (71.9%) |
| 18 to 24 Years | 28 (45.9%) | 46 (100.0%) |
| 25 to 34 Years | 75 (100.0%) | 53 (57.0%) |
| 35 to 44 Years | 57 (72.2%) | 104 (67.5%) |
| 45 to 54 Years | 64 (58.2%) | 62 (54.4%) |
| 55 to 64 Years | 42 (77.8%) | 31 (58.5%) |
| 65 to 74 Years | 34 (100.0%) | 76 (59.8%) |
| 75 Years and over | 23 (67.6%) | 53 (79.1%) |
| Total | 362 (45.8%) | 614 (71.5%) |
Income Below Poverty Among Married-Couple Families in Los Molinos
The poverty statistics for married-couple families in Los Molinos show that 18.9% or 44 of the total 233 families live below the poverty line. Families with 3 or 4 children have the highest poverty rate of 35.3%, comprising of 12 families. On the other hand, families with 1 or 2 children have the lowest poverty rate of 0.0%, which includes 0 families.
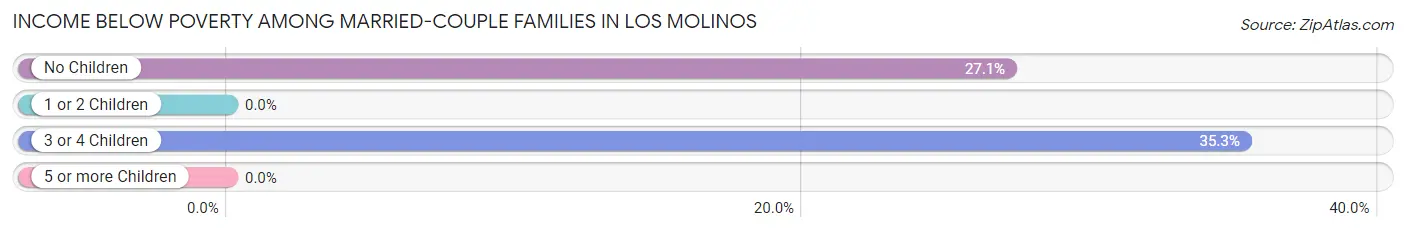
| Children | Above Poverty | Below Poverty |
| No Children | 86 (72.9%) | 32 (27.1%) |
| 1 or 2 Children | 81 (100.0%) | 0 (0.0%) |
| 3 or 4 Children | 22 (64.7%) | 12 (35.3%) |
| 5 or more Children | 0 (0.0%) | 0 (0.0%) |
| Total | 189 (81.1%) | 44 (18.9%) |
Income Below Poverty Among Single-Parent Households in Los Molinos
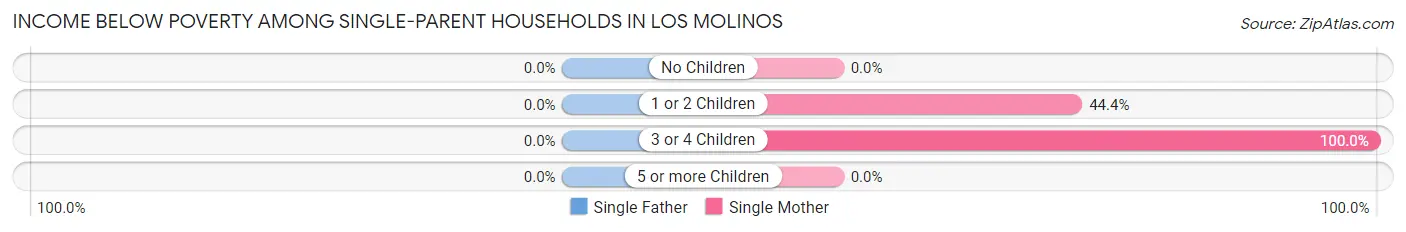
| Children | Single Father | Single Mother |
| No Children | 0 (0.0%) | 0 (0.0%) |
| 1 or 2 Children | 0 (0.0%) | 4 (44.4%) |
| 3 or 4 Children | 0 (0.0%) | 62 (100.0%) |
| 5 or more Children | 0 (0.0%) | 0 (0.0%) |
| Total | 0 (0.0%) | 66 (81.5%) |
Income Below Poverty Among Married-Couple vs Single-Parent Households in Los Molinos
The poverty data for Los Molinos shows that 44 of the married-couple family households (18.9%) and 66 of the single-parent households (41.0%) are living below the poverty level. Within the married-couple family households, those with 3 or 4 children have the highest poverty rate, with 12 households (35.3%) falling below the poverty line. Among the single-parent households, those with 3 or 4 children have the highest poverty rate, with 62 household (100.0%) living below poverty.
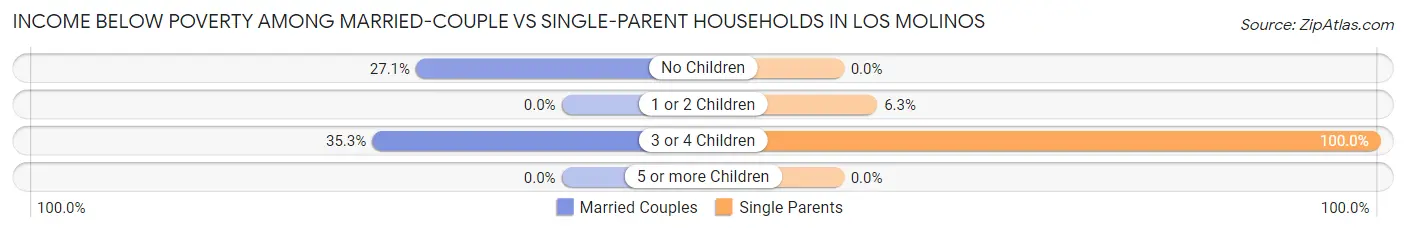
| Children | Married-Couple Families | Single-Parent Households |
| No Children | 32 (27.1%) | 0 (0.0%) |
| 1 or 2 Children | 0 (0.0%) | 4 (6.2%) |
| 3 or 4 Children | 12 (35.3%) | 62 (100.0%) |
| 5 or more Children | 0 (0.0%) | 0 (0.0%) |
| Total | 44 (18.9%) | 66 (41.0%) |
Race in Los Molinos
The most populous races in Los Molinos are White / Caucasian (1,103 | 66.9%), Hispanic or Latino (787 | 47.7%), and Two or more Races (472 | 28.6%).
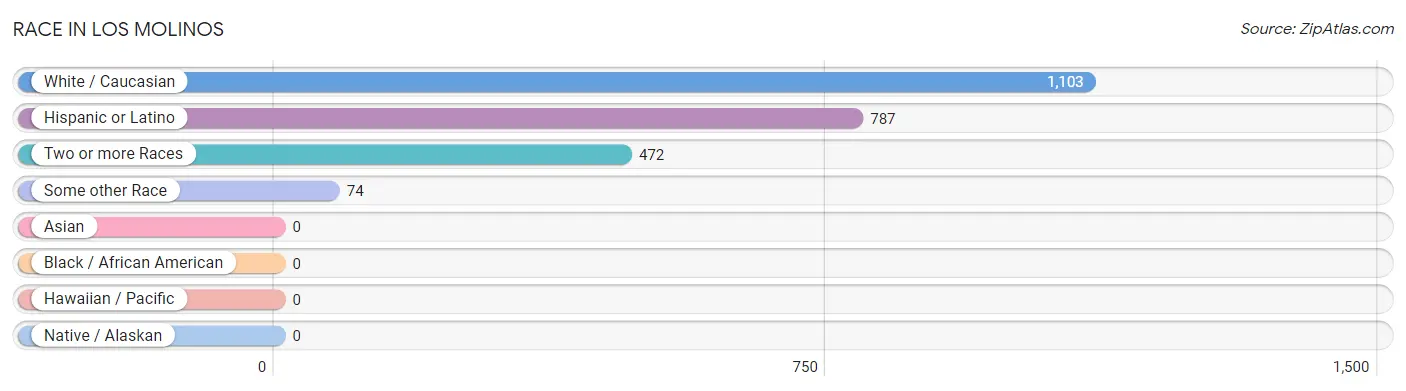
| Race | # Population | % Population |
| Asian | 0 | 0.0% |
| Black / African American | 0 | 0.0% |
| Hawaiian / Pacific | 0 | 0.0% |
| Hispanic or Latino | 787 | 47.7% |
| Native / Alaskan | 0 | 0.0% |
| White / Caucasian | 1,103 | 66.9% |
| Two or more Races | 472 | 28.6% |
| Some other Race | 74 | 4.5% |
| Total | 1,649 | 100.0% |
Ancestry in Los Molinos
The most populous ancestries reported in Los Molinos are Mexican (785 | 47.6%), German (287 | 17.4%), French (179 | 10.9%), American (113 | 6.9%), and English (99 | 6.0%), together accounting for 88.7% of all Los Molinos residents.
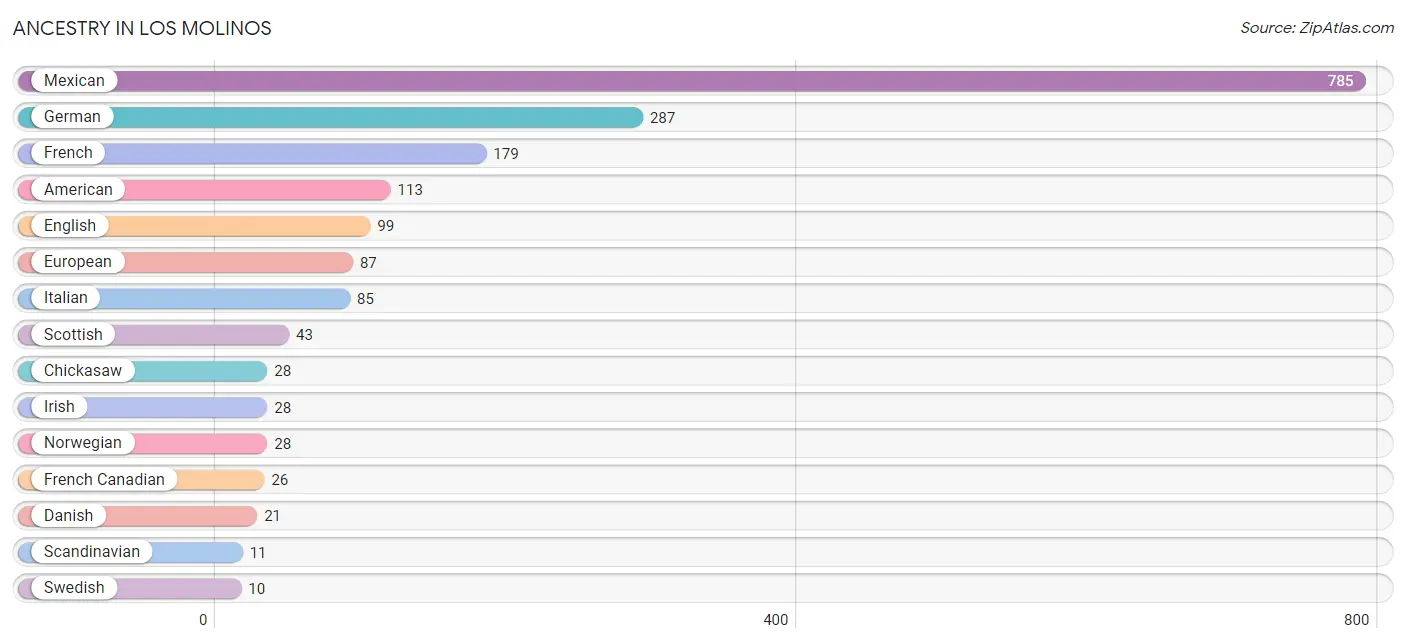
| Ancestry | # Population | % Population |
| American | 113 | 6.9% |
| Chickasaw | 28 | 1.7% |
| Danish | 21 | 1.3% |
| Dutch | 3 | 0.2% |
| English | 99 | 6.0% |
| European | 87 | 5.3% |
| French | 179 | 10.9% |
| French Canadian | 26 | 1.6% |
| German | 287 | 17.4% |
| Irish | 28 | 1.7% |
| Italian | 85 | 5.1% |
| Mexican | 785 | 47.6% |
| Norwegian | 28 | 1.7% |
| Puerto Rican | 2 | 0.1% |
| Scandinavian | 11 | 0.7% |
| Scottish | 43 | 2.6% |
| Swedish | 10 | 0.6% | View All 17 Rows |
Immigrants in Los Molinos
The most numerous immigrant groups reported in Los Molinos came from Central America (141 | 8.6%), Latin America (141 | 8.6%), and Mexico (141 | 8.6%), together accounting for 25.7% of all Los Molinos residents.
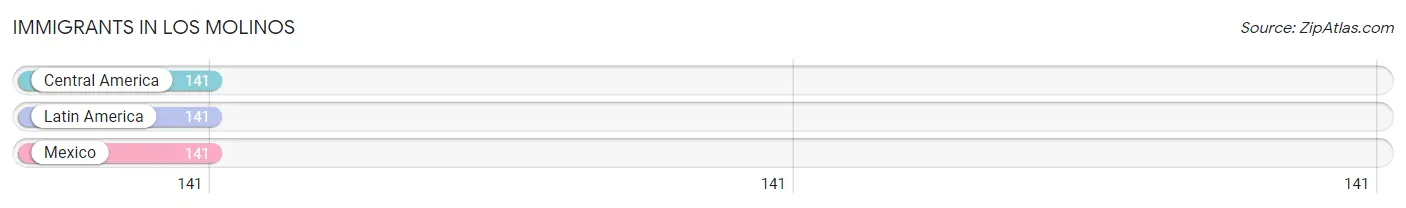
| Immigration Origin | # Population | % Population |
| Central America | 141 | 8.6% |
| Latin America | 141 | 8.6% |
| Mexico | 141 | 8.6% | View All 3 Rows |
Sex and Age in Los Molinos
Sex and Age in Los Molinos
The most populous age groups in Los Molinos are 5 to 9 Years (122 | 15.4%) for men and 35 to 39 Years (99 | 11.5%) for women.
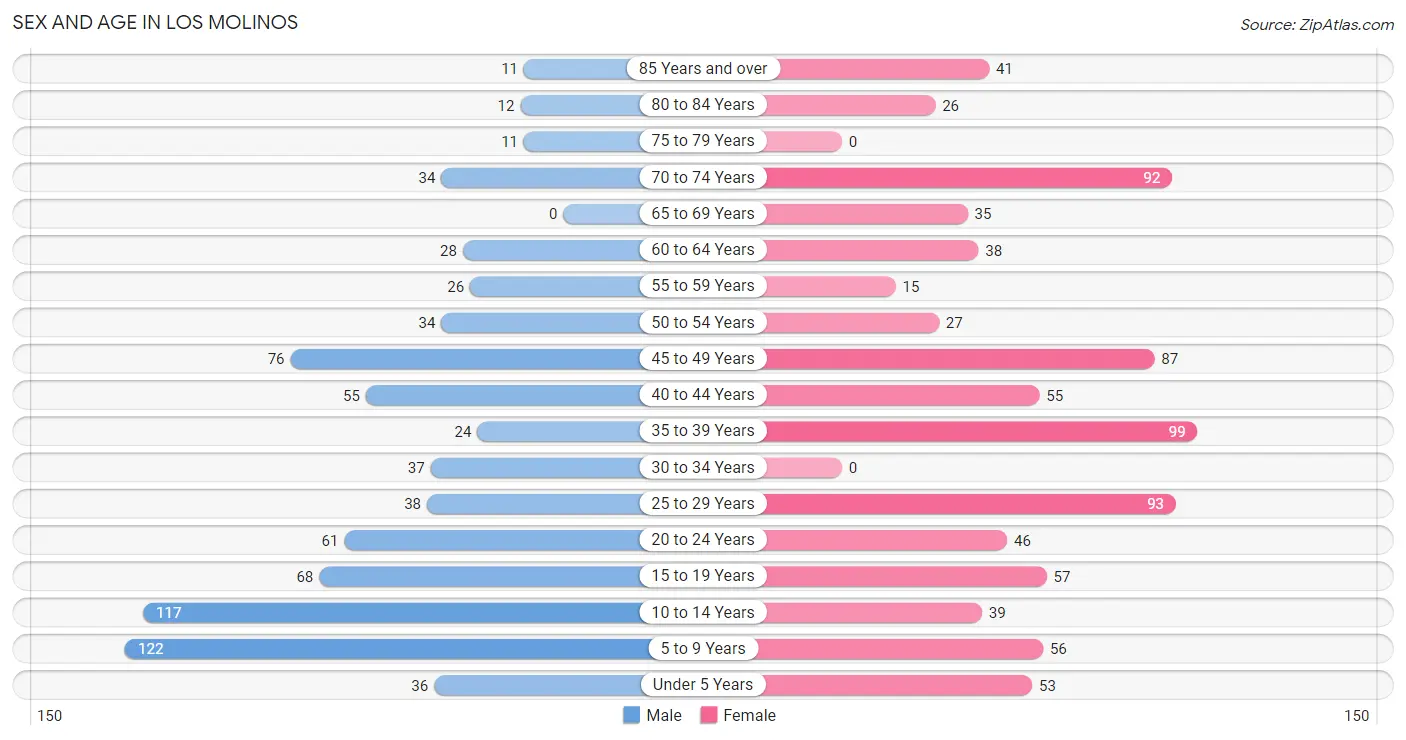
| Age Bracket | Male | Female |
| Under 5 Years | 36 (4.6%) | 53 (6.2%) |
| 5 to 9 Years | 122 (15.4%) | 56 (6.5%) |
| 10 to 14 Years | 117 (14.8%) | 39 (4.5%) |
| 15 to 19 Years | 68 (8.6%) | 57 (6.6%) |
| 20 to 24 Years | 61 (7.7%) | 46 (5.4%) |
| 25 to 29 Years | 38 (4.8%) | 93 (10.8%) |
| 30 to 34 Years | 37 (4.7%) | 0 (0.0%) |
| 35 to 39 Years | 24 (3.0%) | 99 (11.5%) |
| 40 to 44 Years | 55 (7.0%) | 55 (6.4%) |
| 45 to 49 Years | 76 (9.6%) | 87 (10.1%) |
| 50 to 54 Years | 34 (4.3%) | 27 (3.1%) |
| 55 to 59 Years | 26 (3.3%) | 15 (1.8%) |
| 60 to 64 Years | 28 (3.5%) | 38 (4.4%) |
| 65 to 69 Years | 0 (0.0%) | 35 (4.1%) |
| 70 to 74 Years | 34 (4.3%) | 92 (10.7%) |
| 75 to 79 Years | 11 (1.4%) | 0 (0.0%) |
| 80 to 84 Years | 12 (1.5%) | 26 (3.0%) |
| 85 Years and over | 11 (1.4%) | 41 (4.8%) |
| Total | 790 (100.0%) | 859 (100.0%) |
Families and Households in Los Molinos
Median Family Size in Los Molinos
The median family size in Los Molinos is 3.26 persons per family, with single female/mother families (81 | 20.6%) accounting for the largest median family size of 4.94 persons per family. On the other hand, single male/father families (80 | 20.3%) represent the smallest median family size with 1.64 persons per family.
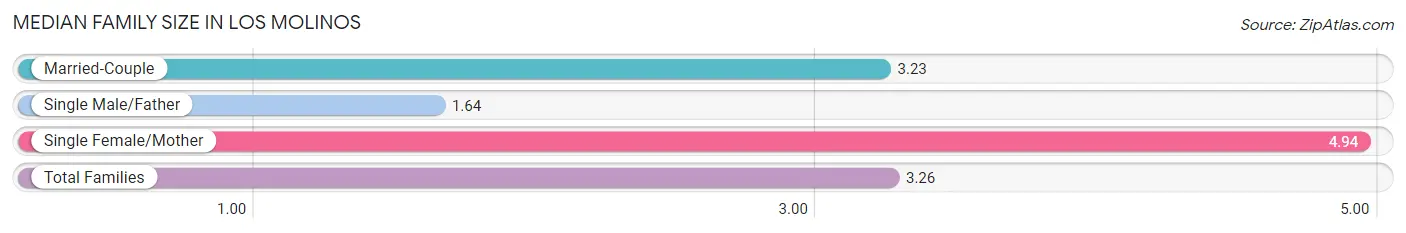
| Family Type | # Families | Family Size |
| Married-Couple | 233 (59.1%) | 3.23 |
| Single Male/Father | 80 (20.3%) | 1.64 |
| Single Female/Mother | 81 (20.6%) | 4.94 |
| Total Families | 394 (100.0%) | 3.26 |
Median Household Size in Los Molinos
The median household size in Los Molinos is 2.39 persons per household, with single female/mother households (81 | 11.7%) accounting for the largest median household size of 5.33 persons per household. non-family households (297 | 43.0%) represent the smallest median household size with 1.01 persons per household.
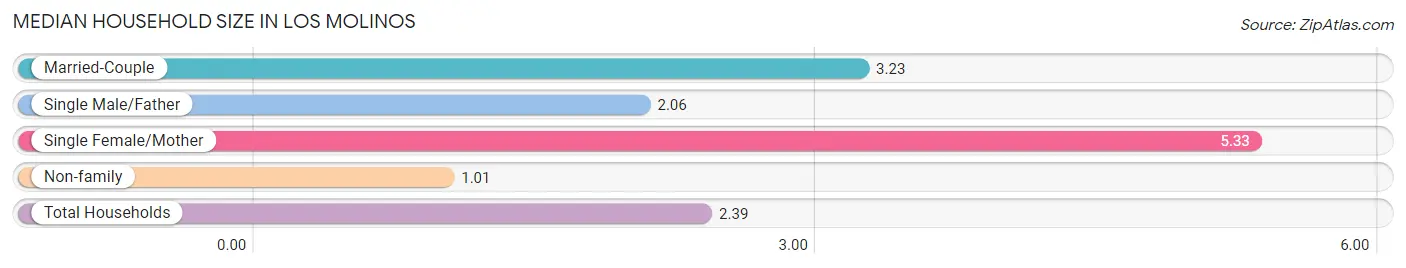
| Household Type | # Households | Household Size |
| Married-Couple | 233 (33.7%) | 3.23 |
| Single Male/Father | 80 (11.6%) | 2.06 |
| Single Female/Mother | 81 (11.7%) | 5.33 |
| Non-family | 297 (43.0%) | 1.01 |
| Total Households | 691 (100.0%) | 2.39 |
Household Size by Marriage Status in Los Molinos
Out of a total of 691 households in Los Molinos, 394 (57.0%) are family households, while 297 (43.0%) are nonfamily households. The most numerous type of family households are 2-person households, comprising 166, and the most common type of nonfamily households are 1-person households, comprising 295.
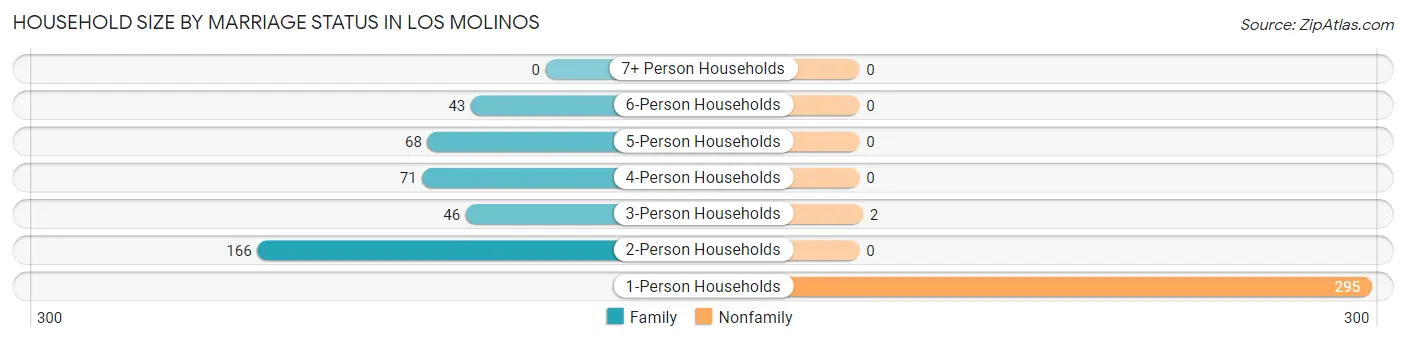
| Household Size | Family Households | Nonfamily Households |
| 1-Person Households | - | 295 (42.7%) |
| 2-Person Households | 166 (24.0%) | 0 (0.0%) |
| 3-Person Households | 46 (6.7%) | 2 (0.3%) |
| 4-Person Households | 71 (10.3%) | 0 (0.0%) |
| 5-Person Households | 68 (9.8%) | 0 (0.0%) |
| 6-Person Households | 43 (6.2%) | 0 (0.0%) |
| 7+ Person Households | 0 (0.0%) | 0 (0.0%) |
| Total | 394 (57.0%) | 297 (43.0%) |
Female Fertility in Los Molinos
Fertility by Age in Los Molinos
Average fertility rate in Los Molinos is 9.0 births per 1,000 women. Women in the age bracket of 35 to 50 years have the highest fertility rate with 15.0 births per 1,000 women. Women in the age bracket of 35 to 50 years acount for 100.0% of all women with births.
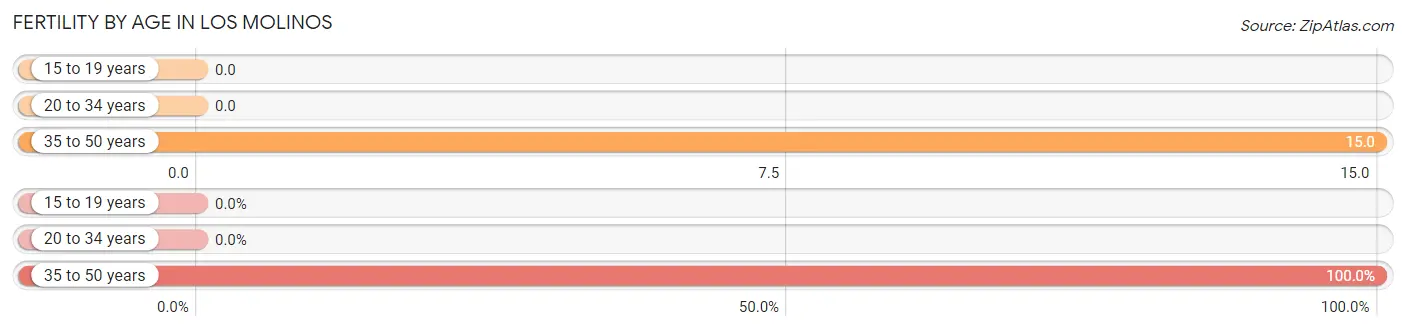
| Age Bracket | Women with Births | Births / 1,000 Women |
| 15 to 19 years | 0 (0.0%) | 0.0 |
| 20 to 34 years | 0 (0.0%) | 0.0 |
| 35 to 50 years | 4 (100.0%) | 15.0 |
| Total | 4 (100.0%) | 9.0 |
Fertility by Age by Marriage Status in Los Molinos
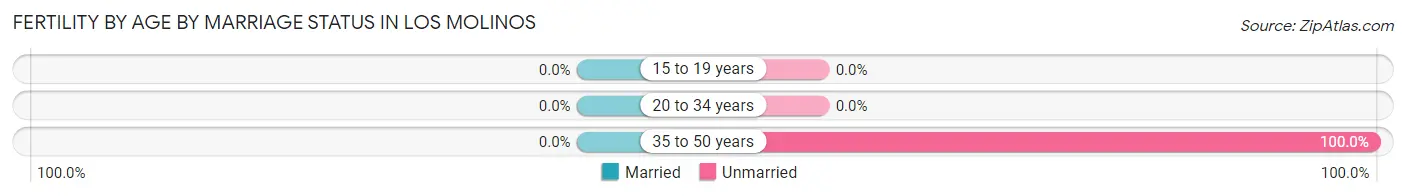
| Age Bracket | Married | Unmarried |
| 15 to 19 years | 0 (0.0%) | 0 (0.0%) |
| 20 to 34 years | 0 (0.0%) | 0 (0.0%) |
| 35 to 50 years | 0 (0.0%) | 4 (100.0%) |
| Total | 0 (0.0%) | 4 (100.0%) |
Fertility by Education in Los Molinos
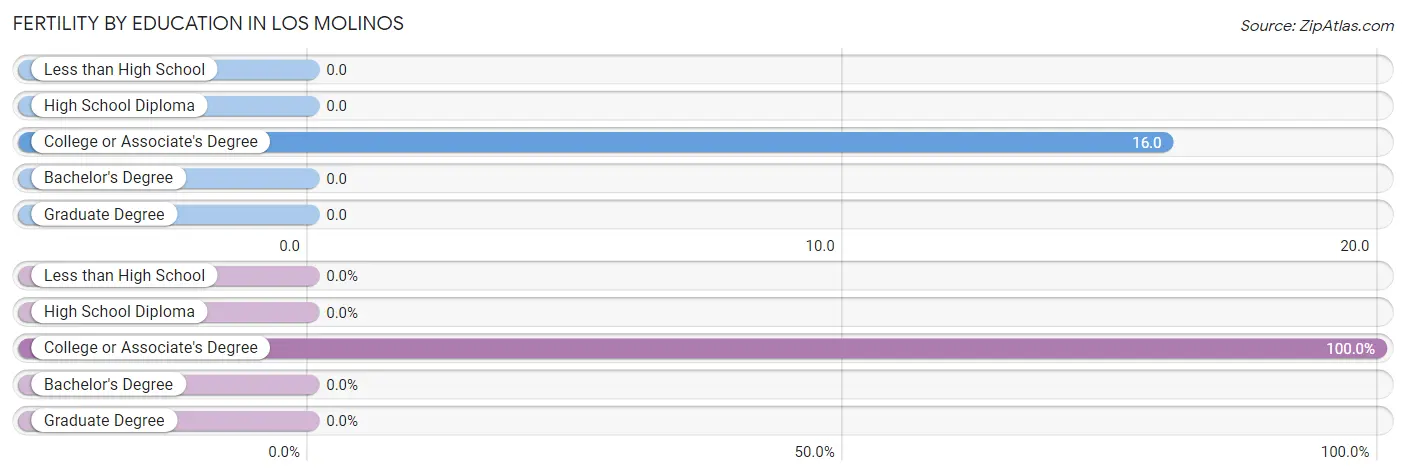
| Educational Attainment | Women with Births | Births / 1,000 Women |
| Less than High School | 0 (0.0%) | 0.0 |
| High School Diploma | 0 (0.0%) | 0.0 |
| College or Associate's Degree | 4 (100.0%) | 16.0 |
| Bachelor's Degree | 0 (0.0%) | 0.0 |
| Graduate Degree | 0 (0.0%) | 0.0 |
| Total | 4 (100.0%) | 9.0 |
Fertility by Education by Marriage Status in Los Molinos
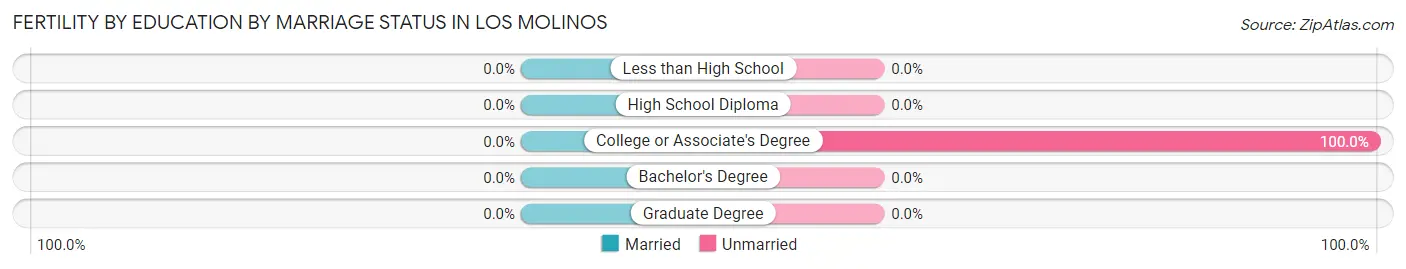
| Educational Attainment | Married | Unmarried |
| Less than High School | 0 (0.0%) | 0 (0.0%) |
| High School Diploma | 0 (0.0%) | 0 (0.0%) |
| College or Associate's Degree | 0 (0.0%) | 4 (100.0%) |
| Bachelor's Degree | 0 (0.0%) | 0 (0.0%) |
| Graduate Degree | 0 (0.0%) | 0 (0.0%) |
| Total | 0 (0.0%) | 4 (100.0%) |
Employment Characteristics in Los Molinos
Employment by Class of Employer in Los Molinos
Among the 510 employed individuals in Los Molinos, private company employees (235 | 46.1%), local government employees (145 | 28.4%), and self-employed (not incorporated) (45 | 8.8%) make up the most common classes of employment.
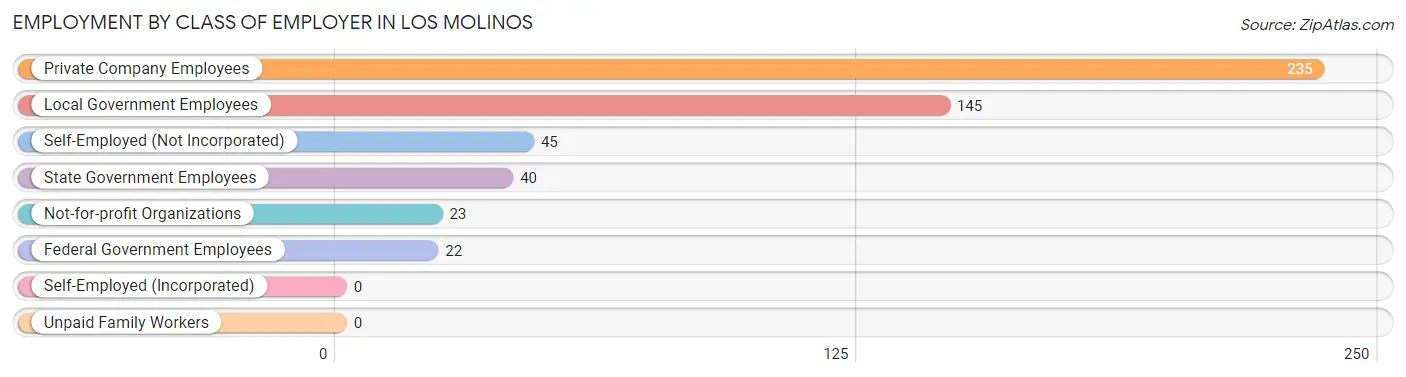
| Employer Class | # Employees | % Employees |
| Private Company Employees | 235 | 46.1% |
| Self-Employed (Incorporated) | 0 | 0.0% |
| Self-Employed (Not Incorporated) | 45 | 8.8% |
| Not-for-profit Organizations | 23 | 4.5% |
| Local Government Employees | 145 | 28.4% |
| State Government Employees | 40 | 7.8% |
| Federal Government Employees | 22 | 4.3% |
| Unpaid Family Workers | 0 | 0.0% |
| Total | 510 | 100.0% |
Employment Status by Age in Los Molinos
According to the labor force statistics for Los Molinos, out of the total population over 16 years of age (1,197), 49.6% or 594 individuals are in the labor force, with 10.8% or 64 of them unemployed. The age group with the highest labor force participation rate is 30 to 34 years, with 100.0% or 37 individuals in the labor force. Within the labor force, the 55 to 59 years age range has the highest percentage of unemployed individuals, with 34.3% or 12 of them being unemployed.
| Age Bracket | In Labor Force | Unemployed |
| 16 to 19 Years | 0 (0.0%) | 0 (0.0%) |
| 20 to 24 Years | 85 (79.4%) | 0 (0.0%) |
| 25 to 29 Years | 75 (57.3%) | 0 (0.0%) |
| 30 to 34 Years | 37 (100.0%) | 0 (0.0%) |
| 35 to 44 Years | 162 (69.5%) | 50 (30.9%) |
| 45 to 54 Years | 145 (64.7%) | 0 (0.0%) |
| 55 to 59 Years | 35 (85.4%) | 12 (34.3%) |
| 60 to 64 Years | 23 (34.8%) | 0 (0.0%) |
| 65 to 74 Years | 32 (19.9%) | 0 (0.0%) |
| 75 Years and over | 0 (0.0%) | 0 (0.0%) |
| Total | 594 (49.6%) | 64 (10.8%) |
Employment Status by Educational Attainment in Los Molinos
According to labor force statistics for Los Molinos, 65.2% of individuals (477) out of the total population between 25 and 64 years of age (732) are in the labor force, with 13.0% or 62 of them being unemployed. The group with the highest labor force participation rate are those with the educational attainment of less than high school, with 100.0% or 65 individuals in the labor force. Within the labor force, individuals with college / associate degree education have the highest percentage of unemployment, with 27.4% or 62 of them being unemployed.
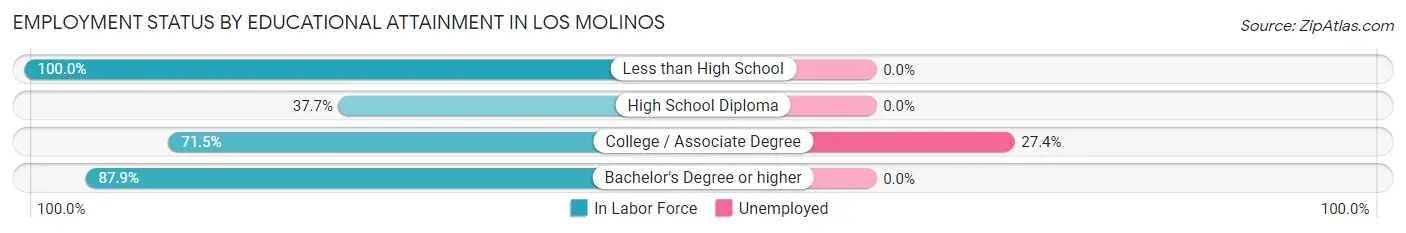
| Educational Attainment | In Labor Force | Unemployed |
| Less than High School | 65 (100.0%) | 0 (0.0%) |
| High School Diploma | 92 (37.7%) | 0 (0.0%) |
| College / Associate Degree | 226 (71.5%) | 87 (27.4%) |
| Bachelor's Degree or higher | 94 (87.9%) | 0 (0.0%) |
| Total | 477 (65.2%) | 95 (13.0%) |
Employment Occupations by Sex in Los Molinos
Management, Business, Science and Arts Occupations
The most common Management, Business, Science and Arts occupations in Los Molinos are Computers, Engineering & Science (69 | 13.5%), Computers & Mathematics (69 | 13.5%), Community & Social Service (68 | 13.3%), Education Instruction & Library (68 | 13.3%), and Business & Financial (61 | 12.0%).
Management, Business, Science and Arts Occupations by Sex
Within the Management, Business, Science and Arts occupations in Los Molinos, the most male-oriented occupations are Computers, Engineering & Science (55.1%), Computers & Mathematics (55.1%), and Business & Financial (50.8%), while the most female-oriented occupations are Health Diagnosing & Treating (100.0%), Community & Social Service (60.3%), and Education Instruction & Library (60.3%).
| Occupation | Male | Female |
| Management | 0 (0.0%) | 0 (0.0%) |
| Business & Financial | 31 (50.8%) | 30 (49.2%) |
| Computers, Engineering & Science | 38 (55.1%) | 31 (44.9%) |
| Computers & Mathematics | 38 (55.1%) | 31 (44.9%) |
| Architecture & Engineering | 0 (0.0%) | 0 (0.0%) |
| Life, Physical & Social Science | 0 (0.0%) | 0 (0.0%) |
| Community & Social Service | 27 (39.7%) | 41 (60.3%) |
| Education, Arts & Media | 0 (0.0%) | 0 (0.0%) |
| Legal Services & Support | 0 (0.0%) | 0 (0.0%) |
| Education Instruction & Library | 27 (39.7%) | 41 (60.3%) |
| Arts, Media & Entertainment | 0 (0.0%) | 0 (0.0%) |
| Health Diagnosing & Treating | 0 (0.0%) | 46 (100.0%) |
| Health Technologists | 0 (0.0%) | 0 (0.0%) |
| Total (Category) | 96 (39.3%) | 148 (60.7%) |
| Total (Overall) | 224 (43.9%) | 286 (56.1%) |
Services Occupations
The most common Services occupations in Los Molinos are Healthcare Support (40 | 7.8%), Cleaning & Maintenance (21 | 4.1%), and Food Preparation & Serving (11 | 2.2%).
Services Occupations by Sex
| Occupation | Male | Female |
| Healthcare Support | 0 (0.0%) | 40 (100.0%) |
| Security & Protection | 0 (0.0%) | 0 (0.0%) |
| Firefighting & Prevention | 0 (0.0%) | 0 (0.0%) |
| Law Enforcement | 0 (0.0%) | 0 (0.0%) |
| Food Preparation & Serving | 11 (100.0%) | 0 (0.0%) |
| Cleaning & Maintenance | 21 (100.0%) | 0 (0.0%) |
| Personal Care & Service | 0 (0.0%) | 0 (0.0%) |
| Total (Category) | 32 (44.4%) | 40 (55.6%) |
| Total (Overall) | 224 (43.9%) | 286 (56.1%) |
Sales and Office Occupations
The most common Sales and Office occupations in Los Molinos are Office & Administration (72 | 14.1%), and Sales & Related (17 | 3.3%).
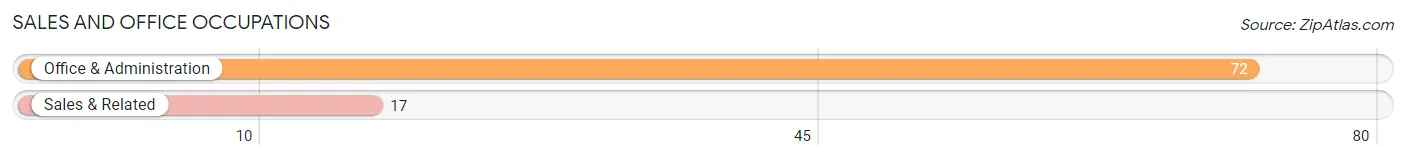
Sales and Office Occupations by Sex
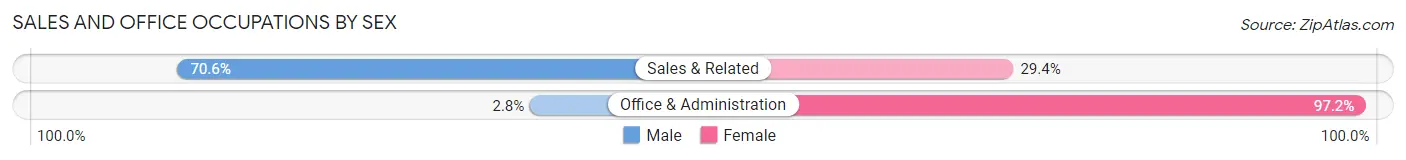
| Occupation | Male | Female |
| Sales & Related | 12 (70.6%) | 5 (29.4%) |
| Office & Administration | 2 (2.8%) | 70 (97.2%) |
| Total (Category) | 14 (15.7%) | 75 (84.3%) |
| Total (Overall) | 224 (43.9%) | 286 (56.1%) |
Natural Resources, Construction and Maintenance Occupations
The most common Natural Resources, Construction and Maintenance occupations in Los Molinos are Construction & Extraction (45 | 8.8%), Farming, Fishing & Forestry (23 | 4.5%), and Installation, Maintenance & Repair (6 | 1.2%).
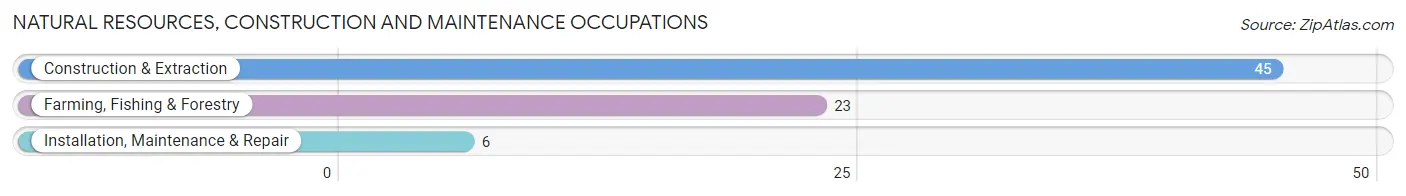
Natural Resources, Construction and Maintenance Occupations by Sex
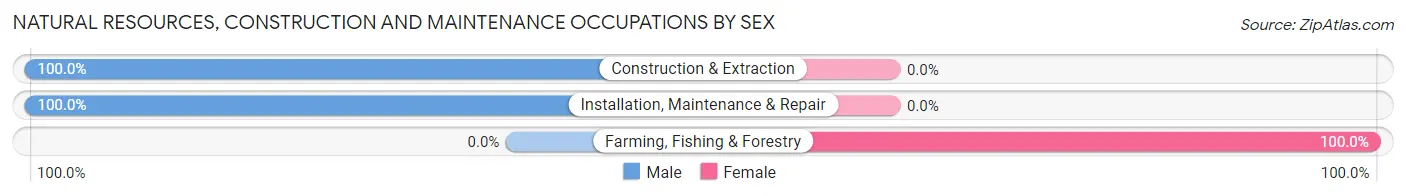
| Occupation | Male | Female |
| Farming, Fishing & Forestry | 0 (0.0%) | 23 (100.0%) |
| Construction & Extraction | 45 (100.0%) | 0 (0.0%) |
| Installation, Maintenance & Repair | 6 (100.0%) | 0 (0.0%) |
| Total (Category) | 51 (68.9%) | 23 (31.1%) |
| Total (Overall) | 224 (43.9%) | 286 (56.1%) |
Production, Transportation and Moving Occupations
The most common Production, Transportation and Moving occupations in Los Molinos are Production (16 | 3.1%), and Transportation (15 | 2.9%).
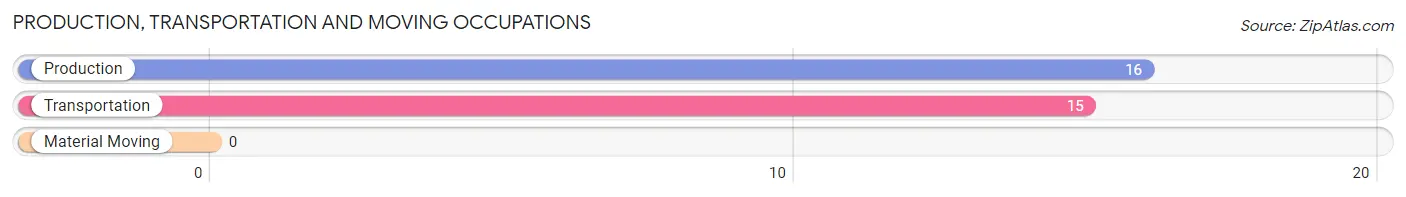
Production, Transportation and Moving Occupations by Sex
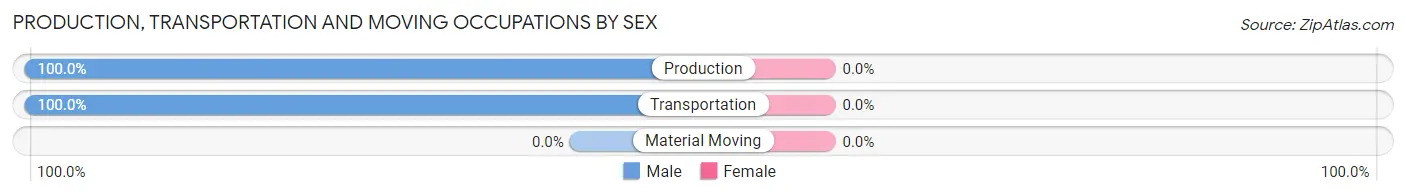
| Occupation | Male | Female |
| Production | 16 (100.0%) | 0 (0.0%) |
| Transportation | 15 (100.0%) | 0 (0.0%) |
| Material Moving | 0 (0.0%) | 0 (0.0%) |
| Total (Category) | 31 (100.0%) | 0 (0.0%) |
| Total (Overall) | 224 (43.9%) | 286 (56.1%) |
Employment Industries by Sex in Los Molinos
Employment Industries in Los Molinos
The major employment industries in Los Molinos include Educational Services (89 | 17.4%), Public Administration (81 | 15.9%), Health Care & Social Assistance (68 | 13.3%), Finance & Insurance (53 | 10.4%), and Construction (45 | 8.8%).
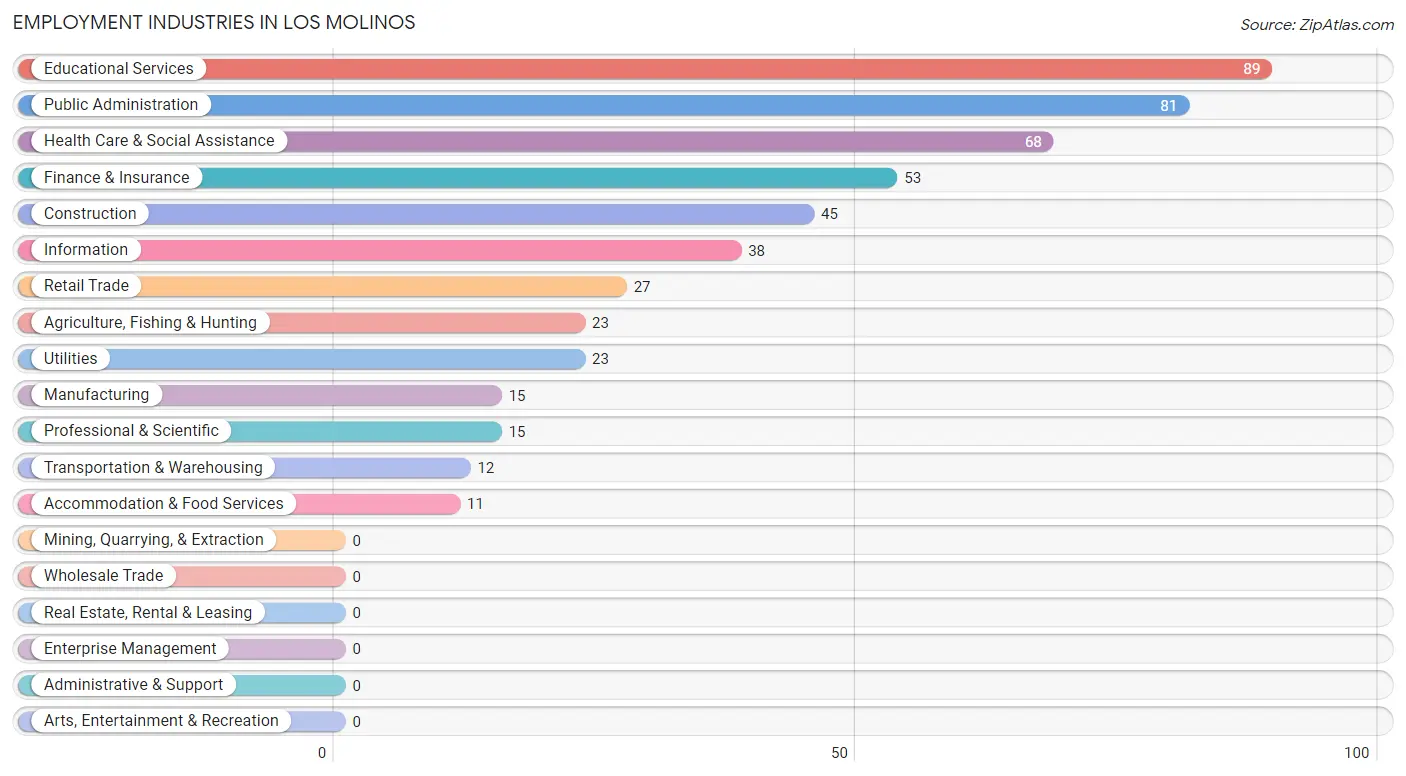
Employment Industries by Sex in Los Molinos
The Los Molinos industries that see more men than women are Construction (100.0%), Manufacturing (100.0%), and Transportation & Warehousing (100.0%), whereas the industries that tend to have a higher number of women are Agriculture, Fishing & Hunting (100.0%), Utilities (100.0%), and Professional & Scientific (100.0%).
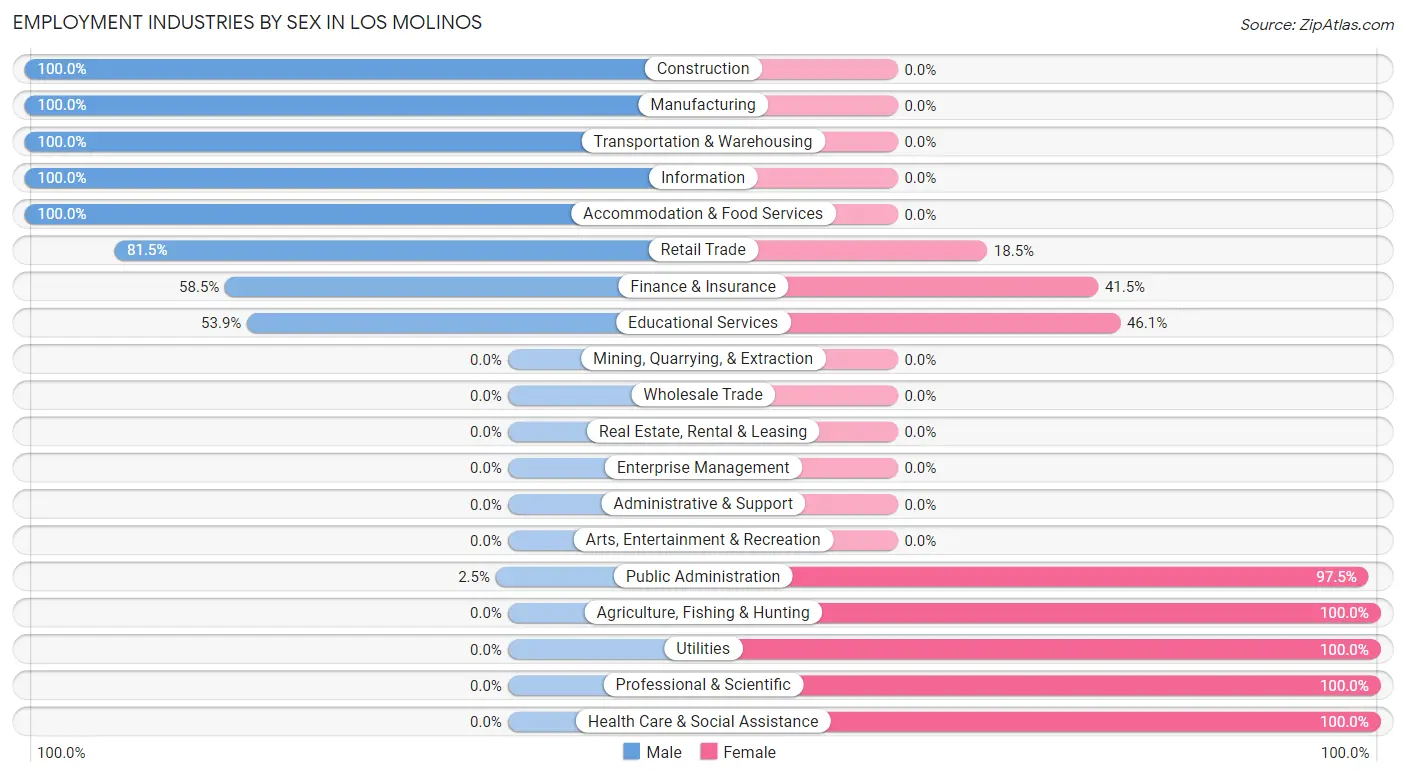
| Industry | Male | Female |
| Agriculture, Fishing & Hunting | 0 (0.0%) | 23 (100.0%) |
| Mining, Quarrying, & Extraction | 0 (0.0%) | 0 (0.0%) |
| Construction | 45 (100.0%) | 0 (0.0%) |
| Manufacturing | 15 (100.0%) | 0 (0.0%) |
| Wholesale Trade | 0 (0.0%) | 0 (0.0%) |
| Retail Trade | 22 (81.5%) | 5 (18.5%) |
| Transportation & Warehousing | 12 (100.0%) | 0 (0.0%) |
| Utilities | 0 (0.0%) | 23 (100.0%) |
| Information | 38 (100.0%) | 0 (0.0%) |
| Finance & Insurance | 31 (58.5%) | 22 (41.5%) |
| Real Estate, Rental & Leasing | 0 (0.0%) | 0 (0.0%) |
| Professional & Scientific | 0 (0.0%) | 15 (100.0%) |
| Enterprise Management | 0 (0.0%) | 0 (0.0%) |
| Administrative & Support | 0 (0.0%) | 0 (0.0%) |
| Educational Services | 48 (53.9%) | 41 (46.1%) |
| Health Care & Social Assistance | 0 (0.0%) | 68 (100.0%) |
| Arts, Entertainment & Recreation | 0 (0.0%) | 0 (0.0%) |
| Accommodation & Food Services | 11 (100.0%) | 0 (0.0%) |
| Public Administration | 2 (2.5%) | 79 (97.5%) |
| Total | 224 (43.9%) | 286 (56.1%) |
Education in Los Molinos
School Enrollment in Los Molinos
The most common levels of schooling among the 528 students in Los Molinos are high school (144 | 27.3%), middle school (117 | 22.2%), and elementary school (95 | 18.0%).
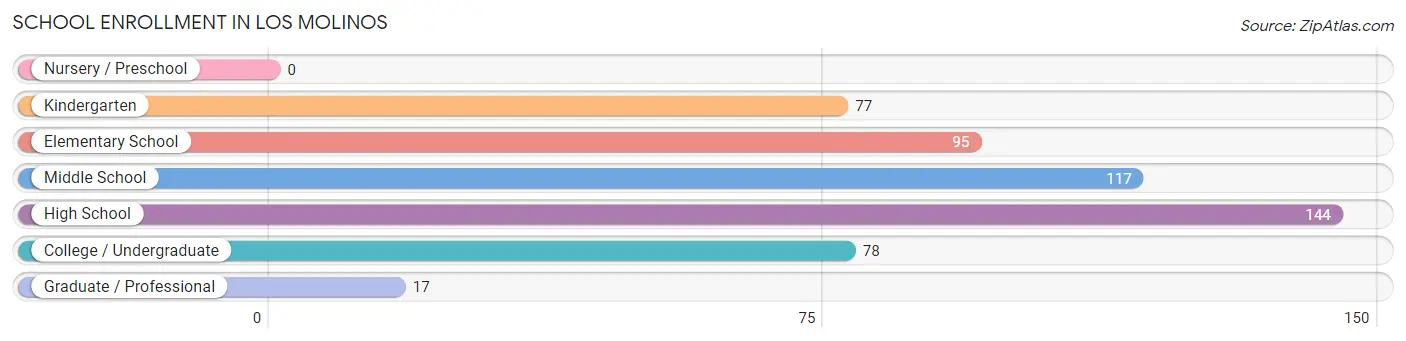
| School Level | # Students | % Students |
| Nursery / Preschool | 0 | 0.0% |
| Kindergarten | 77 | 14.6% |
| Elementary School | 95 | 18.0% |
| Middle School | 117 | 22.2% |
| High School | 144 | 27.3% |
| College / Undergraduate | 78 | 14.8% |
| Graduate / Professional | 17 | 3.2% |
| Total | 528 | 100.0% |
School Enrollment by Age by Funding Source in Los Molinos
Out of a total of 528 students who are enrolled in schools in Los Molinos, 10 (1.9%) attend a private institution, while the remaining 518 (98.1%) are enrolled in public schools. The age group of 35 years and over has the highest likelihood of being enrolled in private schools, with 10 (32.3% in the age bracket) enrolled. Conversely, the age group of 5 to 9 year old has the lowest likelihood of being enrolled in a private school, with 172 (100.0% in the age bracket) attending a public institution.
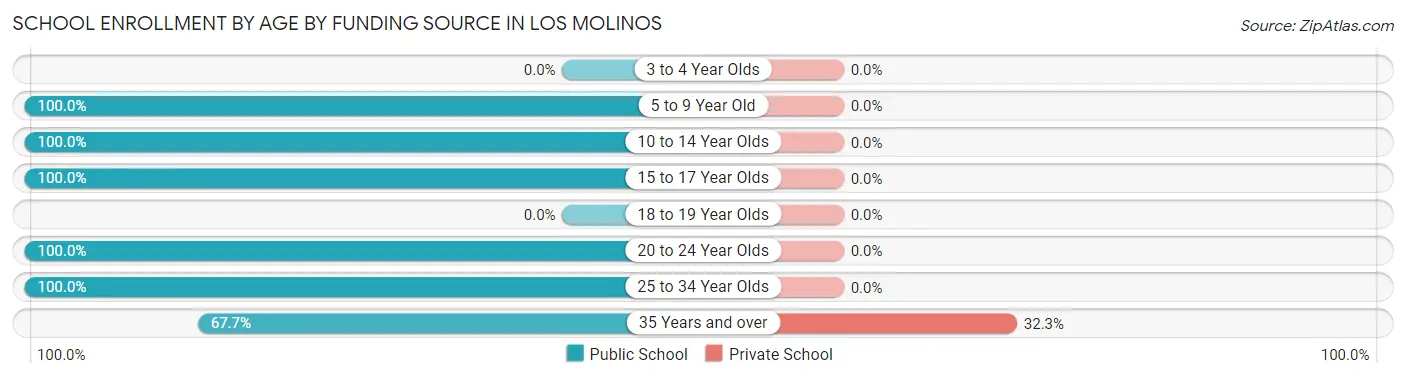
| Age Bracket | Public School | Private School |
| 3 to 4 Year Olds | 0 (0.0%) | 0 (0.0%) |
| 5 to 9 Year Old | 172 (100.0%) | 0 (0.0%) |
| 10 to 14 Year Olds | 156 (100.0%) | 0 (0.0%) |
| 15 to 17 Year Olds | 125 (100.0%) | 0 (0.0%) |
| 18 to 19 Year Olds | 0 (0.0%) | 0 (0.0%) |
| 20 to 24 Year Olds | 22 (100.0%) | 0 (0.0%) |
| 25 to 34 Year Olds | 22 (100.0%) | 0 (0.0%) |
| 35 Years and over | 21 (67.7%) | 10 (32.3%) |
| Total | 518 (98.1%) | 10 (1.9%) |
Educational Attainment by Field of Study in Los Molinos
Business (34 | 22.2%), social sciences (31 | 20.3%), liberal arts & history (22 | 14.4%), bio, nature & agricultural (17 | 11.1%), and education (15 | 9.8%) are the most common fields of study among 153 individuals in Los Molinos who have obtained a bachelor's degree or higher.
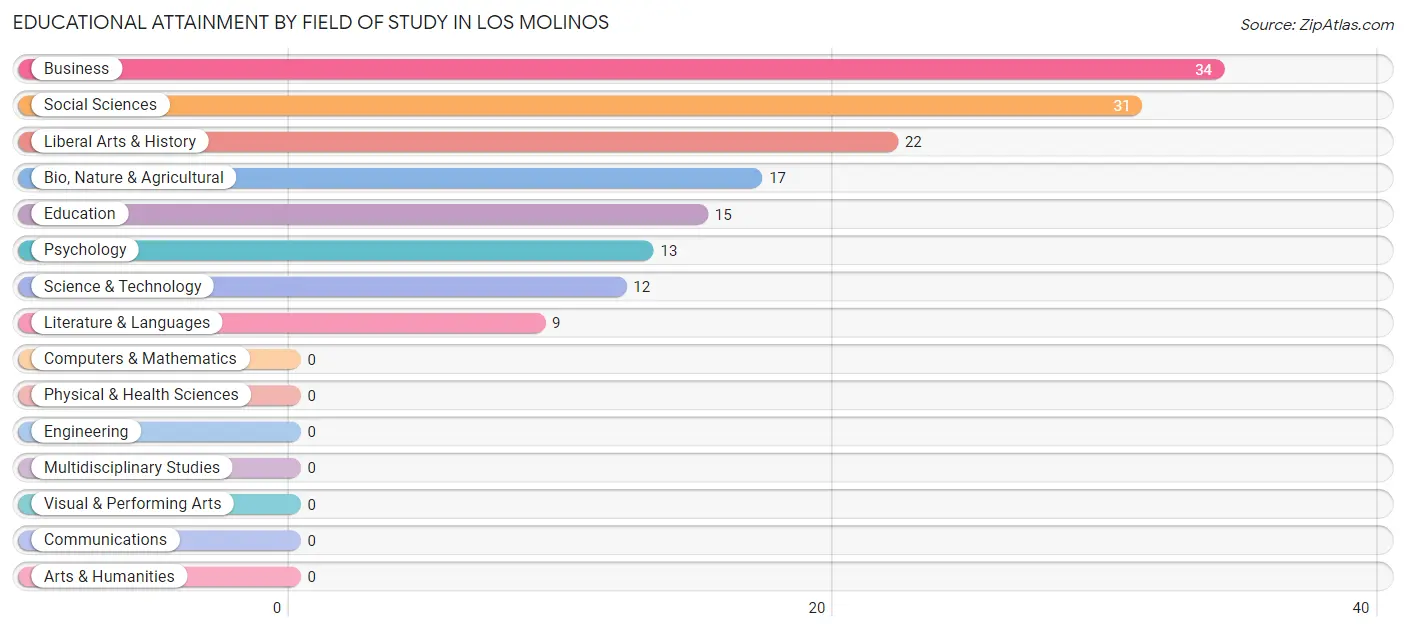
| Field of Study | # Graduates | % Graduates |
| Computers & Mathematics | 0 | 0.0% |
| Bio, Nature & Agricultural | 17 | 11.1% |
| Physical & Health Sciences | 0 | 0.0% |
| Psychology | 13 | 8.5% |
| Social Sciences | 31 | 20.3% |
| Engineering | 0 | 0.0% |
| Multidisciplinary Studies | 0 | 0.0% |
| Science & Technology | 12 | 7.8% |
| Business | 34 | 22.2% |
| Education | 15 | 9.8% |
| Literature & Languages | 9 | 5.9% |
| Liberal Arts & History | 22 | 14.4% |
| Visual & Performing Arts | 0 | 0.0% |
| Communications | 0 | 0.0% |
| Arts & Humanities | 0 | 0.0% |
| Total | 153 | 100.0% |
Transportation & Commute in Los Molinos
Vehicle Availability by Sex in Los Molinos
The most prevalent vehicle ownership categories in Los Molinos are males with 2 vehicles (97, accounting for 39.4%) and females with 2 vehicles (76, making up 36.7%).
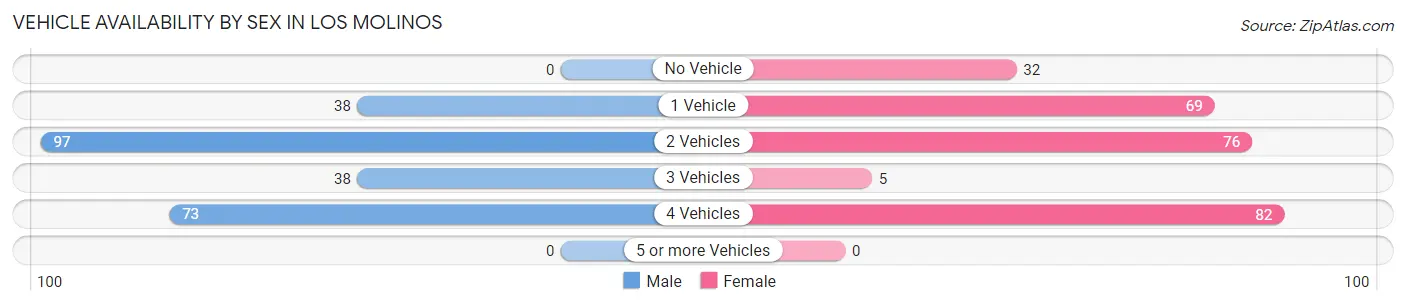
| Vehicles Available | Male | Female |
| No Vehicle | 0 (0.0%) | 32 (12.1%) |
| 1 Vehicle | 38 (15.4%) | 69 (26.1%) |
| 2 Vehicles | 97 (39.4%) | 76 (28.8%) |
| 3 Vehicles | 38 (15.4%) | 5 (1.9%) |
| 4 Vehicles | 73 (29.7%) | 82 (31.1%) |
| 5 or more Vehicles | 0 (0.0%) | 0 (0.0%) |
| Total | 246 (100.0%) | 264 (100.0%) |
Commute Time in Los Molinos
The most frequently occuring commute durations in Los Molinos are 10 to 14 minutes (83 commuters, 17.3%), 60 to 89 minutes (76 commuters, 15.9%), and 25 to 29 minutes (74 commuters, 15.4%).
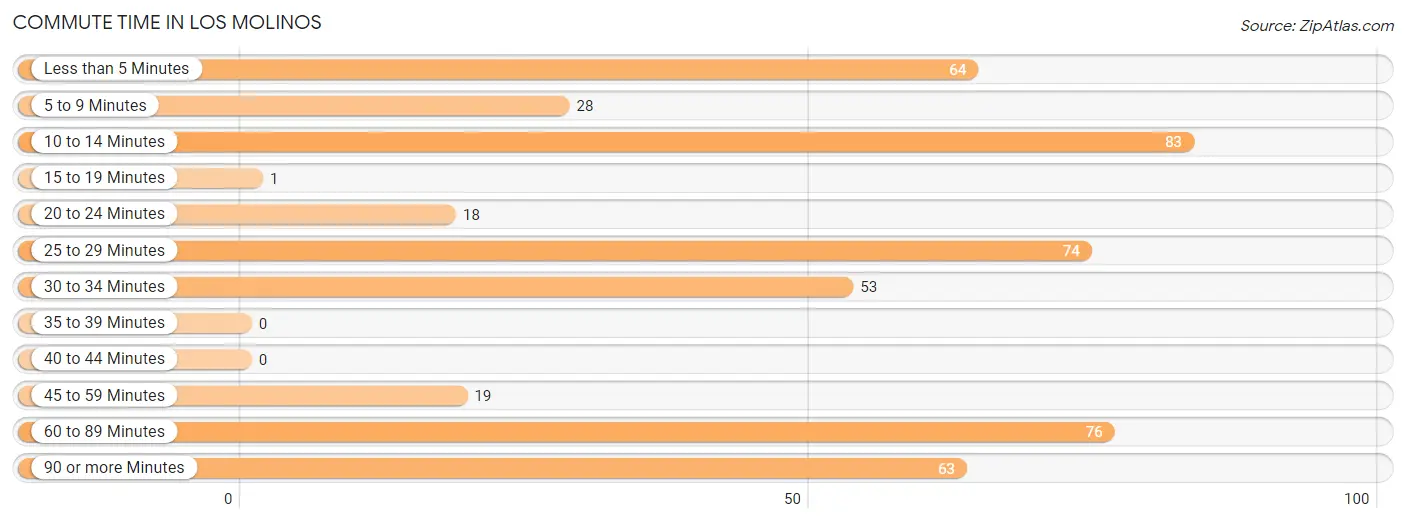
| Commute Time | # Commuters | % Commuters |
| Less than 5 Minutes | 64 | 13.4% |
| 5 to 9 Minutes | 28 | 5.9% |
| 10 to 14 Minutes | 83 | 17.3% |
| 15 to 19 Minutes | 1 | 0.2% |
| 20 to 24 Minutes | 18 | 3.8% |
| 25 to 29 Minutes | 74 | 15.4% |
| 30 to 34 Minutes | 53 | 11.1% |
| 35 to 39 Minutes | 0 | 0.0% |
| 40 to 44 Minutes | 0 | 0.0% |
| 45 to 59 Minutes | 19 | 4.0% |
| 60 to 89 Minutes | 76 | 15.9% |
| 90 or more Minutes | 63 | 13.2% |
Commute Time by Sex in Los Molinos
The most common commute times in Los Molinos are 30 to 34 minutes (53 commuters, 21.5%) for males and 60 to 89 minutes (54 commuters, 23.2%) for females.
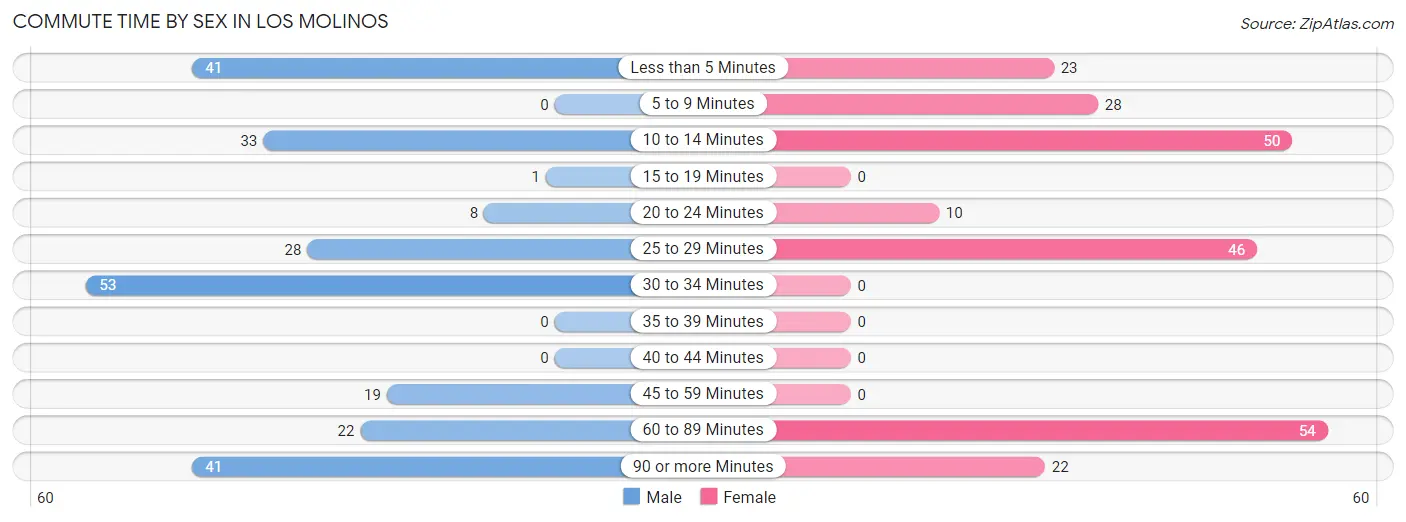
| Commute Time | Male | Female |
| Less than 5 Minutes | 41 (16.7%) | 23 (9.9%) |
| 5 to 9 Minutes | 0 (0.0%) | 28 (12.0%) |
| 10 to 14 Minutes | 33 (13.4%) | 50 (21.5%) |
| 15 to 19 Minutes | 1 (0.4%) | 0 (0.0%) |
| 20 to 24 Minutes | 8 (3.3%) | 10 (4.3%) |
| 25 to 29 Minutes | 28 (11.4%) | 46 (19.7%) |
| 30 to 34 Minutes | 53 (21.5%) | 0 (0.0%) |
| 35 to 39 Minutes | 0 (0.0%) | 0 (0.0%) |
| 40 to 44 Minutes | 0 (0.0%) | 0 (0.0%) |
| 45 to 59 Minutes | 19 (7.7%) | 0 (0.0%) |
| 60 to 89 Minutes | 22 (8.9%) | 54 (23.2%) |
| 90 or more Minutes | 41 (16.7%) | 22 (9.4%) |
Time of Departure to Work by Sex in Los Molinos
The most frequent times of departure to work in Los Molinos are 6:00 AM to 6:29 AM (59, 24.0%) for males and 7:30 AM to 7:59 AM (74, 31.8%) for females.
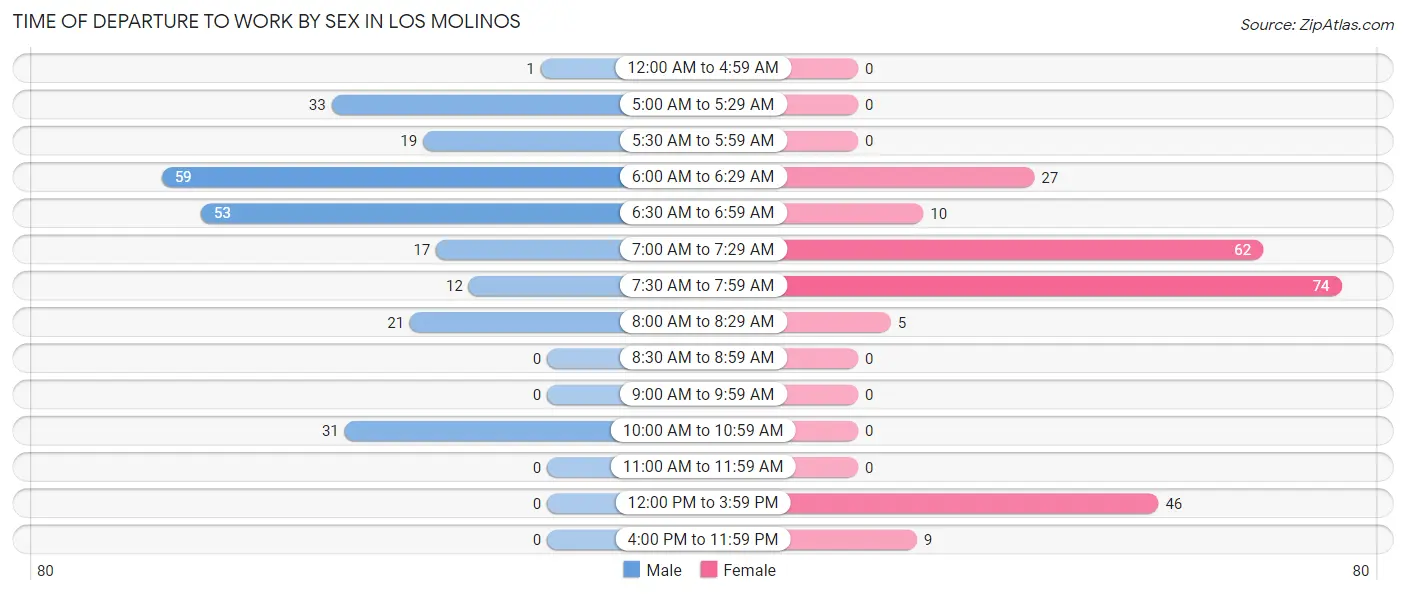
| Time of Departure | Male | Female |
| 12:00 AM to 4:59 AM | 1 (0.4%) | 0 (0.0%) |
| 5:00 AM to 5:29 AM | 33 (13.4%) | 0 (0.0%) |
| 5:30 AM to 5:59 AM | 19 (7.7%) | 0 (0.0%) |
| 6:00 AM to 6:29 AM | 59 (24.0%) | 27 (11.6%) |
| 6:30 AM to 6:59 AM | 53 (21.5%) | 10 (4.3%) |
| 7:00 AM to 7:29 AM | 17 (6.9%) | 62 (26.6%) |
| 7:30 AM to 7:59 AM | 12 (4.9%) | 74 (31.8%) |
| 8:00 AM to 8:29 AM | 21 (8.5%) | 5 (2.1%) |
| 8:30 AM to 8:59 AM | 0 (0.0%) | 0 (0.0%) |
| 9:00 AM to 9:59 AM | 0 (0.0%) | 0 (0.0%) |
| 10:00 AM to 10:59 AM | 31 (12.6%) | 0 (0.0%) |
| 11:00 AM to 11:59 AM | 0 (0.0%) | 0 (0.0%) |
| 12:00 PM to 3:59 PM | 0 (0.0%) | 46 (19.7%) |
| 4:00 PM to 11:59 PM | 0 (0.0%) | 9 (3.9%) |
| Total | 246 (100.0%) | 233 (100.0%) |
Housing Occupancy in Los Molinos
Occupancy by Ownership in Los Molinos
Of the total 691 dwellings in Los Molinos, owner-occupied units account for 405 (58.6%), while renter-occupied units make up 286 (41.4%).
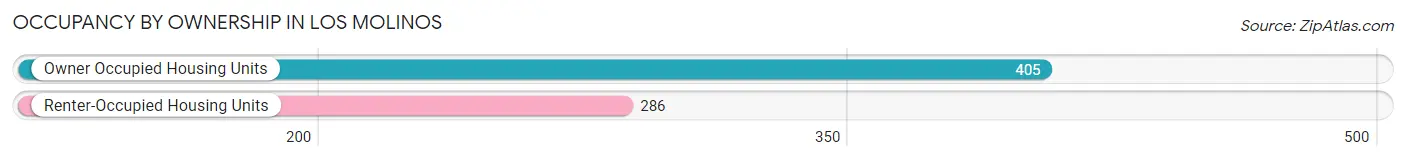
| Occupancy | # Housing Units | % Housing Units |
| Owner Occupied Housing Units | 405 | 58.6% |
| Renter-Occupied Housing Units | 286 | 41.4% |
| Total Occupied Housing Units | 691 | 100.0% |
Occupancy by Household Size in Los Molinos
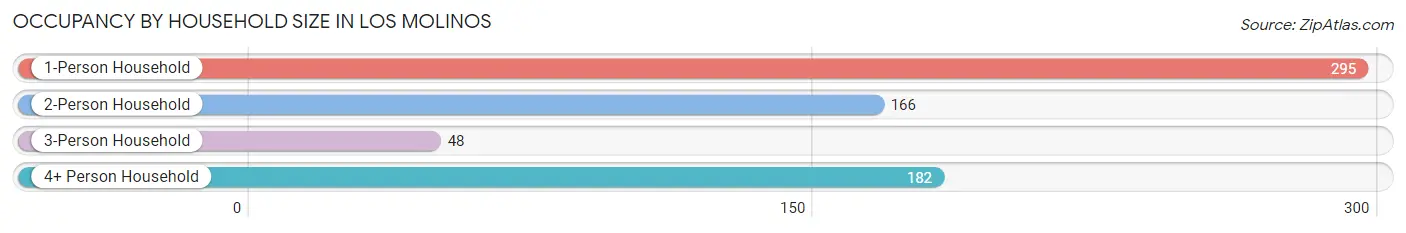
| Household Size | # Housing Units | % Housing Units |
| 1-Person Household | 295 | 42.7% |
| 2-Person Household | 166 | 24.0% |
| 3-Person Household | 48 | 7.0% |
| 4+ Person Household | 182 | 26.3% |
| Total Housing Units | 691 | 100.0% |
Occupancy by Ownership by Household Size in Los Molinos
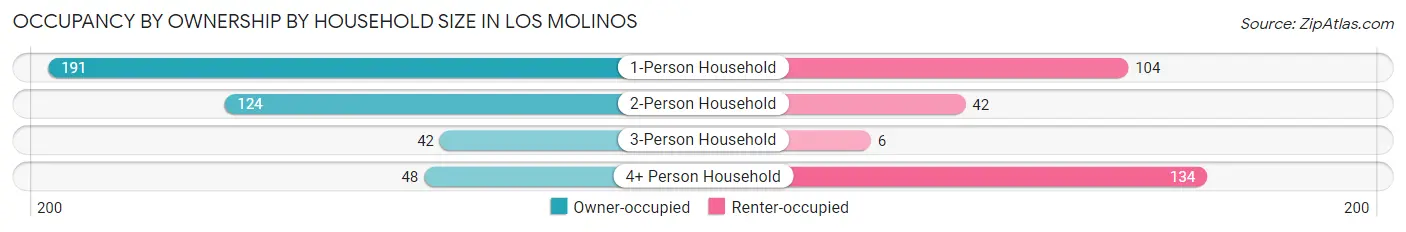
| Household Size | Owner-occupied | Renter-occupied |
| 1-Person Household | 191 (64.7%) | 104 (35.2%) |
| 2-Person Household | 124 (74.7%) | 42 (25.3%) |
| 3-Person Household | 42 (87.5%) | 6 (12.5%) |
| 4+ Person Household | 48 (26.4%) | 134 (73.6%) |
| Total Housing Units | 405 (58.6%) | 286 (41.4%) |
Occupancy by Educational Attainment in Los Molinos
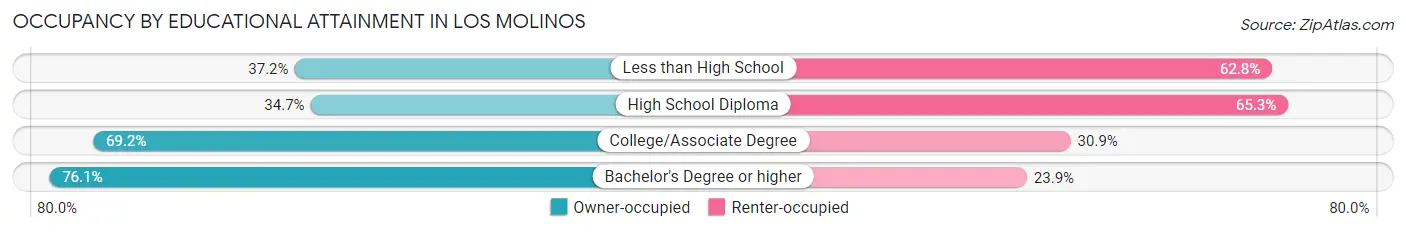
| Household Size | Owner-occupied | Renter-occupied |
| Less than High School | 32 (37.2%) | 54 (62.8%) |
| High School Diploma | 52 (34.7%) | 98 (65.3%) |
| College/Associate Degree | 251 (69.2%) | 112 (30.8%) |
| Bachelor's Degree or higher | 70 (76.1%) | 22 (23.9%) |
Occupancy by Age of Householder in Los Molinos
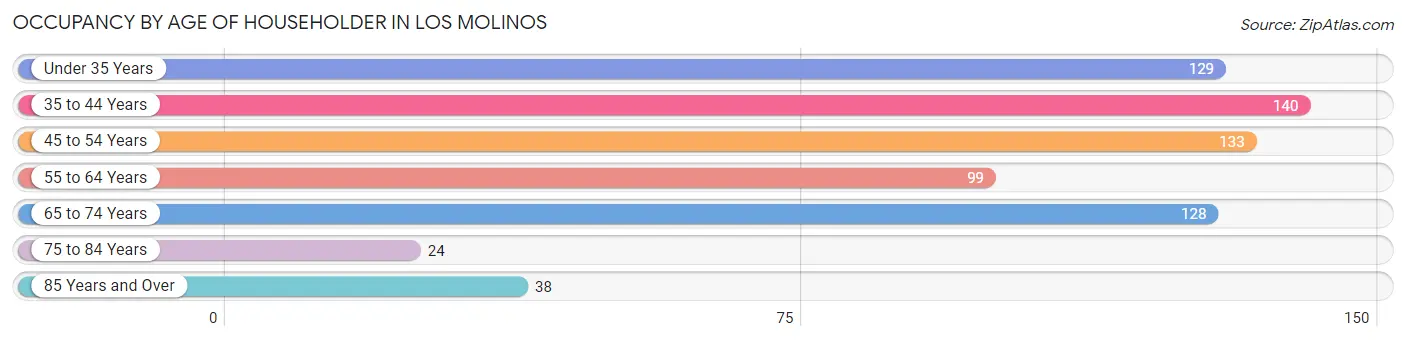
| Age Bracket | # Households | % Households |
| Under 35 Years | 129 | 18.7% |
| 35 to 44 Years | 140 | 20.3% |
| 45 to 54 Years | 133 | 19.3% |
| 55 to 64 Years | 99 | 14.3% |
| 65 to 74 Years | 128 | 18.5% |
| 75 to 84 Years | 24 | 3.5% |
| 85 Years and Over | 38 | 5.5% |
| Total | 691 | 100.0% |
Housing Finances in Los Molinos
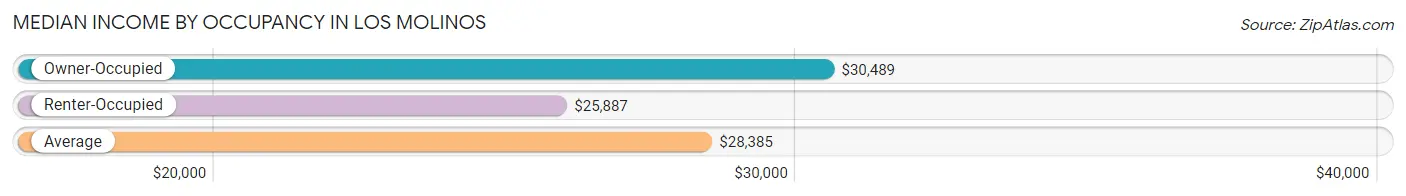
Median Income by Occupancy in Los Molinos
| Occupancy Type | # Households | Median Income |
| Owner-Occupied | 405 (58.6%) | $30,489 |
| Renter-Occupied | 286 (41.4%) | $25,887 |
| Average | 691 (100.0%) | $28,385 |
Occupancy by Householder Income Bracket in Los Molinos
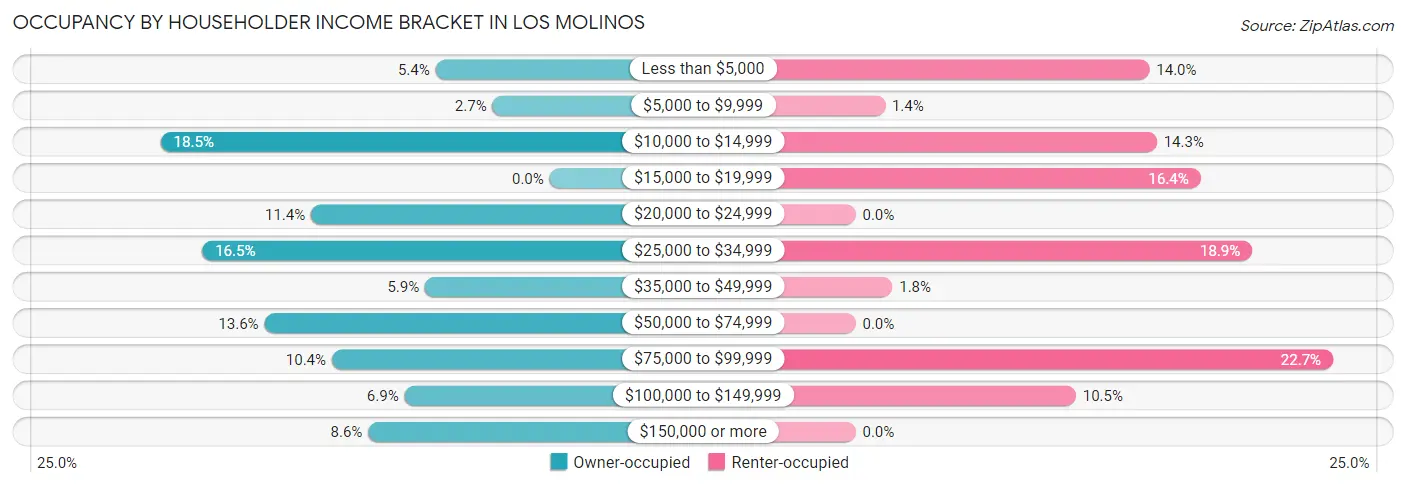
| Income Bracket | Owner-occupied | Renter-occupied |
| Less than $5,000 | 22 (5.4%) | 40 (14.0%) |
| $5,000 to $9,999 | 11 (2.7%) | 4 (1.4%) |
| $10,000 to $14,999 | 75 (18.5%) | 41 (14.3%) |
| $15,000 to $19,999 | 0 (0.0%) | 47 (16.4%) |
| $20,000 to $24,999 | 46 (11.4%) | 0 (0.0%) |
| $25,000 to $34,999 | 67 (16.5%) | 54 (18.9%) |
| $35,000 to $49,999 | 24 (5.9%) | 5 (1.8%) |
| $50,000 to $74,999 | 55 (13.6%) | 0 (0.0%) |
| $75,000 to $99,999 | 42 (10.4%) | 65 (22.7%) |
| $100,000 to $149,999 | 28 (6.9%) | 30 (10.5%) |
| $150,000 or more | 35 (8.6%) | 0 (0.0%) |
| Total | 405 (100.0%) | 286 (100.0%) |
Monthly Housing Cost Tiers in Los Molinos
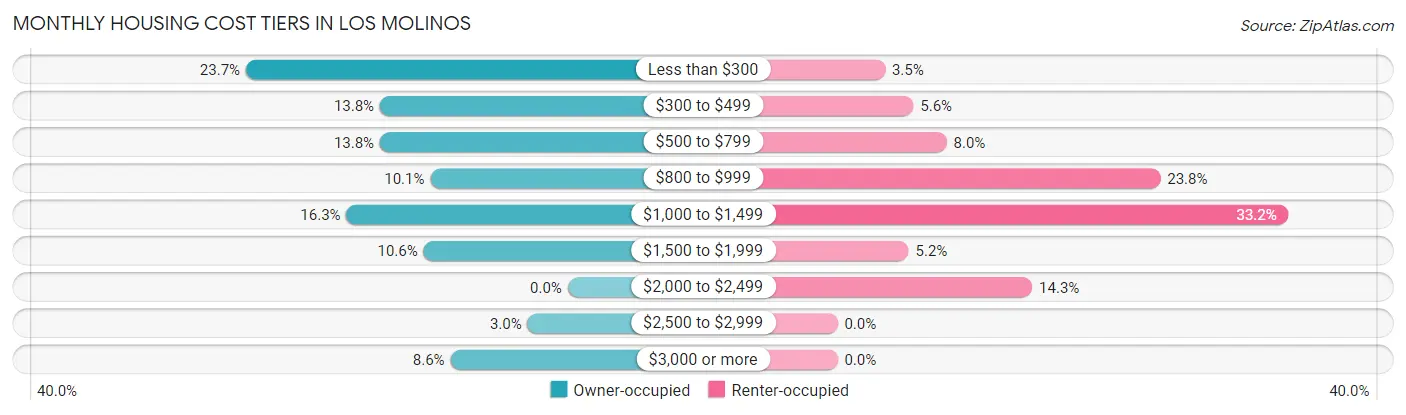
| Monthly Cost | Owner-occupied | Renter-occupied |
| Less than $300 | 96 (23.7%) | 10 (3.5%) |
| $300 to $499 | 56 (13.8%) | 16 (5.6%) |
| $500 to $799 | 56 (13.8%) | 23 (8.0%) |
| $800 to $999 | 41 (10.1%) | 68 (23.8%) |
| $1,000 to $1,499 | 66 (16.3%) | 95 (33.2%) |
| $1,500 to $1,999 | 43 (10.6%) | 15 (5.2%) |
| $2,000 to $2,499 | 0 (0.0%) | 41 (14.3%) |
| $2,500 to $2,999 | 12 (3.0%) | 0 (0.0%) |
| $3,000 or more | 35 (8.6%) | 0 (0.0%) |
| Total | 405 (100.0%) | 286 (100.0%) |
Physical Housing Characteristics in Los Molinos
Housing Structures in Los Molinos
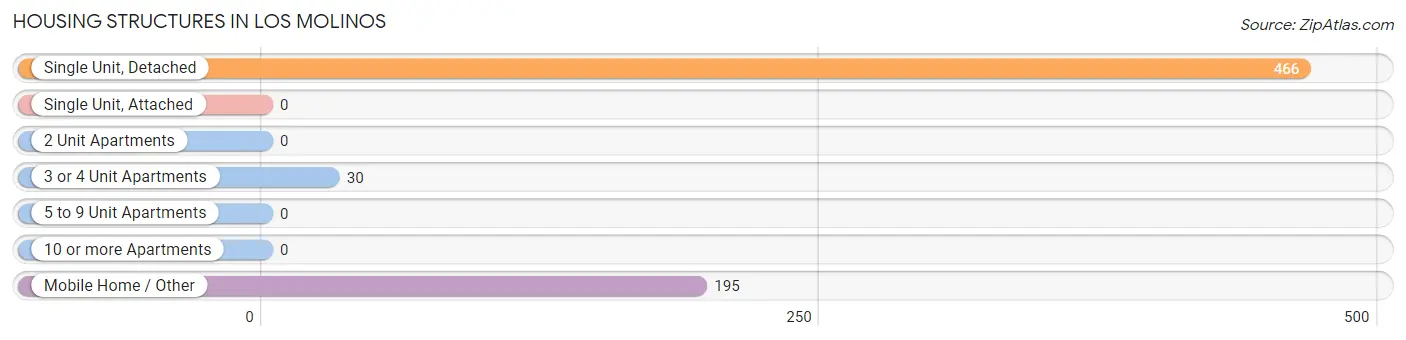
| Structure Type | # Housing Units | % Housing Units |
| Single Unit, Detached | 466 | 67.4% |
| Single Unit, Attached | 0 | 0.0% |
| 2 Unit Apartments | 0 | 0.0% |
| 3 or 4 Unit Apartments | 30 | 4.3% |
| 5 to 9 Unit Apartments | 0 | 0.0% |
| 10 or more Apartments | 0 | 0.0% |
| Mobile Home / Other | 195 | 28.2% |
| Total | 691 | 100.0% |
Housing Structures by Occupancy in Los Molinos
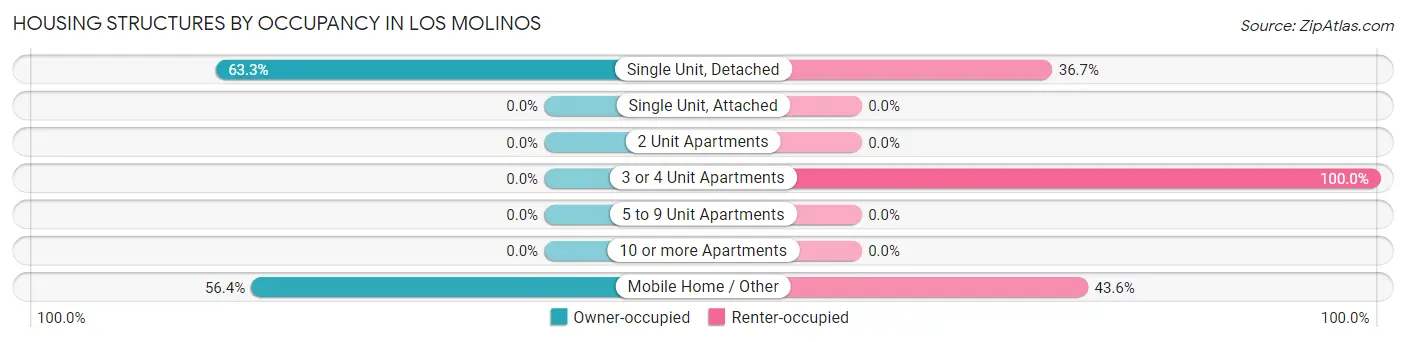
| Structure Type | Owner-occupied | Renter-occupied |
| Single Unit, Detached | 295 (63.3%) | 171 (36.7%) |
| Single Unit, Attached | 0 (0.0%) | 0 (0.0%) |
| 2 Unit Apartments | 0 (0.0%) | 0 (0.0%) |
| 3 or 4 Unit Apartments | 0 (0.0%) | 30 (100.0%) |
| 5 to 9 Unit Apartments | 0 (0.0%) | 0 (0.0%) |
| 10 or more Apartments | 0 (0.0%) | 0 (0.0%) |
| Mobile Home / Other | 110 (56.4%) | 85 (43.6%) |
| Total | 405 (58.6%) | 286 (41.4%) |
Housing Structures by Number of Rooms in Los Molinos
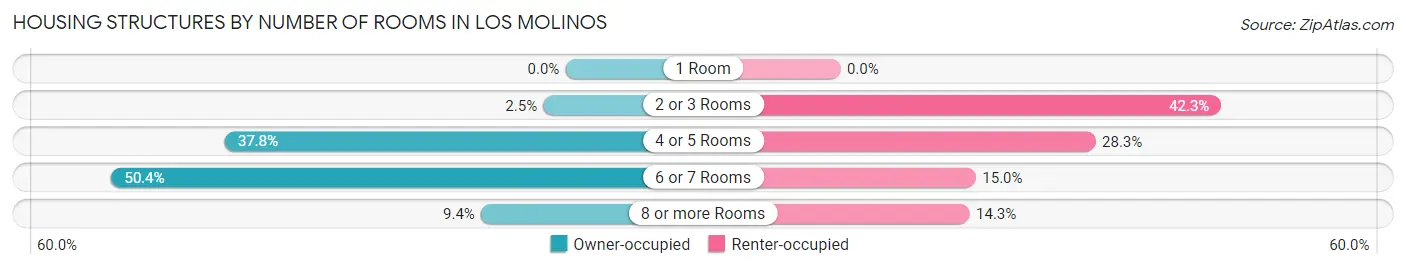
| Number of Rooms | Owner-occupied | Renter-occupied |
| 1 Room | 0 (0.0%) | 0 (0.0%) |
| 2 or 3 Rooms | 10 (2.5%) | 121 (42.3%) |
| 4 or 5 Rooms | 153 (37.8%) | 81 (28.3%) |
| 6 or 7 Rooms | 204 (50.4%) | 43 (15.0%) |
| 8 or more Rooms | 38 (9.4%) | 41 (14.3%) |
| Total | 405 (100.0%) | 286 (100.0%) |
Housing Structure by Heating Type in Los Molinos
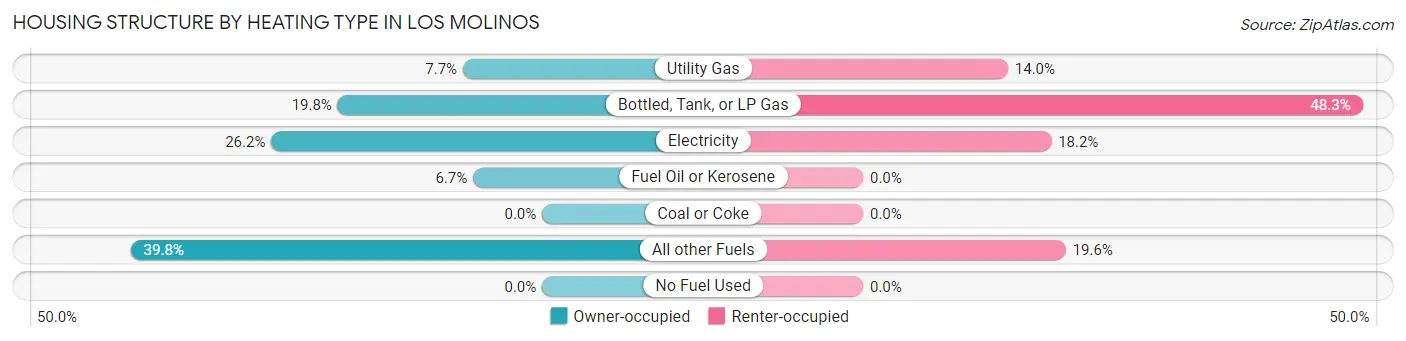
| Heating Type | Owner-occupied | Renter-occupied |
| Utility Gas | 31 (7.6%) | 40 (14.0%) |
| Bottled, Tank, or LP Gas | 80 (19.8%) | 138 (48.2%) |
| Electricity | 106 (26.2%) | 52 (18.2%) |
| Fuel Oil or Kerosene | 27 (6.7%) | 0 (0.0%) |
| Coal or Coke | 0 (0.0%) | 0 (0.0%) |
| All other Fuels | 161 (39.8%) | 56 (19.6%) |
| No Fuel Used | 0 (0.0%) | 0 (0.0%) |
| Total | 405 (100.0%) | 286 (100.0%) |
Household Vehicle Usage in Los Molinos
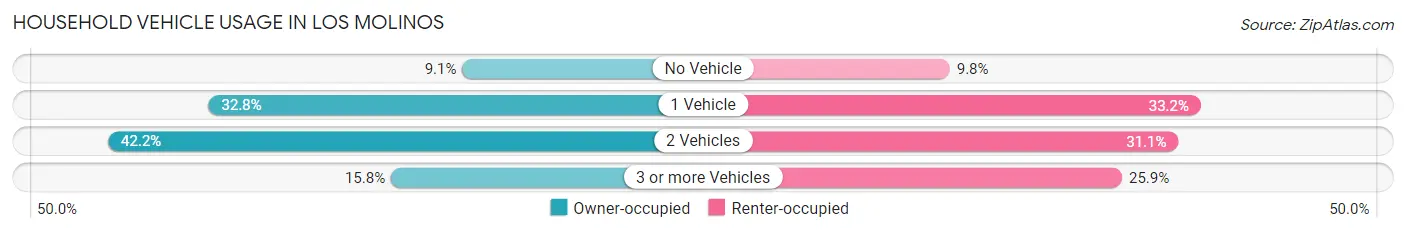
| Vehicles per Household | Owner-occupied | Renter-occupied |
| No Vehicle | 37 (9.1%) | 28 (9.8%) |
| 1 Vehicle | 133 (32.8%) | 95 (33.2%) |
| 2 Vehicles | 171 (42.2%) | 89 (31.1%) |
| 3 or more Vehicles | 64 (15.8%) | 74 (25.9%) |
| Total | 405 (100.0%) | 286 (100.0%) |
Real Estate & Mortgages in Los Molinos
Real Estate and Mortgage Overview in Los Molinos
| Characteristic | Without Mortgage | With Mortgage |
| Housing Units | 208 | 197 |
| Median Property Value | $180,900 | $210,800 |
| Median Household Income | $21,033 | $35 |
| Monthly Housing Costs | $309 | $35 |
| Real Estate Taxes | $932 | $21 |
Property Value by Mortgage Status in Los Molinos
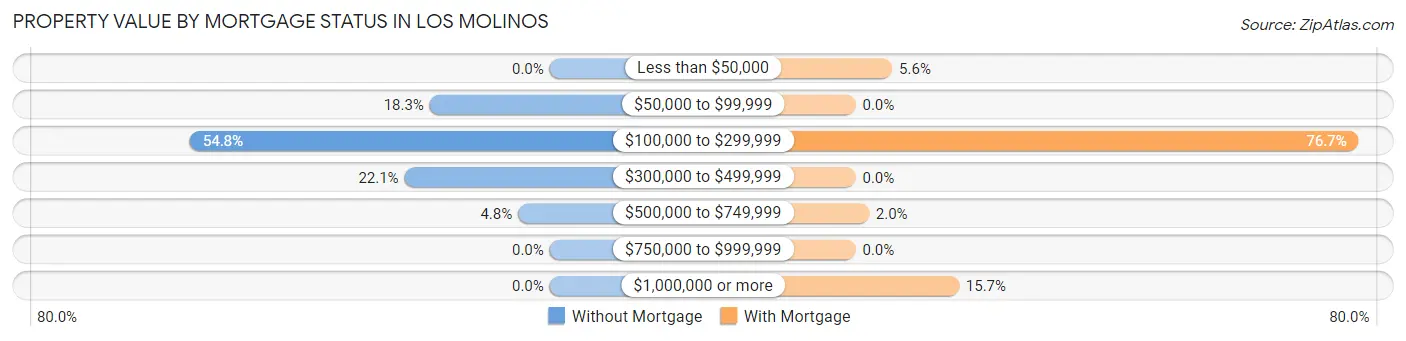
| Property Value | Without Mortgage | With Mortgage |
| Less than $50,000 | 0 (0.0%) | 11 (5.6%) |
| $50,000 to $99,999 | 38 (18.3%) | 0 (0.0%) |
| $100,000 to $299,999 | 114 (54.8%) | 151 (76.6%) |
| $300,000 to $499,999 | 46 (22.1%) | 0 (0.0%) |
| $500,000 to $749,999 | 10 (4.8%) | 4 (2.0%) |
| $750,000 to $999,999 | 0 (0.0%) | 0 (0.0%) |
| $1,000,000 or more | 0 (0.0%) | 31 (15.7%) |
| Total | 208 (100.0%) | 197 (100.0%) |
Household Income by Mortgage Status in Los Molinos
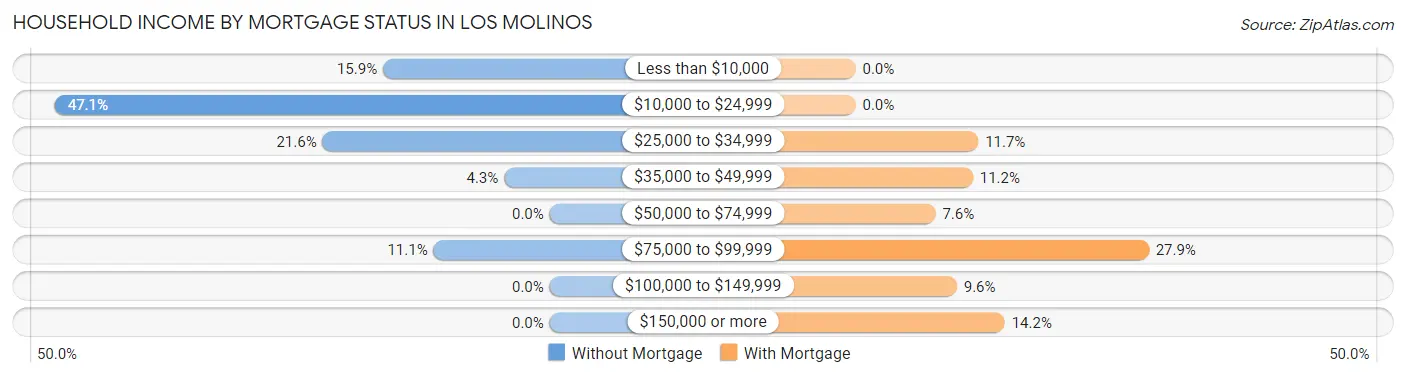
| Household Income | Without Mortgage | With Mortgage |
| Less than $10,000 | 33 (15.9%) | 0 (0.0%) |
| $10,000 to $24,999 | 98 (47.1%) | 0 (0.0%) |
| $25,000 to $34,999 | 45 (21.6%) | 23 (11.7%) |
| $35,000 to $49,999 | 9 (4.3%) | 22 (11.2%) |
| $50,000 to $74,999 | 0 (0.0%) | 15 (7.6%) |
| $75,000 to $99,999 | 23 (11.1%) | 55 (27.9%) |
| $100,000 to $149,999 | 0 (0.0%) | 19 (9.6%) |
| $150,000 or more | 0 (0.0%) | 28 (14.2%) |
| Total | 208 (100.0%) | 197 (100.0%) |
Property Value to Household Income Ratio in Los Molinos
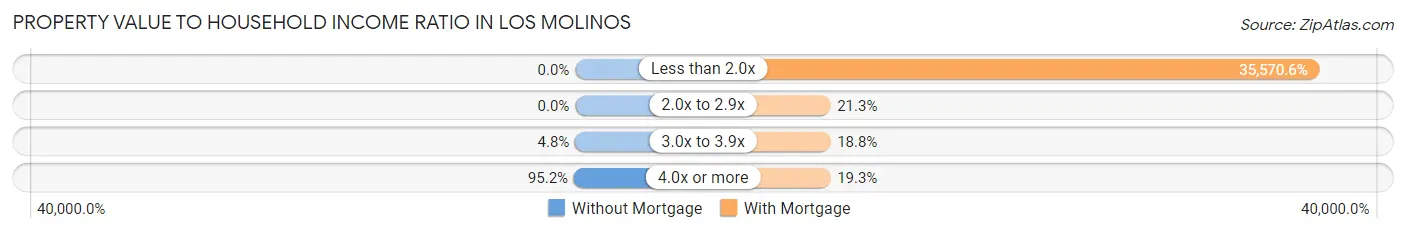
| Value-to-Income Ratio | Without Mortgage | With Mortgage |
| Less than 2.0x | 0 (0.0%) | 70,074 (35,570.6%) |
| 2.0x to 2.9x | 0 (0.0%) | 42 (21.3%) |
| 3.0x to 3.9x | 10 (4.8%) | 37 (18.8%) |
| 4.0x or more | 198 (95.2%) | 38 (19.3%) |
| Total | 208 (100.0%) | 197 (100.0%) |
Real Estate Taxes by Mortgage Status in Los Molinos
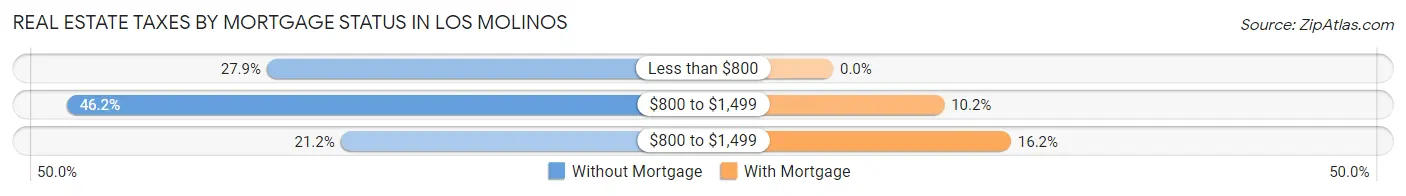
| Property Taxes | Without Mortgage | With Mortgage |
| Less than $800 | 58 (27.9%) | 0 (0.0%) |
| $800 to $1,499 | 96 (46.2%) | 20 (10.2%) |
| $800 to $1,499 | 44 (21.1%) | 32 (16.2%) |
| Total | 208 (100.0%) | 197 (100.0%) |
Health & Disability in Los Molinos
Health Insurance Coverage by Age in Los Molinos
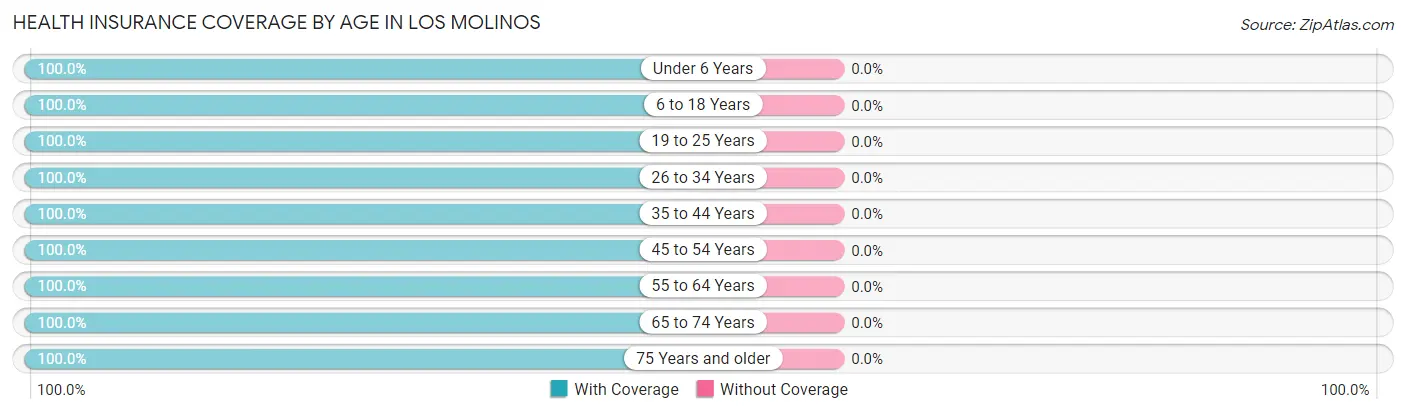
| Age Bracket | With Coverage | Without Coverage |
| Under 6 Years | 155 (100.0%) | 0 (0.0%) |
| 6 to 18 Years | 393 (100.0%) | 0 (0.0%) |
| 19 to 25 Years | 114 (100.0%) | 0 (0.0%) |
| 26 to 34 Years | 139 (100.0%) | 0 (0.0%) |
| 35 to 44 Years | 233 (100.0%) | 0 (0.0%) |
| 45 to 54 Years | 224 (100.0%) | 0 (0.0%) |
| 55 to 64 Years | 107 (100.0%) | 0 (0.0%) |
| 65 to 74 Years | 161 (100.0%) | 0 (0.0%) |
| 75 Years and older | 101 (100.0%) | 0 (0.0%) |
| Total | 1,627 (100.0%) | 0 (0.0%) |
Health Insurance Coverage by Citizenship Status in Los Molinos
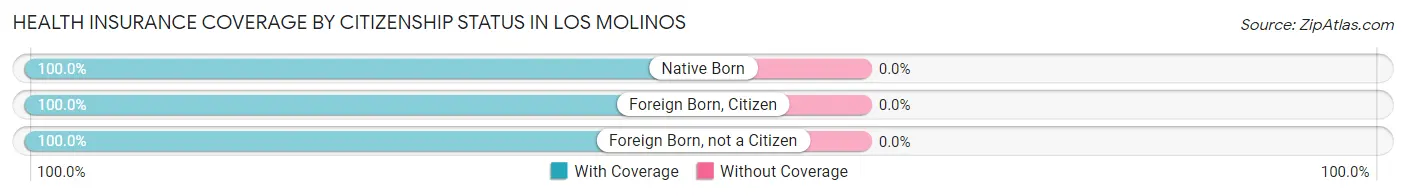
| Citizenship Status | With Coverage | Without Coverage |
| Native Born | 155 (100.0%) | 0 (0.0%) |
| Foreign Born, Citizen | 393 (100.0%) | 0 (0.0%) |
| Foreign Born, not a Citizen | 114 (100.0%) | 0 (0.0%) |
Health Insurance Coverage by Household Income in Los Molinos
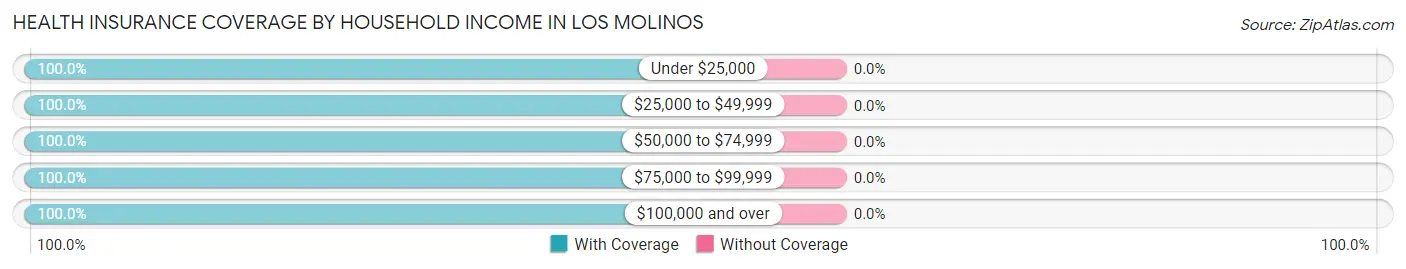
| Household Income | With Coverage | Without Coverage |
| Under $25,000 | 597 (100.0%) | 0 (0.0%) |
| $25,000 to $49,999 | 296 (100.0%) | 0 (0.0%) |
| $50,000 to $74,999 | 122 (100.0%) | 0 (0.0%) |
| $75,000 to $99,999 | 363 (100.0%) | 0 (0.0%) |
| $100,000 and over | 249 (100.0%) | 0 (0.0%) |
Public vs Private Health Insurance Coverage by Age in Los Molinos
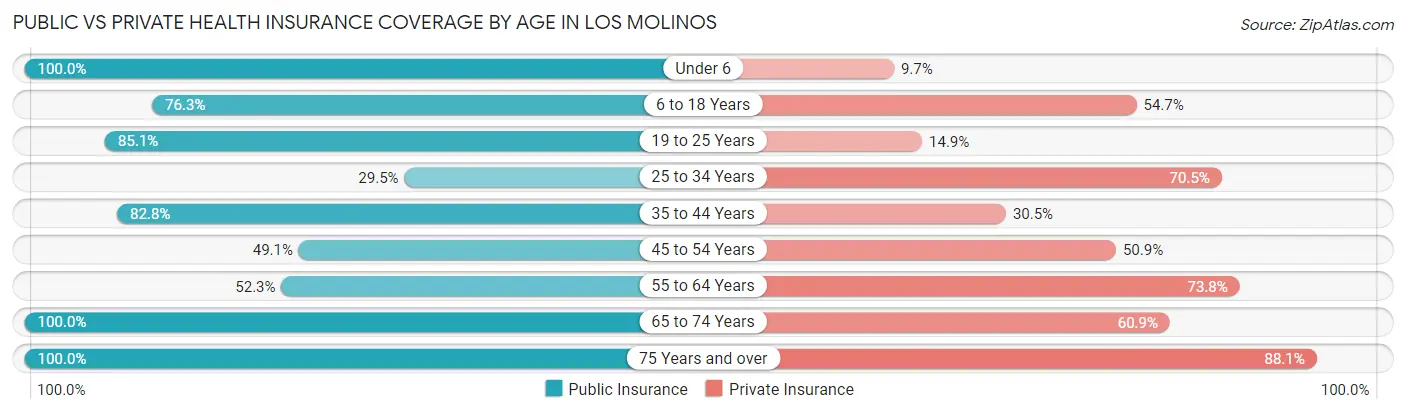
| Age Bracket | Public Insurance | Private Insurance |
| Under 6 | 155 (100.0%) | 15 (9.7%) |
| 6 to 18 Years | 300 (76.3%) | 215 (54.7%) |
| 19 to 25 Years | 97 (85.1%) | 17 (14.9%) |
| 25 to 34 Years | 41 (29.5%) | 98 (70.5%) |
| 35 to 44 Years | 193 (82.8%) | 71 (30.5%) |
| 45 to 54 Years | 110 (49.1%) | 114 (50.9%) |
| 55 to 64 Years | 56 (52.3%) | 79 (73.8%) |
| 65 to 74 Years | 161 (100.0%) | 98 (60.9%) |
| 75 Years and over | 101 (100.0%) | 89 (88.1%) |
| Total | 1,214 (74.6%) | 796 (48.9%) |
Disability Status by Sex by Age in Los Molinos
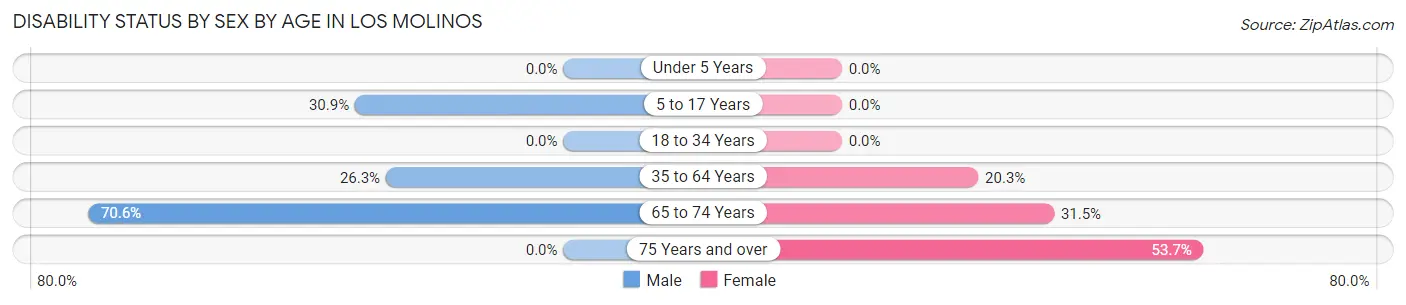
| Age Bracket | Male | Female |
| Under 5 Years | 0 (0.0%) | 0 (0.0%) |
| 5 to 17 Years | 95 (30.9%) | 0 (0.0%) |
| 18 to 34 Years | 0 (0.0%) | 0 (0.0%) |
| 35 to 64 Years | 64 (26.3%) | 65 (20.3%) |
| 65 to 74 Years | 24 (70.6%) | 40 (31.5%) |
| 75 Years and over | 0 (0.0%) | 36 (53.7%) |
Disability Class by Sex by Age in Los Molinos
Disability Class: Hearing Difficulty
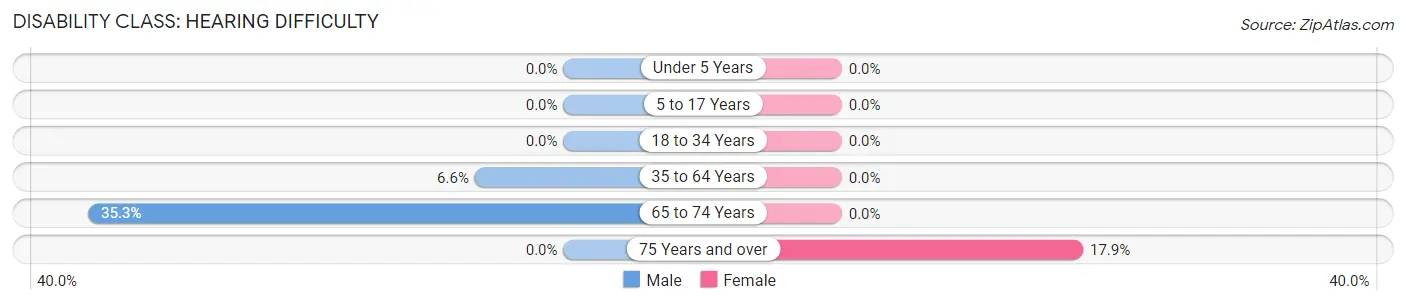
| Age Bracket | Male | Female |
| Under 5 Years | 0 (0.0%) | 0 (0.0%) |
| 5 to 17 Years | 0 (0.0%) | 0 (0.0%) |
| 18 to 34 Years | 0 (0.0%) | 0 (0.0%) |
| 35 to 64 Years | 16 (6.6%) | 0 (0.0%) |
| 65 to 74 Years | 12 (35.3%) | 0 (0.0%) |
| 75 Years and over | 0 (0.0%) | 12 (17.9%) |
Disability Class: Vision Difficulty
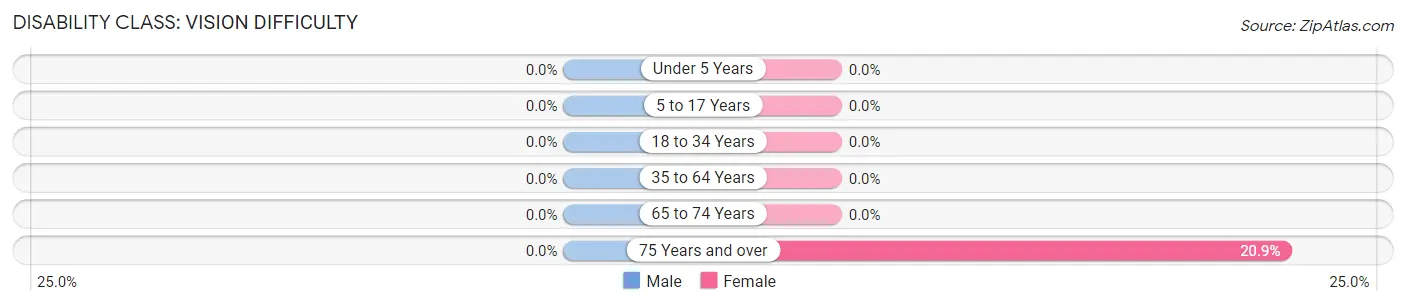
| Age Bracket | Male | Female |
| Under 5 Years | 0 (0.0%) | 0 (0.0%) |
| 5 to 17 Years | 0 (0.0%) | 0 (0.0%) |
| 18 to 34 Years | 0 (0.0%) | 0 (0.0%) |
| 35 to 64 Years | 0 (0.0%) | 0 (0.0%) |
| 65 to 74 Years | 0 (0.0%) | 0 (0.0%) |
| 75 Years and over | 0 (0.0%) | 14 (20.9%) |
Disability Class: Cognitive Difficulty
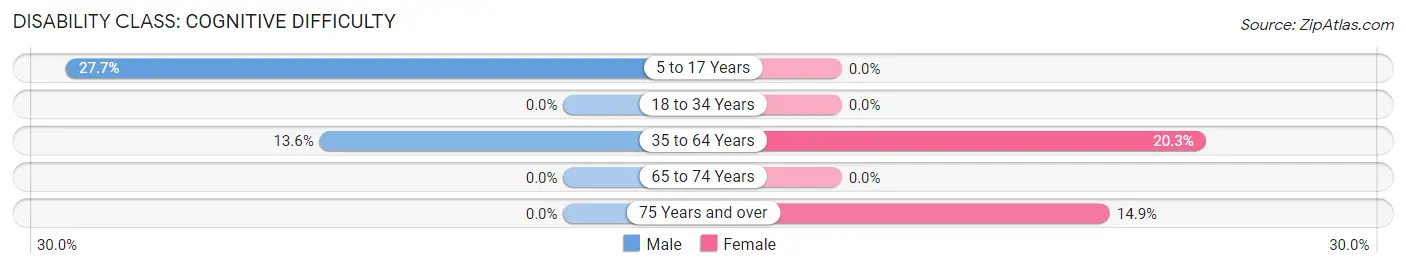
| Age Bracket | Male | Female |
| 5 to 17 Years | 85 (27.7%) | 0 (0.0%) |
| 18 to 34 Years | 0 (0.0%) | 0 (0.0%) |
| 35 to 64 Years | 33 (13.6%) | 65 (20.3%) |
| 65 to 74 Years | 0 (0.0%) | 0 (0.0%) |
| 75 Years and over | 0 (0.0%) | 10 (14.9%) |
Disability Class: Ambulatory Difficulty
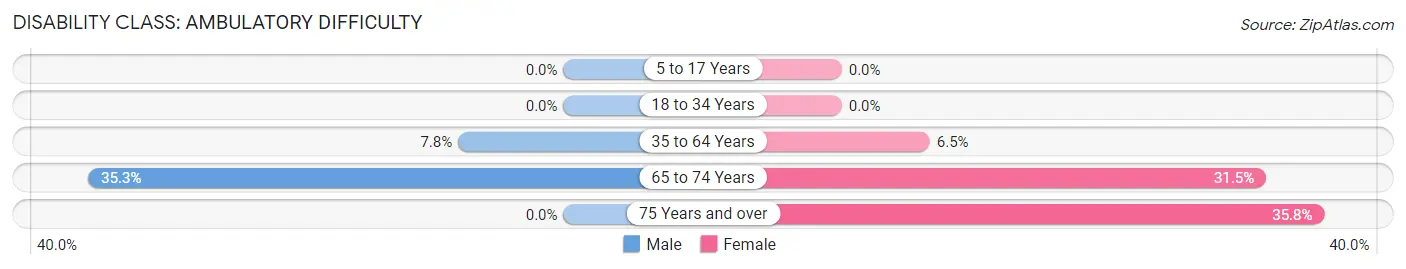
| Age Bracket | Male | Female |
| 5 to 17 Years | 0 (0.0%) | 0 (0.0%) |
| 18 to 34 Years | 0 (0.0%) | 0 (0.0%) |
| 35 to 64 Years | 19 (7.8%) | 21 (6.5%) |
| 65 to 74 Years | 12 (35.3%) | 40 (31.5%) |
| 75 Years and over | 0 (0.0%) | 24 (35.8%) |
Disability Class: Self-Care Difficulty
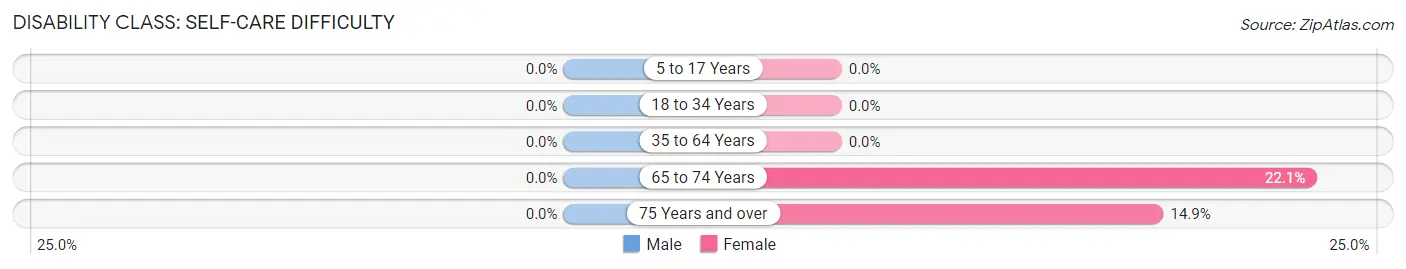
| Age Bracket | Male | Female |
| 5 to 17 Years | 0 (0.0%) | 0 (0.0%) |
| 18 to 34 Years | 0 (0.0%) | 0 (0.0%) |
| 35 to 64 Years | 0 (0.0%) | 0 (0.0%) |
| 65 to 74 Years | 0 (0.0%) | 28 (22.1%) |
| 75 Years and over | 0 (0.0%) | 10 (14.9%) |
Technology Access in Los Molinos
Computing Device Access in Los Molinos
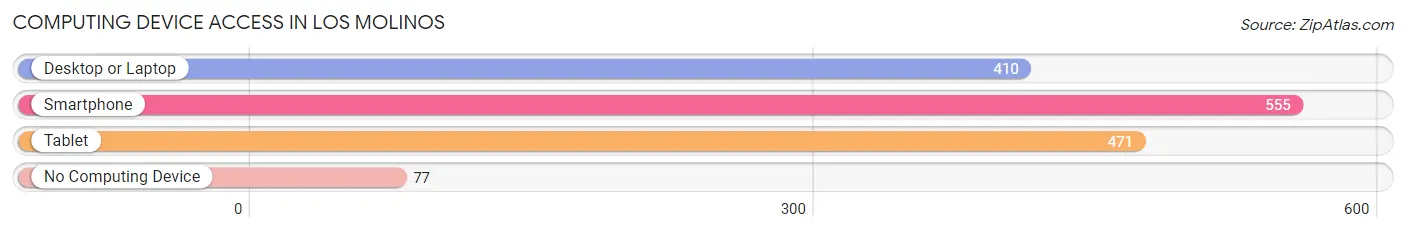
| Device Type | # Households | % Households |
| Desktop or Laptop | 410 | 59.3% |
| Smartphone | 555 | 80.3% |
| Tablet | 471 | 68.2% |
| No Computing Device | 77 | 11.1% |
| Total | 691 | 100.0% |
Internet Access in Los Molinos
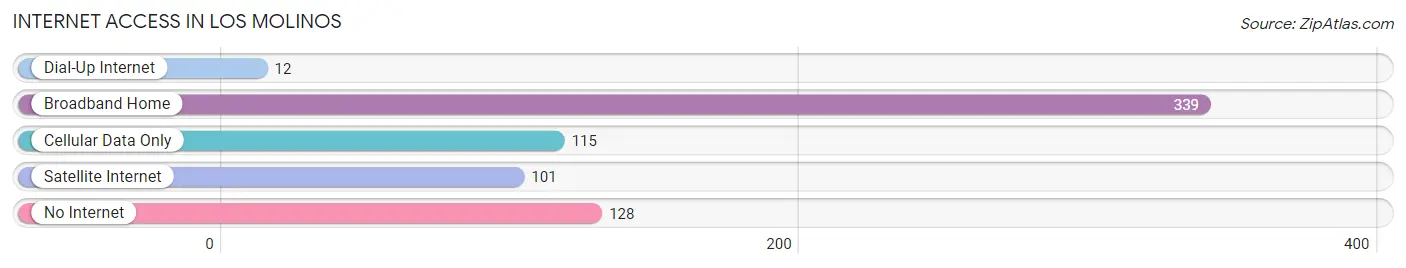
| Internet Type | # Households | % Households |
| Dial-Up Internet | 12 | 1.7% |
| Broadband Home | 339 | 49.1% |
| Cellular Data Only | 115 | 16.6% |
| Satellite Internet | 101 | 14.6% |
| No Internet | 128 | 18.5% |
| Total | 691 | 100.0% |
Los Molinos Summary
Molinos, California is a small unincorporated community located in Tehama County, California. It is situated in the foothills of the Sierra Nevada Mountains, approximately 20 miles east of Red Bluff. The population of Los Molinos was estimated to be 1,845 in 2019.
History
The area that is now Los Molinos was originally inhabited by the Nomlaki people, a Native American tribe of the Wintun Nation. The Nomlaki people lived in the area for thousands of years before the arrival of European settlers.
The first European settlers arrived in the area in the late 1850s. The settlement was originally known as "Molino," which is Spanish for "mill." The settlement was named after a nearby flour mill that was built in 1858. The mill was powered by a water wheel and was used to grind wheat and other grains.
In 1868, the settlement was renamed "Los Molinos" and the post office was established. The town grew slowly over the next few decades, and by the early 1900s, it had become a thriving agricultural community.
Geography
Los Molinos is located in the northern part of Tehama County, California. It is situated in the foothills of the Sierra Nevada Mountains, approximately 20 miles east of Red Bluff. The town is located at an elevation of 1,067 feet above sea level.
The climate in Los Molinos is semi-arid, with hot summers and mild winters. The average annual temperature is 64°F, and the average annual precipitation is 17.5 inches.
Economy
The economy of Los Molinos is largely based on agriculture. The town is home to several farms and ranches, which produce a variety of crops, including wheat, corn, alfalfa, and hay. The town is also home to several small businesses, including a grocery store, a hardware store, and a restaurant.
Demographics
As of 2019, the population of Los Molinos was estimated to be 1,845. The racial makeup of the town was 94.3% White, 0.7% African American, 0.7% Native American, 0.7% Asian, 0.2% Pacific Islander, and 2.6% from other races. The median household income was $41,250, and the median family income was $45,000. The per capita income was $19,845.
Conclusion
Los Molinos is a small unincorporated community located in Tehama County, California. It is situated in the foothills of the Sierra Nevada Mountains, approximately 20 miles east of Red Bluff. The population of Los Molinos was estimated to be 1,845 in 2019. The economy of Los Molinos is largely based on agriculture, and the town is home to several small businesses. The racial makeup of the town was 94.3% White, 0.7% African American, 0.7% Native American, 0.7% Asian, 0.2% Pacific Islander, and 2.6% from other races. The median household income was $41,250, and the median family income was $45,000.
Common Questions
What is Per Capita Income in Los Molinos?
Per Capita income in Los Molinos is $20,624.
What is the Median Family Income in Los Molinos?
Median Family Income in Los Molinos is $70,441.
What is the Median Household income in Los Molinos?
Median Household Income in Los Molinos is $28,385.
What is Family Income Deficit in Los Molinos?
Family Income Deficit in Los Molinos is $11,350.
Families that are below poverty line in Los Molinos earn $11,350 less on average than the poverty threshold level.
What is Inequality or Gini Index in Los Molinos?
Inequality or Gini Index in Los Molinos is 0.52.
What is the Total Population of Los Molinos?
Total Population of Los Molinos is 1,649.
What is the Total Male Population of Los Molinos?
Total Male Population of Los Molinos is 790.
What is the Total Female Population of Los Molinos?
Total Female Population of Los Molinos is 859.
What is the Ratio of Males per 100 Females in Los Molinos?
There are 91.97 Males per 100 Females in Los Molinos.
What is the Ratio of Females per 100 Males in Los Molinos?
There are 108.73 Females per 100 Males in Los Molinos.
What is the Median Population Age in Los Molinos?
Median Population Age in Los Molinos is 35.0 Years.
What is the Average Family Size in Los Molinos
Average Family Size in Los Molinos is 3.3 People.
What is the Average Household Size in Los Molinos
Average Household Size in Los Molinos is 2.4 People.
How Large is the Labor Force in Los Molinos?
There are 594 People in the Labor Forcein in Los Molinos.
What is the Percentage of People in the Labor Force in Los Molinos?
49.6% of People are in the Labor Force in Los Molinos.
What is the Unemployment Rate in Los Molinos?
Unemployment Rate in Los Molinos is 10.8%.