Cities with the Highest Percentage of Population Employed in Computer & Mathematics in Indiana
RELATED REPORTS & OPTIONS
Computer & Mathematics
Indiana
Compare Cities
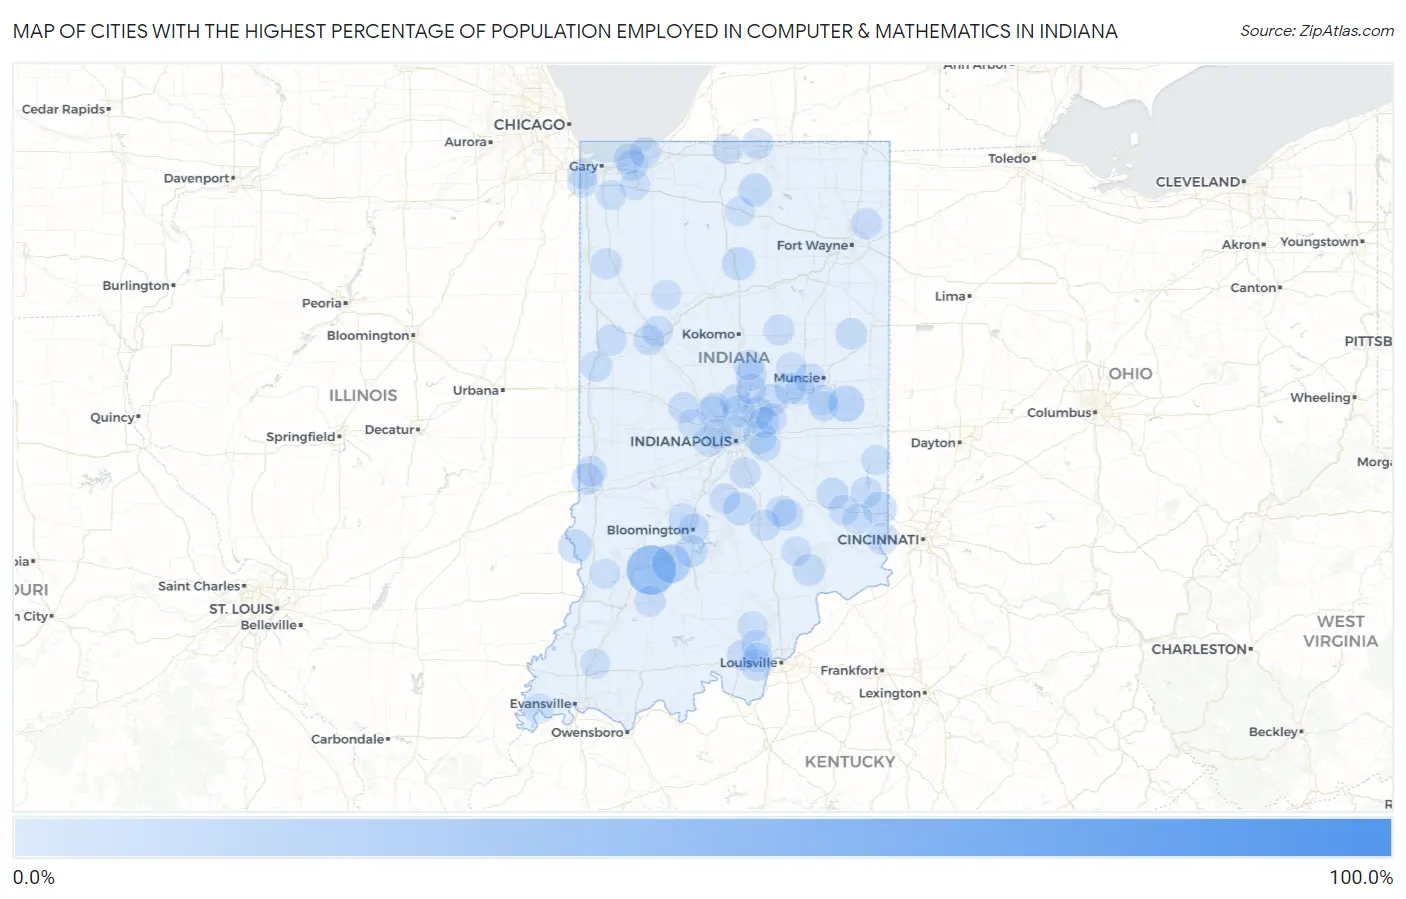
Map of Cities with the Highest Percentage of Population Employed in Computer & Mathematics in Indiana
0.0%
100.0%
Cities with the Highest Percentage of Population Employed in Computer & Mathematics in Indiana
| City | % Employed | vs State | vs National | |
| 1. | Sandusky | 100.0% | 2.4%(+97.6)#1 | 3.5%(+96.5)#5 |
| 2. | Centerton | 41.3% | 2.4%(+38.9)#2 | 3.5%(+37.8)#33 |
| 3. | Crane | 39.4% | 2.4%(+37.0)#3 | 3.5%(+35.9)#38 |
| 4. | Petroleum | 37.5% | 2.4%(+35.1)#4 | 3.5%(+34.0)#42 |
| 5. | Andersonville | 36.0% | 2.4%(+33.6)#5 | 3.5%(+32.5)#46 |
| 6. | Marietta | 29.6% | 2.4%(+27.2)#6 | 3.5%(+26.0)#71 |
| 7. | Arcola | 23.3% | 2.4%(+20.9)#7 | 3.5%(+19.8)#116 |
| 8. | Schaefer Lake | 23.1% | 2.4%(+20.7)#8 | 3.5%(+19.6)#119 |
| 9. | Pleasant Mills | 21.7% | 2.4%(+19.3)#9 | 3.5%(+18.2)#143 |
| 10. | St. Omer | 19.4% | 2.4%(+17.0)#10 | 3.5%(+15.9)#180 |
| 11. | Owensburg | 19.0% | 2.4%(+16.6)#11 | 3.5%(+15.5)#186 |
| 12. | Belleville | 18.0% | 2.4%(+15.5)#12 | 3.5%(+14.4)#208 |
| 13. | Stewartsville | 17.5% | 2.4%(+15.1)#13 | 3.5%(+14.0)#219 |
| 14. | Charlottesville | 16.2% | 2.4%(+13.8)#14 | 3.5%(+12.7)#259 |
| 15. | Wawaka | 15.4% | 2.4%(+13.0)#15 | 3.5%(+11.9)#295 |
| 16. | Losantville | 14.8% | 2.4%(+12.4)#16 | 3.5%(+11.3)#325 |
| 17. | Fishersburg | 13.3% | 2.4%(+10.9)#17 | 3.5%(+9.74)#412 |
| 18. | Antioch | 11.1% | 2.4%(+8.70)#18 | 3.5%(+7.59)#577 |
| 19. | New Trenton | 10.6% | 2.4%(+8.14)#19 | 3.5%(+7.03)#646 |
| 20. | Merom | 10.2% | 2.4%(+7.76)#20 | 3.5%(+6.64)#703 |
| 21. | Macy | 9.7% | 2.4%(+7.31)#21 | 3.5%(+6.20)#787 |
| 22. | Cordry Sweetwater Lakes | 9.1% | 2.4%(+6.69)#22 | 3.5%(+5.58)#917 |
| 23. | Nappanee | 9.1% | 2.4%(+6.68)#23 | 3.5%(+5.57)#918 |
| 24. | Cumberland | 8.6% | 2.4%(+6.21)#24 | 3.5%(+5.10)#1,029 |
| 25. | Reddington | 8.2% | 2.4%(+5.82)#25 | 3.5%(+4.71)#1,135 |
| 26. | Harrodsburg | 7.8% | 2.4%(+5.36)#26 | 3.5%(+4.25)#1,310 |
| 27. | Pleasant Lake | 7.7% | 2.4%(+5.25)#27 | 3.5%(+4.13)#1,351 |
| 28. | Lapel | 7.4% | 2.4%(+5.02)#28 | 3.5%(+3.91)#1,425 |
| 29. | Carmel | 7.4% | 2.4%(+4.94)#29 | 3.5%(+3.83)#1,454 |
| 30. | Dupont | 7.3% | 2.4%(+4.93)#30 | 3.5%(+3.81)#1,460 |
| 31. | Lake Santee | 7.0% | 2.4%(+4.58)#31 | 3.5%(+3.47)#1,597 |
| 32. | Lawrenceburg | 7.0% | 2.4%(+4.55)#32 | 3.5%(+3.44)#1,615 |
| 33. | Hartsville | 6.3% | 2.4%(+3.89)#33 | 3.5%(+2.78)#1,967 |
| 34. | St Mary Of The Woods | 6.3% | 2.4%(+3.87)#34 | 3.5%(+2.76)#1,980 |
| 35. | Pennville | 6.2% | 2.4%(+3.74)#35 | 3.5%(+2.63)#2,071 |
| 36. | Fishers | 6.1% | 2.4%(+3.71)#36 | 3.5%(+2.60)#2,083 |
| 37. | Atlanta | 6.1% | 2.4%(+3.66)#37 | 3.5%(+2.55)#2,125 |
| 38. | Celestine | 6.1% | 2.4%(+3.65)#38 | 3.5%(+2.54)#2,131 |
| 39. | Wyatt | 6.0% | 2.4%(+3.54)#39 | 3.5%(+2.43)#2,204 |
| 40. | Lanesville | 5.9% | 2.4%(+3.47)#40 | 3.5%(+2.36)#2,254 |
| 41. | Pine Village | 5.7% | 2.4%(+3.32)#41 | 3.5%(+2.21)#2,366 |
| 42. | Mount Ayr | 5.7% | 2.4%(+3.30)#42 | 3.5%(+2.19)#2,381 |
| 43. | Country Club Heights | 5.7% | 2.4%(+3.27)#43 | 3.5%(+2.16)#2,416 |
| 44. | Brookville | 5.6% | 2.4%(+3.21)#44 | 3.5%(+2.10)#2,463 |
| 45. | Battle Ground | 5.6% | 2.4%(+3.17)#45 | 3.5%(+2.06)#2,504 |
| 46. | West Lebanon | 5.5% | 2.4%(+3.11)#46 | 3.5%(+2.00)#2,553 |
| 47. | Chesterton | 5.5% | 2.4%(+3.08)#47 | 3.5%(+1.97)#2,577 |
| 48. | Loogootee | 5.5% | 2.4%(+3.06)#48 | 3.5%(+1.95)#2,597 |
| 49. | Yorktown | 5.4% | 2.4%(+3.03)#49 | 3.5%(+1.92)#2,620 |
| 50. | Leo Cedarville | 5.4% | 2.4%(+2.97)#50 | 3.5%(+1.86)#2,689 |
| 51. | Hope | 5.4% | 2.4%(+2.97)#51 | 3.5%(+1.86)#2,691 |
| 52. | New Salisbury | 5.3% | 2.4%(+2.85)#52 | 3.5%(+1.74)#2,804 |
| 53. | Whiteland | 5.2% | 2.4%(+2.79)#53 | 3.5%(+1.68)#2,853 |
| 54. | Herbst | 5.2% | 2.4%(+2.78)#54 | 3.5%(+1.67)#2,868 |
| 55. | Columbus | 5.2% | 2.4%(+2.74)#55 | 3.5%(+1.63)#2,913 |
| 56. | Ellettsville | 5.2% | 2.4%(+2.74)#56 | 3.5%(+1.63)#2,915 |
| 57. | Town Of Pines | 5.0% | 2.4%(+2.60)#57 | 3.5%(+1.49)#3,069 |
| 58. | Avon | 5.0% | 2.4%(+2.57)#58 | 3.5%(+1.46)#3,114 |
| 59. | Mccordsville | 4.9% | 2.4%(+2.51)#59 | 3.5%(+1.40)#3,177 |
| 60. | Westfield | 4.9% | 2.4%(+2.46)#60 | 3.5%(+1.35)#3,235 |
| 61. | Whitestown | 4.8% | 2.4%(+2.43)#61 | 3.5%(+1.32)#3,272 |
| 62. | Simonton Lake | 4.8% | 2.4%(+2.41)#62 | 3.5%(+1.30)#3,291 |
| 63. | Advance | 4.8% | 2.4%(+2.39)#63 | 3.5%(+1.28)#3,324 |
| 64. | Cicero | 4.8% | 2.4%(+2.37)#64 | 3.5%(+1.26)#3,337 |
| 65. | Fortville | 4.7% | 2.4%(+2.32)#65 | 3.5%(+1.21)#3,392 |
| 66. | Floyds Knobs | 4.5% | 2.4%(+2.12)#66 | 3.5%(+1.01)#3,642 |
| 67. | Tipton | 4.5% | 2.4%(+2.12)#67 | 3.5%(+1.01)#3,645 |
| 68. | Dune Acres | 4.5% | 2.4%(+2.07)#68 | 3.5%(+0.963)#3,691 |
| 69. | Bloomington | 4.5% | 2.4%(+2.05)#69 | 3.5%(+0.945)#3,715 |
| 70. | Tecumseh | 4.4% | 2.4%(+2.03)#70 | 3.5%(+0.915)#3,753 |
| 71. | Lake Of The Woods | 4.4% | 2.4%(+2.01)#71 | 3.5%(+0.897)#3,783 |
| 72. | West Lafayette | 4.4% | 2.4%(+2.00)#72 | 3.5%(+0.894)#3,786 |
| 73. | Morgantown | 4.4% | 2.4%(+1.99)#73 | 3.5%(+0.878)#3,815 |
| 74. | Batesville | 4.3% | 2.4%(+1.93)#74 | 3.5%(+0.820)#3,907 |
| 75. | Mount Vernon | 4.2% | 2.4%(+1.83)#75 | 3.5%(+0.723)#4,050 |
| 76. | Sunman | 4.2% | 2.4%(+1.82)#76 | 3.5%(+0.709)#4,072 |
| 77. | Springport | 4.2% | 2.4%(+1.81)#77 | 3.5%(+0.701)#4,092 |
| 78. | Rocky Ripple | 4.2% | 2.4%(+1.78)#78 | 3.5%(+0.667)#4,139 |
| 79. | New Pekin | 4.1% | 2.4%(+1.72)#79 | 3.5%(+0.611)#4,258 |
| 80. | Zionsville | 4.1% | 2.4%(+1.64)#80 | 3.5%(+0.531)#4,380 |
| 81. | Munster | 4.0% | 2.4%(+1.56)#81 | 3.5%(+0.448)#4,510 |
| 82. | Clermont | 3.9% | 2.4%(+1.51)#82 | 3.5%(+0.404)#4,584 |
| 83. | Greenville | 3.9% | 2.4%(+1.50)#83 | 3.5%(+0.386)#4,619 |
| 84. | New Palestine | 3.9% | 2.4%(+1.45)#84 | 3.5%(+0.337)#4,707 |
| 85. | Mackey | 3.8% | 2.4%(+1.43)#85 | 3.5%(+0.322)#4,738 |
| 86. | Mount Summit | 3.8% | 2.4%(+1.38)#86 | 3.5%(+0.273)#4,830 |
| 87. | Chesterfield | 3.7% | 2.4%(+1.33)#87 | 3.5%(+0.224)#4,913 |
| 88. | Valparaiso | 3.7% | 2.4%(+1.33)#88 | 3.5%(+0.216)#4,933 |
| 89. | Freelandville | 3.7% | 2.4%(+1.30)#89 | 3.5%(+0.194)#4,970 |
| 90. | Georgetown | 3.7% | 2.4%(+1.30)#90 | 3.5%(+0.186)#4,980 |
| 91. | Indian Village | 3.7% | 2.4%(+1.29)#91 | 3.5%(+0.179)#5,001 |
| 92. | Monticello | 3.7% | 2.4%(+1.24)#92 | 3.5%(+0.134)#5,093 |
| 93. | Dyer | 3.6% | 2.4%(+1.23)#93 | 3.5%(+0.123)#5,114 |
| 94. | Liberty | 3.6% | 2.4%(+1.21)#94 | 3.5%(+0.095)#5,166 |
| 95. | Winfield | 3.6% | 2.4%(+1.17)#95 | 3.5%(+0.059)#5,235 |
| 96. | Alexandria | 3.6% | 2.4%(+1.16)#96 | 3.5%(+0.047)#5,254 |
| 97. | Bourbon | 3.5% | 2.4%(+1.08)#97 | 3.5%(-0.035)#5,440 |
| 98. | Lizton | 3.5% | 2.4%(+1.06)#98 | 3.5%(-0.049)#5,476 |
| 99. | Underwood | 3.5% | 2.4%(+1.06)#99 | 3.5%(-0.055)#5,489 |
| 100. | North Vernon | 3.5% | 2.4%(+1.04)#100 | 3.5%(-0.065)#5,504 |
Common Questions
What are the Top 10 Cities with the Highest Percentage of Population Employed in Computer & Mathematics in Indiana?
Top 10 Cities with the Highest Percentage of Population Employed in Computer & Mathematics in Indiana are:
#1
39.4%
#2
19.0%
#3
14.8%
#4
10.6%
#5
10.2%
#6
9.7%
#7
9.1%
#8
9.1%
#9
8.6%
#10
7.8%
What city has the Highest Percentage of Population Employed in Computer & Mathematics in Indiana?
Crane has the Highest Percentage of Population Employed in Computer & Mathematics in Indiana with 39.4%.
What is the Percentage of Population Employed in Computer & Mathematics in the State of Indiana?
Percentage of Population Employed in Computer & Mathematics in Indiana is 2.4%.
What is the Percentage of Population Employed in Computer & Mathematics in the United States?
Percentage of Population Employed in Computer & Mathematics in the United States is 3.5%.