Zip Codes with the Highest Percentage of Population Employed in Computer & Mathematics in Los Angeles, CA
RELATED REPORTS & OPTIONS
Computer & Mathematics
Los Angeles
Compare Zip Codes
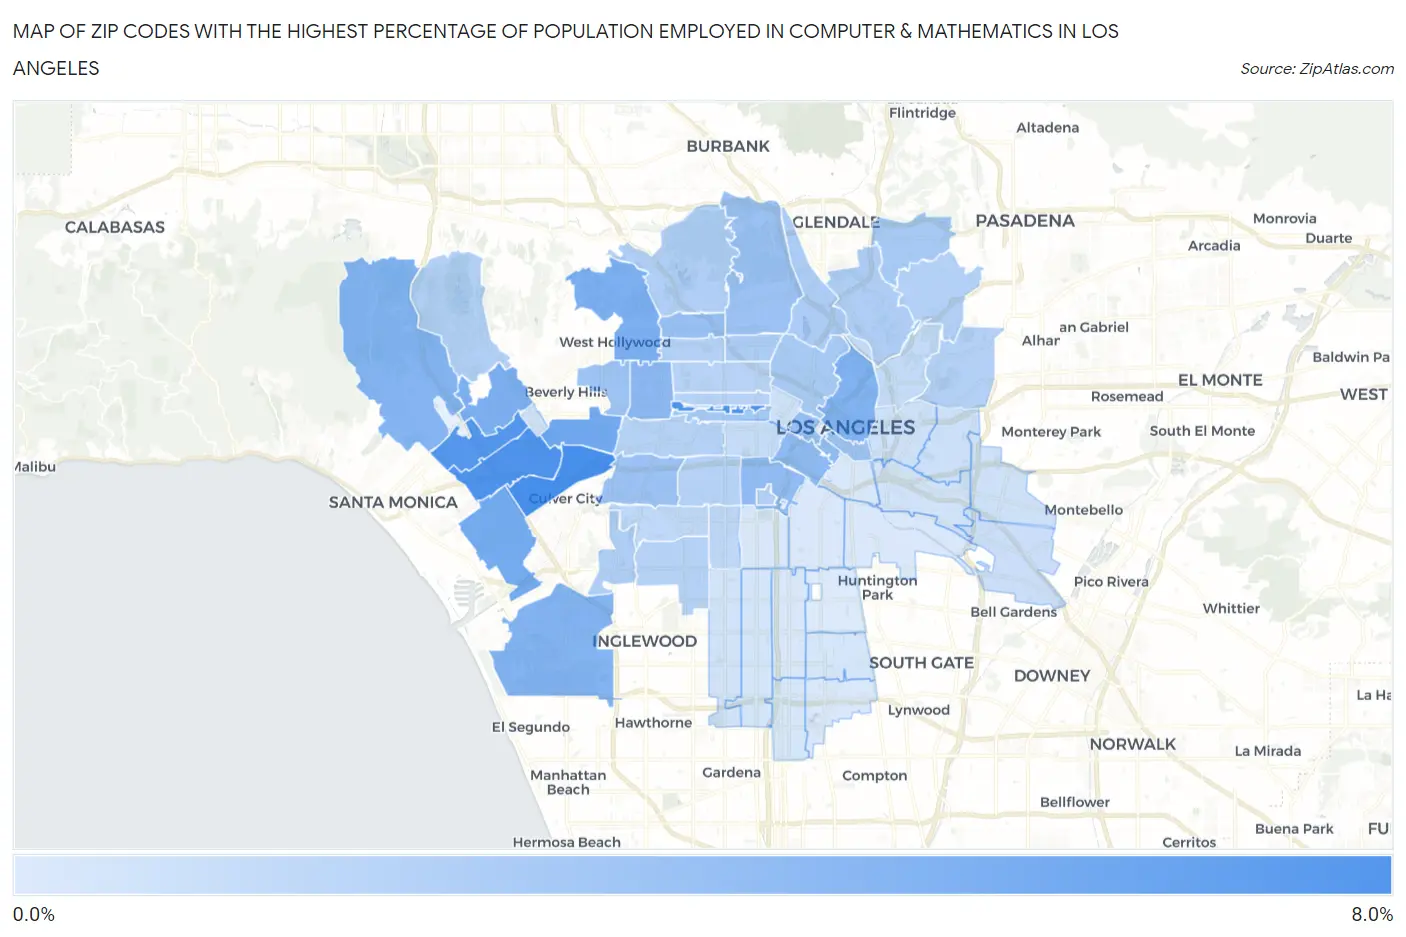
Map of Zip Codes with the Highest Percentage of Population Employed in Computer & Mathematics in Los Angeles
0.27%
7.2%
Zip Codes with the Highest Percentage of Population Employed in Computer & Mathematics in Los Angeles, CA
| Zip Code | % Employed | vs State | vs National | |
| 1. | 90034 | 7.2% | 4.1%(+3.10)#181 | 3.5%(+3.68)#1,509 |
| 2. | 90010 | 6.9% | 4.1%(+2.79)#199 | 3.5%(+3.36)#1,686 |
| 3. | 90064 | 6.8% | 4.1%(+2.72)#203 | 3.5%(+3.30)#1,726 |
| 4. | 90025 | 6.6% | 4.1%(+2.47)#217 | 3.5%(+3.05)#1,874 |
| 5. | 90035 | 5.2% | 4.1%(+1.06)#300 | 3.5%(+1.64)#3,166 |
| 6. | 90066 | 5.0% | 4.1%(+0.895)#317 | 3.5%(+1.47)#3,359 |
| 7. | 90046 | 4.7% | 4.1%(+0.637)#343 | 3.5%(+1.21)#3,728 |
| 8. | 90024 | 4.6% | 4.1%(+0.485)#353 | 3.5%(+1.06)#3,963 |
| 9. | 90012 | 4.5% | 4.1%(+0.389)#361 | 3.5%(+0.967)#4,088 |
| 10. | 90045 | 4.4% | 4.1%(+0.301)#376 | 3.5%(+0.878)#4,264 |
| 11. | 90049 | 4.2% | 4.1%(+0.124)#390 | 3.5%(+0.702)#4,563 |
| 12. | 90036 | 3.9% | 4.1%(-0.163)#448 | 3.5%(+0.414)#5,177 |
| 13. | 90015 | 3.8% | 4.1%(-0.256)#464 | 3.5%(+0.322)#5,362 |
| 14. | 90007 | 3.7% | 4.1%(-0.395)#496 | 3.5%(+0.182)#5,706 |
| 15. | 90014 | 3.7% | 4.1%(-0.439)#502 | 3.5%(+0.139)#5,811 |
| 16. | 90017 | 3.5% | 4.1%(-0.569)#516 | 3.5%(+0.008)#6,121 |
| 17. | 90028 | 3.4% | 4.1%(-0.681)#536 | 3.5%(-0.103)#6,422 |
| 18. | 90016 | 3.3% | 4.1%(-0.801)#564 | 3.5%(-0.224)#6,778 |
| 19. | 90013 | 3.2% | 4.1%(-0.856)#579 | 3.5%(-0.279)#6,957 |
| 20. | 90027 | 3.2% | 4.1%(-0.943)#593 | 3.5%(-0.366)#7,229 |
| 21. | 90048 | 3.1% | 4.1%(-0.969)#599 | 3.5%(-0.391)#7,319 |
| 22. | 90005 | 2.9% | 4.1%(-1.19)#650 | 3.5%(-0.614)#8,067 |
| 23. | 90026 | 2.7% | 4.1%(-1.38)#687 | 3.5%(-0.801)#8,737 |
| 24. | 90041 | 2.7% | 4.1%(-1.43)#703 | 3.5%(-0.853)#8,946 |
| 25. | 90029 | 2.5% | 4.1%(-1.64)#755 | 3.5%(-1.06)#9,785 |
| 26. | 90039 | 2.5% | 4.1%(-1.65)#758 | 3.5%(-1.07)#9,830 |
| 27. | 90056 | 2.4% | 4.1%(-1.72)#771 | 3.5%(-1.14)#10,118 |
| 28. | 90065 | 2.3% | 4.1%(-1.80)#793 | 3.5%(-1.22)#10,420 |
| 29. | 90068 | 2.3% | 4.1%(-1.85)#803 | 3.5%(-1.27)#10,659 |
| 30. | 90089 | 2.2% | 4.1%(-1.90)#822 | 3.5%(-1.32)#10,887 |
| 31. | 90032 | 2.2% | 4.1%(-1.90)#824 | 3.5%(-1.33)#10,893 |
| 32. | 90077 | 2.2% | 4.1%(-1.95)#838 | 3.5%(-1.37)#11,090 |
| 33. | 90038 | 2.1% | 4.1%(-1.98)#848 | 3.5%(-1.40)#11,247 |
| 34. | 90042 | 2.1% | 4.1%(-1.99)#851 | 3.5%(-1.41)#11,297 |
| 35. | 90018 | 2.1% | 4.1%(-2.01)#857 | 3.5%(-1.43)#11,393 |
| 36. | 90043 | 2.1% | 4.1%(-2.03)#861 | 3.5%(-1.46)#11,483 |
| 37. | 90019 | 2.1% | 4.1%(-2.05)#863 | 3.5%(-1.47)#11,534 |
| 38. | 90004 | 1.9% | 4.1%(-2.17)#892 | 3.5%(-1.59)#12,122 |
| 39. | 90020 | 1.9% | 4.1%(-2.18)#899 | 3.5%(-1.60)#12,187 |
| 40. | 90062 | 1.6% | 4.1%(-2.50)#987 | 3.5%(-1.92)#13,802 |
| 41. | 90008 | 1.6% | 4.1%(-2.52)#993 | 3.5%(-1.94)#13,902 |
| 42. | 90031 | 1.4% | 4.1%(-2.70)#1,043 | 3.5%(-2.12)#14,940 |
| 43. | 90006 | 1.3% | 4.1%(-2.77)#1,061 | 3.5%(-2.19)#15,322 |
| 44. | 90040 | 1.1% | 4.1%(-2.99)#1,117 | 3.5%(-2.42)#16,696 |
| 45. | 90063 | 1.0% | 4.1%(-3.07)#1,142 | 3.5%(-2.49)#17,186 |
| 46. | 90033 | 0.92% | 4.1%(-3.18)#1,169 | 3.5%(-2.61)#17,907 |
| 47. | 90022 | 0.92% | 4.1%(-3.18)#1,171 | 3.5%(-2.61)#17,912 |
| 48. | 90067 | 0.86% | 4.1%(-3.24)#1,186 | 3.5%(-2.66)#18,269 |
| 49. | 90057 | 0.85% | 4.1%(-3.25)#1,190 | 3.5%(-2.68)#18,343 |
| 50. | 90023 | 0.79% | 4.1%(-3.32)#1,204 | 3.5%(-2.74)#18,710 |
| 51. | 90047 | 0.75% | 4.1%(-3.36)#1,215 | 3.5%(-2.78)#18,973 |
| 52. | 90044 | 0.66% | 4.1%(-3.44)#1,231 | 3.5%(-2.87)#19,504 |
| 53. | 90061 | 0.58% | 4.1%(-3.52)#1,244 | 3.5%(-2.94)#19,974 |
| 54. | 90002 | 0.56% | 4.1%(-3.55)#1,255 | 3.5%(-2.97)#20,134 |
| 55. | 90037 | 0.52% | 4.1%(-3.58)#1,265 | 3.5%(-3.00)#20,347 |
| 56. | 90021 | 0.44% | 4.1%(-3.66)#1,283 | 3.5%(-3.08)#20,826 |
| 57. | 90003 | 0.44% | 4.1%(-3.66)#1,284 | 3.5%(-3.08)#20,830 |
| 58. | 90011 | 0.42% | 4.1%(-3.68)#1,287 | 3.5%(-3.10)#20,929 |
| 59. | 90059 | 0.42% | 4.1%(-3.68)#1,289 | 3.5%(-3.11)#20,961 |
| 60. | 90058 | 0.39% | 4.1%(-3.71)#1,294 | 3.5%(-3.13)#21,099 |
| 61. | 90001 | 0.27% | 4.1%(-3.83)#1,316 | 3.5%(-3.25)#21,749 |
1
Common Questions
What are the Top 10 Zip Codes with the Highest Percentage of Population Employed in Computer & Mathematics in Los Angeles, CA?
Top 10 Zip Codes with the Highest Percentage of Population Employed in Computer & Mathematics in Los Angeles, CA are:
What zip code has the Highest Percentage of Population Employed in Computer & Mathematics in Los Angeles, CA?
90034 has the Highest Percentage of Population Employed in Computer & Mathematics in Los Angeles, CA with 7.2%.
What is the Percentage of Population Employed in Computer & Mathematics in Los Angeles, CA?
Percentage of Population Employed in Computer & Mathematics in Los Angeles is 2.7%.
What is the Percentage of Population Employed in Computer & Mathematics in California?
Percentage of Population Employed in Computer & Mathematics in California is 4.1%.
What is the Percentage of Population Employed in Computer & Mathematics in the United States?
Percentage of Population Employed in Computer & Mathematics in the United States is 3.5%.