Cities with the Highest Percentage of Population Employed in Computer & Mathematics in Delaware
RELATED REPORTS & OPTIONS
Computer & Mathematics
Delaware
Compare Cities
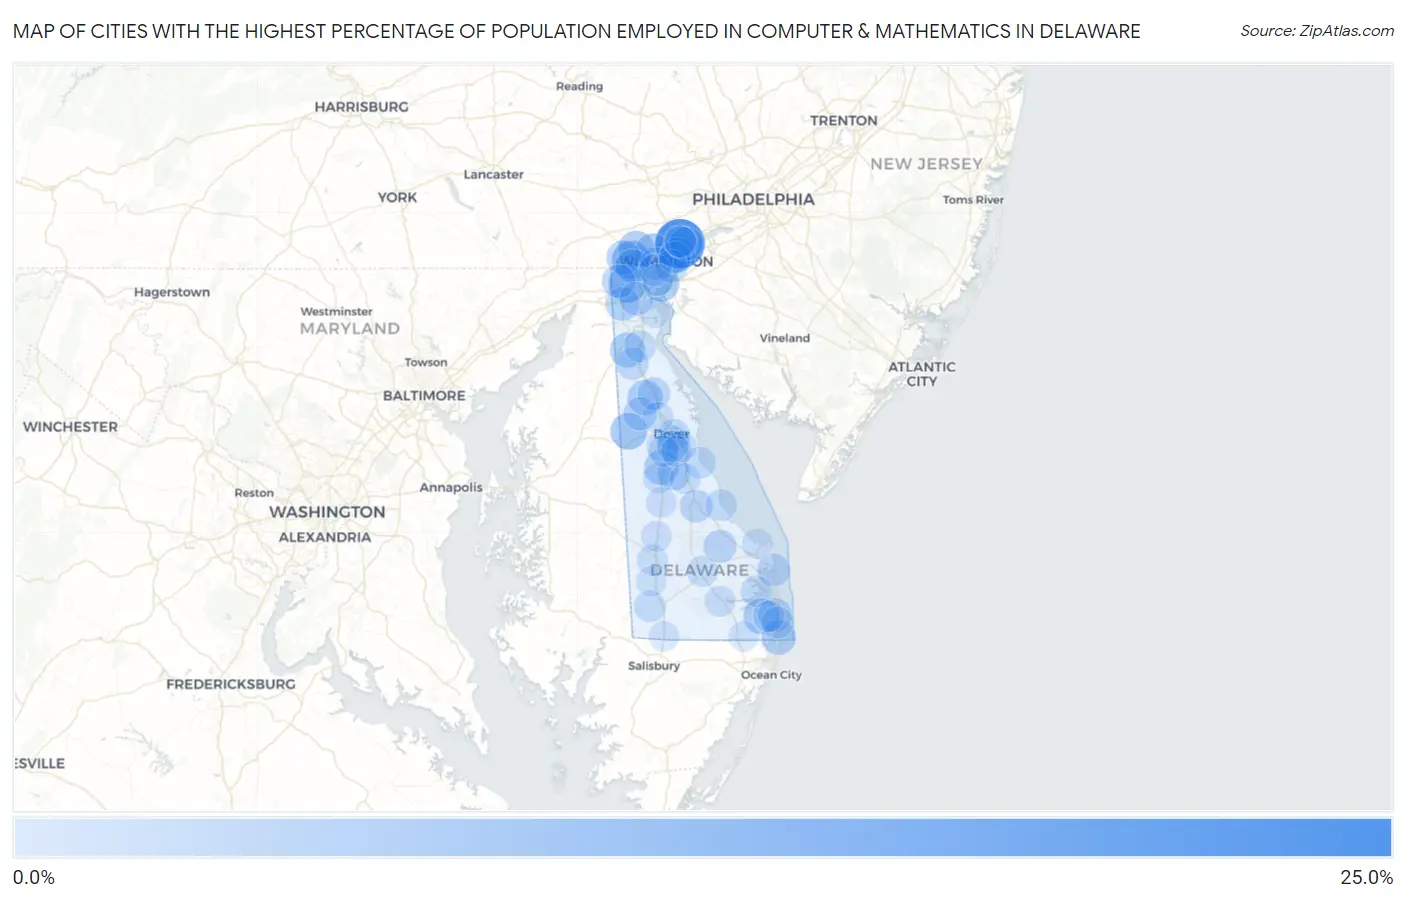
Map of Cities with the Highest Percentage of Population Employed in Computer & Mathematics in Delaware
0.0%
25.0%
Cities with the Highest Percentage of Population Employed in Computer & Mathematics in Delaware
| City | % Employed | vs State | vs National | |
| 1. | Ardencroft | 21.9% | 3.4%(+18.6)#1 | 3.5%(+18.4)#141 |
| 2. | Pike Creek | 9.2% | 3.4%(+5.80)#2 | 3.5%(+5.63)#907 |
| 3. | Brookside | 8.4% | 3.4%(+5.04)#3 | 3.5%(+4.87)#1,093 |
| 4. | Hartly | 7.2% | 3.4%(+3.89)#4 | 3.5%(+3.72)#1,494 |
| 5. | New Castle | 6.5% | 3.4%(+3.17)#5 | 3.5%(+3.00)#1,856 |
| 6. | Hockessin | 6.4% | 3.4%(+3.03)#6 | 3.5%(+2.86)#1,924 |
| 7. | Millville | 5.9% | 3.4%(+2.51)#7 | 3.5%(+2.34)#2,271 |
| 8. | Greenville | 5.5% | 3.4%(+2.12)#8 | 3.5%(+1.95)#2,591 |
| 9. | Middletown | 5.5% | 3.4%(+2.12)#9 | 3.5%(+1.95)#2,594 |
| 10. | Clayton | 5.4% | 3.4%(+2.06)#10 | 3.5%(+1.89)#2,647 |
| 11. | Bellefonte | 5.2% | 3.4%(+1.86)#11 | 3.5%(+1.69)#2,847 |
| 12. | Viola | 4.9% | 3.4%(+1.52)#12 | 3.5%(+1.35)#3,234 |
| 13. | Fenwick Island | 4.7% | 3.4%(+1.32)#13 | 3.5%(+1.15)#3,479 |
| 14. | North Star | 4.7% | 3.4%(+1.31)#14 | 3.5%(+1.14)#3,485 |
| 15. | Pike Creek Valley | 4.4% | 3.4%(+1.01)#15 | 3.5%(+0.837)#3,877 |
| 16. | Glasgow | 4.3% | 3.4%(+0.905)#16 | 3.5%(+0.735)#4,038 |
| 17. | Bethany Beach | 4.1% | 3.4%(+0.738)#17 | 3.5%(+0.567)#4,323 |
| 18. | Claymont | 3.9% | 3.4%(+0.538)#18 | 3.5%(+0.368)#4,653 |
| 19. | Newark | 3.8% | 3.4%(+0.445)#19 | 3.5%(+0.275)#4,824 |
| 20. | Bear | 3.7% | 3.4%(+0.346)#20 | 3.5%(+0.176)#5,009 |
| 21. | Kenton | 3.6% | 3.4%(+0.260)#21 | 3.5%(+0.090)#5,177 |
| 22. | Milton | 3.2% | 3.4%(-0.161)#22 | 3.5%(-0.331)#6,131 |
| 23. | Milford | 3.2% | 3.4%(-0.204)#23 | 3.5%(-0.375)#6,236 |
| 24. | Riverview | 3.1% | 3.4%(-0.258)#24 | 3.5%(-0.429)#6,367 |
| 25. | Elsmere | 3.1% | 3.4%(-0.265)#25 | 3.5%(-0.435)#6,381 |
| 26. | Wilmington | 3.0% | 3.4%(-0.308)#26 | 3.5%(-0.478)#6,486 |
| 27. | Dewey Beach | 2.9% | 3.4%(-0.464)#27 | 3.5%(-0.634)#6,860 |
| 28. | Smyrna | 2.8% | 3.4%(-0.588)#28 | 3.5%(-0.758)#7,203 |
| 29. | Kent Acres | 2.7% | 3.4%(-0.676)#29 | 3.5%(-0.846)#7,435 |
| 30. | Newport | 2.4% | 3.4%(-0.951)#30 | 3.5%(-1.12)#8,253 |
| 31. | Townsend | 2.3% | 3.4%(-1.01)#31 | 3.5%(-1.18)#8,450 |
| 32. | Dover | 2.2% | 3.4%(-1.18)#32 | 3.5%(-1.35)#9,023 |
| 33. | Edgemoor | 2.1% | 3.4%(-1.26)#33 | 3.5%(-1.43)#9,316 |
| 34. | South Bethany | 2.1% | 3.4%(-1.27)#34 | 3.5%(-1.44)#9,366 |
| 35. | Ardentown | 2.0% | 3.4%(-1.35)#35 | 3.5%(-1.52)#9,650 |
| 36. | Bowers | 2.0% | 3.4%(-1.39)#36 | 3.5%(-1.56)#9,800 |
| 37. | Wilmington Manor | 1.9% | 3.4%(-1.44)#37 | 3.5%(-1.61)#9,972 |
| 38. | Odessa | 1.8% | 3.4%(-1.55)#38 | 3.5%(-1.72)#10,390 |
| 39. | Slaughter Beach | 1.7% | 3.4%(-1.63)#39 | 3.5%(-1.80)#10,739 |
| 40. | Wyoming | 1.7% | 3.4%(-1.64)#40 | 3.5%(-1.81)#10,798 |
| 41. | Bethel | 1.7% | 3.4%(-1.67)#41 | 3.5%(-1.84)#10,928 |
| 42. | Arden | 1.7% | 3.4%(-1.68)#42 | 3.5%(-1.85)#10,959 |
| 43. | Felton | 1.5% | 3.4%(-1.90)#43 | 3.5%(-2.07)#11,878 |
| 44. | Cheswold | 1.4% | 3.4%(-1.97)#44 | 3.5%(-2.14)#12,161 |
| 45. | Long Neck | 1.4% | 3.4%(-1.99)#45 | 3.5%(-2.17)#12,273 |
| 46. | Dover Base Housing | 1.3% | 3.4%(-2.01)#46 | 3.5%(-2.18)#12,309 |
| 47. | Ocean View | 1.3% | 3.4%(-2.03)#47 | 3.5%(-2.20)#12,446 |
| 48. | Highland Acres | 1.3% | 3.4%(-2.07)#48 | 3.5%(-2.24)#12,601 |
| 49. | Camden | 1.1% | 3.4%(-2.22)#49 | 3.5%(-2.39)#13,312 |
| 50. | Georgetown | 1.1% | 3.4%(-2.23)#50 | 3.5%(-2.40)#13,337 |
| 51. | Bridgeville | 1.1% | 3.4%(-2.24)#51 | 3.5%(-2.41)#13,393 |
| 52. | Millsboro | 1.1% | 3.4%(-2.25)#52 | 3.5%(-2.42)#13,439 |
| 53. | Rising Sun Lebanon | 1.0% | 3.4%(-2.30)#53 | 3.5%(-2.48)#13,695 |
| 54. | Frederica | 1.0% | 3.4%(-2.32)#54 | 3.5%(-2.49)#13,769 |
| 55. | Greenwood | 0.80% | 3.4%(-2.56)#55 | 3.5%(-2.73)#14,858 |
| 56. | Harrington | 0.76% | 3.4%(-2.59)#56 | 3.5%(-2.76)#15,014 |
| 57. | Lewes | 0.67% | 3.4%(-2.68)#57 | 3.5%(-2.85)#15,448 |
| 58. | Delaware City | 0.56% | 3.4%(-2.80)#58 | 3.5%(-2.97)#16,000 |
| 59. | Selbyville | 0.40% | 3.4%(-2.95)#59 | 3.5%(-3.12)#16,600 |
| 60. | Delmar | 0.40% | 3.4%(-2.95)#60 | 3.5%(-3.12)#16,601 |
| 61. | Seaford | 0.38% | 3.4%(-2.98)#61 | 3.5%(-3.15)#16,688 |
1
Common Questions
What are the Top 10 Cities with the Highest Percentage of Population Employed in Computer & Mathematics in Delaware?
Top 10 Cities with the Highest Percentage of Population Employed in Computer & Mathematics in Delaware are:
#1
21.9%
#2
9.2%
#3
8.4%
#4
7.2%
#5
6.5%
#6
6.4%
#7
5.9%
#8
5.5%
#9
5.5%
#10
5.4%
What city has the Highest Percentage of Population Employed in Computer & Mathematics in Delaware?
Ardencroft has the Highest Percentage of Population Employed in Computer & Mathematics in Delaware with 21.9%.
What is the Percentage of Population Employed in Computer & Mathematics in the State of Delaware?
Percentage of Population Employed in Computer & Mathematics in Delaware is 3.4%.
What is the Percentage of Population Employed in Computer & Mathematics in the United States?
Percentage of Population Employed in Computer & Mathematics in the United States is 3.5%.