Cities with the Highest Percentage of Population Employed in Computer & Mathematics in New York
RELATED REPORTS & OPTIONS
Computer & Mathematics
New York
Compare Cities
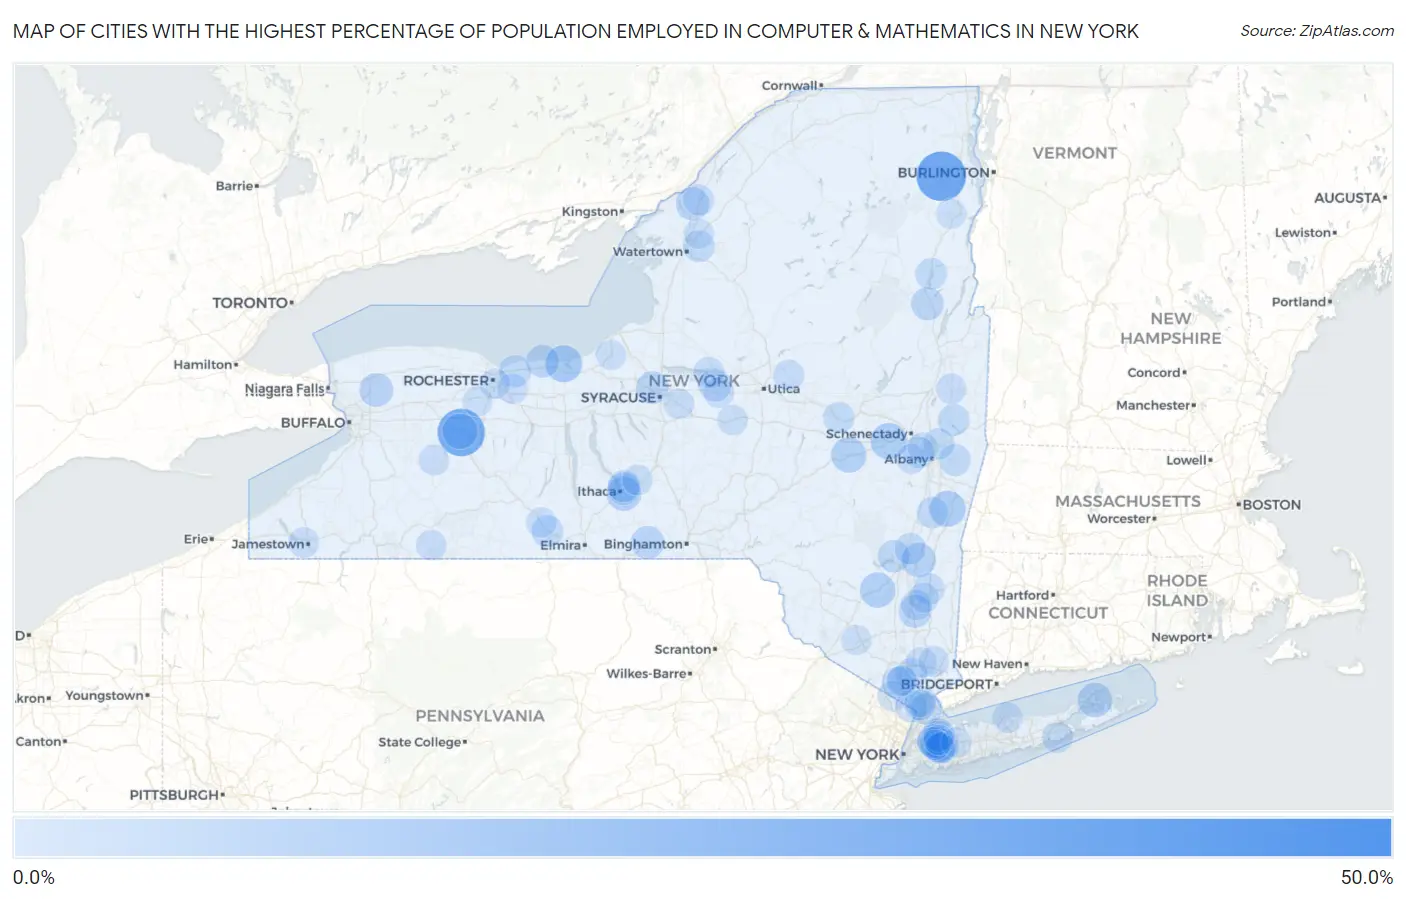
Map of Cities with the Highest Percentage of Population Employed in Computer & Mathematics in New York
0.0%
50.0%
Cities with the Highest Percentage of Population Employed in Computer & Mathematics in New York
| City | % Employed | vs State | vs National | |
| 1. | North Bay | 45.8% | 3.1%(+42.6)#1 | 3.5%(+42.2)#26 |
| 2. | Au Sable Forks | 34.7% | 3.1%(+31.6)#2 | 3.5%(+31.2)#52 |
| 3. | Wadsworth | 31.5% | 3.1%(+28.4)#3 | 3.5%(+28.0)#63 |
| 4. | Westford | 15.9% | 3.1%(+12.8)#4 | 3.5%(+12.4)#274 |
| 5. | Sodus Point | 15.7% | 3.1%(+12.6)#5 | 3.5%(+12.2)#283 |
| 6. | Duanesburg | 14.9% | 3.1%(+11.8)#6 | 3.5%(+11.4)#322 |
| 7. | East Frankfort | 14.5% | 3.1%(+11.4)#7 | 3.5%(+11.0)#342 |
| 8. | Ghent | 14.4% | 3.1%(+11.3)#8 | 3.5%(+10.9)#345 |
| 9. | Greigsville | 13.6% | 3.1%(+10.5)#9 | 3.5%(+10.1)#385 |
| 10. | Cobleskill | 13.4% | 3.1%(+10.3)#10 | 3.5%(+9.89)#400 |
| 11. | Accord | 13.3% | 3.1%(+10.2)#11 | 3.5%(+9.81)#404 |
| 12. | Swan Lake | 12.4% | 3.1%(+9.24)#12 | 3.5%(+8.85)#465 |
| 13. | Shelter Island Heights | 12.3% | 3.1%(+9.19)#13 | 3.5%(+8.79)#470 |
| 14. | Red Hook | 12.1% | 3.1%(+8.94)#14 | 3.5%(+8.54)#492 |
| 15. | East Ithaca | 12.0% | 3.1%(+8.86)#15 | 3.5%(+8.47)#497 |
| 16. | Rapids | 11.1% | 3.1%(+7.98)#16 | 3.5%(+7.59)#574 |
| 17. | Saddle Rock Estates | 10.9% | 3.1%(+7.79)#17 | 3.5%(+7.39)#600 |
| 18. | Plessis | 10.6% | 3.1%(+7.50)#18 | 3.5%(+7.10)#638 |
| 19. | Owego | 10.5% | 3.1%(+7.35)#19 | 3.5%(+6.96)#658 |
| 20. | Port Washington North | 10.4% | 3.1%(+7.30)#20 | 3.5%(+6.91)#668 |
| 21. | Chestertown | 10.1% | 3.1%(+6.94)#21 | 3.5%(+6.54)#721 |
| 22. | Spackenkill | 10.0% | 3.1%(+6.92)#22 | 3.5%(+6.52)#725 |
| 23. | Pultneyville | 10.0% | 3.1%(+6.90)#23 | 3.5%(+6.50)#728 |
| 24. | Westernville | 9.8% | 3.1%(+6.71)#24 | 3.5%(+6.31)#760 |
| 25. | Liverpool | 9.7% | 3.1%(+6.59)#25 | 3.5%(+6.20)#785 |
| 26. | Durhamville | 9.5% | 3.1%(+6.41)#26 | 3.5%(+6.01)#825 |
| 27. | Forest Home | 9.5% | 3.1%(+6.37)#27 | 3.5%(+5.97)#835 |
| 28. | Zena | 9.2% | 3.1%(+6.05)#28 | 3.5%(+5.66)#898 |
| 29. | Webster | 9.0% | 3.1%(+5.86)#29 | 3.5%(+5.47)#942 |
| 30. | Sparkill | 8.7% | 3.1%(+5.54)#30 | 3.5%(+5.14)#1,016 |
| 31. | Averill Park | 8.6% | 3.1%(+5.51)#31 | 3.5%(+5.11)#1,026 |
| 32. | York | 8.6% | 3.1%(+5.44)#32 | 3.5%(+5.05)#1,044 |
| 33. | Valley Falls | 8.5% | 3.1%(+5.40)#33 | 3.5%(+5.00)#1,053 |
| 34. | Searingtown | 8.5% | 3.1%(+5.39)#34 | 3.5%(+4.99)#1,055 |
| 35. | Northeast Ithaca | 8.4% | 3.1%(+5.31)#35 | 3.5%(+4.92)#1,078 |
| 36. | Black River | 8.4% | 3.1%(+5.30)#36 | 3.5%(+4.91)#1,081 |
| 37. | Montrose | 8.4% | 3.1%(+5.28)#37 | 3.5%(+4.88)#1,088 |
| 38. | Coopers Plains | 8.4% | 3.1%(+5.27)#38 | 3.5%(+4.88)#1,090 |
| 39. | Schroon Lake | 8.3% | 3.1%(+5.14)#39 | 3.5%(+4.75)#1,124 |
| 40. | Greenville Cdp Westchester County | 8.2% | 3.1%(+5.07)#40 | 3.5%(+4.67)#1,148 |
| 41. | Thomaston | 8.2% | 3.1%(+5.05)#41 | 3.5%(+4.66)#1,153 |
| 42. | Hartsdale | 8.2% | 3.1%(+5.03)#42 | 3.5%(+4.63)#1,163 |
| 43. | Tioga Terrace | 8.1% | 3.1%(+5.00)#43 | 3.5%(+4.60)#1,169 |
| 44. | New Hackensack | 8.0% | 3.1%(+4.87)#44 | 3.5%(+4.48)#1,213 |
| 45. | Saugerties South | 8.0% | 3.1%(+4.86)#45 | 3.5%(+4.46)#1,226 |
| 46. | Salt Point | 8.0% | 3.1%(+4.83)#46 | 3.5%(+4.44)#1,240 |
| 47. | Stottville | 7.9% | 3.1%(+4.80)#47 | 3.5%(+4.40)#1,253 |
| 48. | Green Island | 7.9% | 3.1%(+4.78)#48 | 3.5%(+4.39)#1,258 |
| 49. | Westmere | 7.9% | 3.1%(+4.76)#49 | 3.5%(+4.36)#1,270 |
| 50. | Tarrytown | 7.8% | 3.1%(+4.68)#50 | 3.5%(+4.29)#1,290 |
| 51. | Palatine Bridge | 7.8% | 3.1%(+4.67)#51 | 3.5%(+4.27)#1,301 |
| 52. | Lake Success | 7.7% | 3.1%(+4.60)#52 | 3.5%(+4.21)#1,318 |
| 53. | Pomona | 7.7% | 3.1%(+4.53)#53 | 3.5%(+4.14)#1,350 |
| 54. | Sylvan Beach | 7.5% | 3.1%(+4.35)#54 | 3.5%(+3.96)#1,411 |
| 55. | Redwood | 7.5% | 3.1%(+4.32)#55 | 3.5%(+3.93)#1,418 |
| 56. | Milton Cdp Saratoga County | 7.2% | 3.1%(+4.08)#56 | 3.5%(+3.68)#1,512 |
| 57. | Westhampton | 7.2% | 3.1%(+4.08)#57 | 3.5%(+3.68)#1,513 |
| 58. | Herricks | 7.2% | 3.1%(+4.03)#58 | 3.5%(+3.64)#1,525 |
| 59. | North New Hyde Park | 7.1% | 3.1%(+4.01)#59 | 3.5%(+3.61)#1,542 |
| 60. | Lake Delta | 7.1% | 3.1%(+3.93)#60 | 3.5%(+3.54)#1,572 |
| 61. | Baxter Estates | 7.0% | 3.1%(+3.91)#61 | 3.5%(+3.51)#1,581 |
| 62. | Irvington | 7.0% | 3.1%(+3.90)#62 | 3.5%(+3.50)#1,583 |
| 63. | Newport | 7.0% | 3.1%(+3.88)#63 | 3.5%(+3.48)#1,593 |
| 64. | Varna | 7.0% | 3.1%(+3.84)#64 | 3.5%(+3.44)#1,614 |
| 65. | Gainesville | 7.0% | 3.1%(+3.83)#65 | 3.5%(+3.43)#1,618 |
| 66. | Newfield | 6.9% | 3.1%(+3.80)#66 | 3.5%(+3.41)#1,629 |
| 67. | Lake Mohegan | 6.9% | 3.1%(+3.77)#67 | 3.5%(+3.37)#1,652 |
| 68. | Celoron | 6.9% | 3.1%(+3.76)#68 | 3.5%(+3.37)#1,656 |
| 69. | Harbor Hills | 6.8% | 3.1%(+3.71)#69 | 3.5%(+3.31)#1,688 |
| 70. | Shenorock | 6.8% | 3.1%(+3.71)#70 | 3.5%(+3.31)#1,689 |
| 71. | Poquott | 6.8% | 3.1%(+3.70)#71 | 3.5%(+3.31)#1,692 |
| 72. | Oneida Castle | 6.8% | 3.1%(+3.66)#72 | 3.5%(+3.27)#1,709 |
| 73. | Manlius | 6.7% | 3.1%(+3.60)#73 | 3.5%(+3.20)#1,747 |
| 74. | Wurtsboro Hills | 6.7% | 3.1%(+3.58)#74 | 3.5%(+3.19)#1,755 |
| 75. | Schuylerville | 6.7% | 3.1%(+3.57)#75 | 3.5%(+3.17)#1,761 |
| 76. | Arlington | 6.7% | 3.1%(+3.57)#76 | 3.5%(+3.17)#1,762 |
| 77. | Freeville | 6.7% | 3.1%(+3.57)#77 | 3.5%(+3.17)#1,763 |
| 78. | Manhasset Hills | 6.7% | 3.1%(+3.53)#78 | 3.5%(+3.13)#1,783 |
| 79. | Richburg | 6.6% | 3.1%(+3.48)#79 | 3.5%(+3.08)#1,808 |
| 80. | Madison | 6.6% | 3.1%(+3.45)#80 | 3.5%(+3.05)#1,827 |
| 81. | Airmont | 6.5% | 3.1%(+3.40)#81 | 3.5%(+3.01)#1,854 |
| 82. | Crest View Heights | 6.5% | 3.1%(+3.32)#82 | 3.5%(+2.93)#1,894 |
| 83. | Campbell | 6.5% | 3.1%(+3.32)#83 | 3.5%(+2.93)#1,895 |
| 84. | Fairport | 6.4% | 3.1%(+3.32)#84 | 3.5%(+2.92)#1,899 |
| 85. | Brighton | 6.4% | 3.1%(+3.24)#85 | 3.5%(+2.84)#1,929 |
| 86. | Thiells | 6.3% | 3.1%(+3.22)#86 | 3.5%(+2.82)#1,941 |
| 87. | Washington Heights | 6.3% | 3.1%(+3.22)#87 | 3.5%(+2.82)#1,942 |
| 88. | Macdonnell Heights | 6.3% | 3.1%(+3.18)#88 | 3.5%(+2.78)#1,964 |
| 89. | Elizabethtown | 6.3% | 3.1%(+3.15)#89 | 3.5%(+2.76)#1,981 |
| 90. | Fairview Cdp Dutchess County | 6.2% | 3.1%(+3.10)#90 | 3.5%(+2.71)#2,006 |
| 91. | Pleasant Valley | 6.2% | 3.1%(+3.10)#91 | 3.5%(+2.70)#2,008 |
| 92. | Mount Ivy | 6.2% | 3.1%(+3.08)#92 | 3.5%(+2.68)#2,026 |
| 93. | Jericho | 6.2% | 3.1%(+3.07)#93 | 3.5%(+2.67)#2,032 |
| 94. | University Gardens | 6.2% | 3.1%(+3.06)#94 | 3.5%(+2.67)#2,037 |
| 95. | Voorheesville | 6.2% | 3.1%(+3.04)#95 | 3.5%(+2.65)#2,056 |
| 96. | Colonie | 6.2% | 3.1%(+3.04)#96 | 3.5%(+2.64)#2,059 |
| 97. | Evans Mills | 6.2% | 3.1%(+3.03)#97 | 3.5%(+2.64)#2,061 |
| 98. | Scottsville | 6.1% | 3.1%(+2.98)#98 | 3.5%(+2.59)#2,095 |
| 99. | Hannibal | 6.1% | 3.1%(+2.96)#99 | 3.5%(+2.56)#2,108 |
| 100. | Plandome | 6.0% | 3.1%(+2.89)#100 | 3.5%(+2.49)#2,156 |
Common Questions
What are the Top 10 Cities with the Highest Percentage of Population Employed in Computer & Mathematics in New York?
Top 10 Cities with the Highest Percentage of Population Employed in Computer & Mathematics in New York are:
#1
34.7%
#2
31.5%
#3
15.7%
#4
14.9%
#5
14.4%
#6
13.6%
#7
13.4%
#8
13.3%
#9
12.3%
#10
12.1%
What city has the Highest Percentage of Population Employed in Computer & Mathematics in New York?
Au Sable Forks has the Highest Percentage of Population Employed in Computer & Mathematics in New York with 34.7%.
What is the Percentage of Population Employed in Computer & Mathematics in the State of New York?
Percentage of Population Employed in Computer & Mathematics in New York is 3.1%.
What is the Percentage of Population Employed in Computer & Mathematics in the United States?
Percentage of Population Employed in Computer & Mathematics in the United States is 3.5%.