Cities with the Highest Percentage of Population Employed in Computer & Mathematics in Vermont
RELATED REPORTS & OPTIONS
Computer & Mathematics
Vermont
Compare Cities
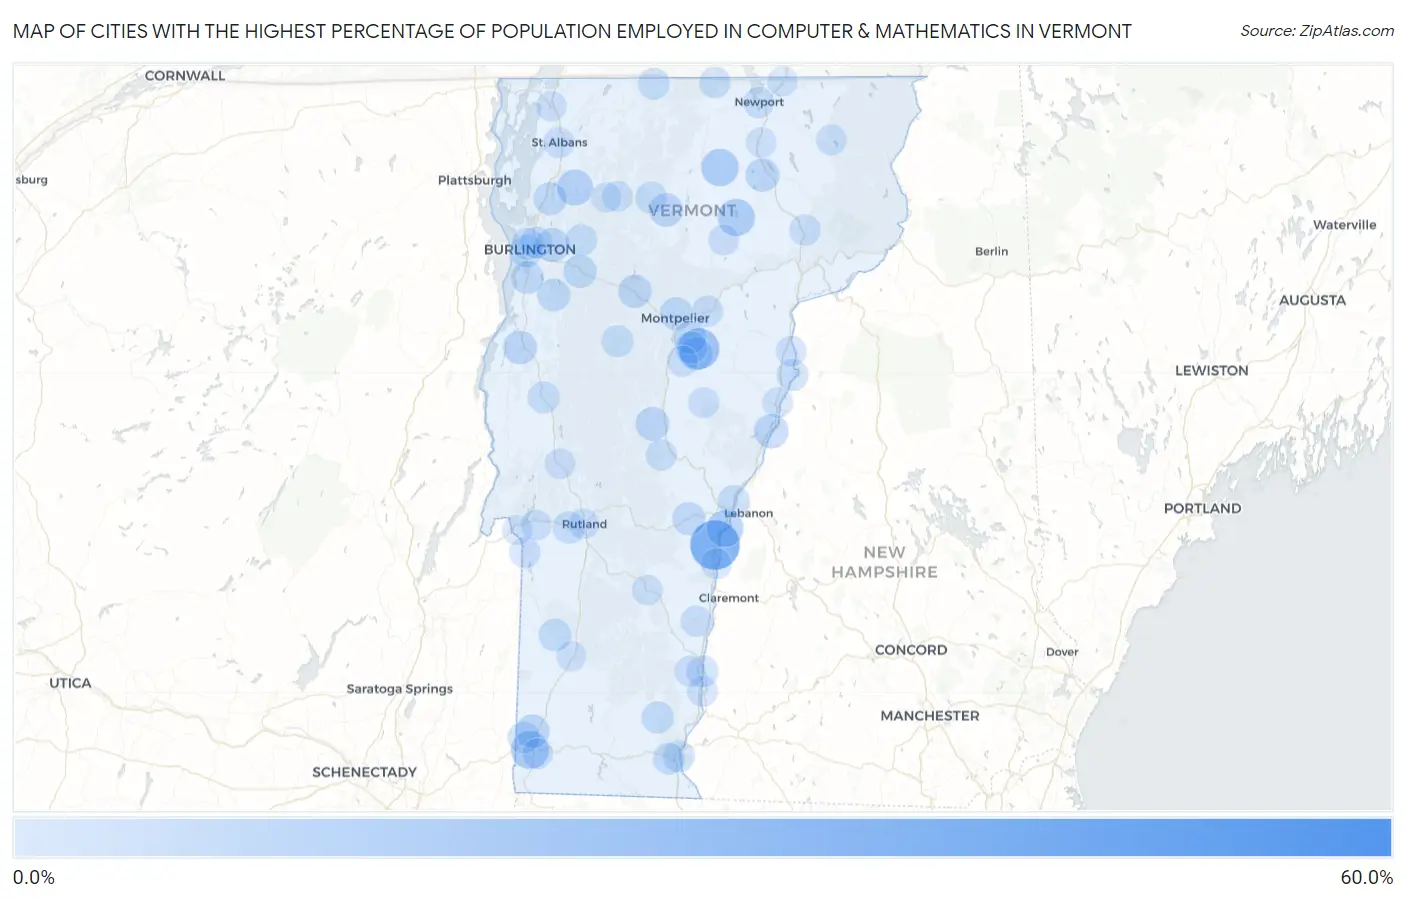
Map of Cities with the Highest Percentage of Population Employed in Computer & Mathematics in Vermont
0.0%
60.0%
Cities with the Highest Percentage of Population Employed in Computer & Mathematics in Vermont
| City | % Employed | vs State | vs National | |
| 1. | Huntington Center | 54.8% | 2.8%(+52.1)#1 | 3.5%(+51.3)#14 |
| 2. | Hartland | 33.3% | 2.8%(+30.5)#2 | 3.5%(+29.8)#57 |
| 3. | Websterville | 19.0% | 2.8%(+16.2)#3 | 3.5%(+15.4)#191 |
| 4. | Westford | 16.1% | 2.8%(+13.3)#4 | 3.5%(+12.6)#264 |
| 5. | South Lincoln | 15.9% | 2.8%(+13.1)#5 | 3.5%(+12.4)#275 |
| 6. | Old Bennington | 13.3% | 2.8%(+10.5)#6 | 3.5%(+9.73)#413 |
| 7. | East Poultney | 13.0% | 2.8%(+10.3)#7 | 3.5%(+9.52)#430 |
| 8. | Albany | 12.2% | 2.8%(+9.46)#8 | 3.5%(+8.72)#478 |
| 9. | Greensboro | 11.9% | 2.8%(+9.12)#9 | 3.5%(+8.38)#505 |
| 10. | Waterbury Center | 11.5% | 2.8%(+8.68)#10 | 3.5%(+7.94)#544 |
| 11. | North Hartland | 11.0% | 2.8%(+8.21)#11 | 3.5%(+7.47)#592 |
| 12. | Fairfax | 9.8% | 2.8%(+6.99)#12 | 3.5%(+6.26)#777 |
| 13. | Hartford | 7.8% | 2.8%(+5.03)#13 | 3.5%(+4.29)#1,289 |
| 14. | Essex Junction | 6.9% | 2.8%(+4.12)#14 | 3.5%(+3.39)#1,648 |
| 15. | Fairlee | 6.9% | 2.8%(+4.11)#15 | 3.5%(+3.37)#1,655 |
| 16. | Randolph | 6.3% | 2.8%(+3.54)#16 | 3.5%(+2.80)#1,951 |
| 17. | St. George | 6.2% | 2.8%(+3.43)#17 | 3.5%(+2.70)#2,012 |
| 18. | Vergennes | 6.2% | 2.8%(+3.41)#18 | 3.5%(+2.68)#2,031 |
| 19. | Glover | 6.2% | 2.8%(+3.37)#19 | 3.5%(+2.63)#2,072 |
| 20. | Hyde Park | 6.1% | 2.8%(+3.32)#20 | 3.5%(+2.58)#2,098 |
| 21. | South Shaftsbury | 6.1% | 2.8%(+3.30)#21 | 3.5%(+2.56)#2,112 |
| 22. | Waterbury | 5.5% | 2.8%(+2.67)#22 | 3.5%(+1.93)#2,606 |
| 23. | Graniteville | 5.4% | 2.8%(+2.65)#23 | 3.5%(+1.91)#2,629 |
| 24. | Milton | 5.3% | 2.8%(+2.47)#24 | 3.5%(+1.73)#2,810 |
| 25. | Montpelier | 5.2% | 2.8%(+2.46)#25 | 3.5%(+1.72)#2,816 |
| 26. | Richmond | 5.2% | 2.8%(+2.41)#26 | 3.5%(+1.67)#2,866 |
| 27. | Woodstock | 5.2% | 2.8%(+2.37)#27 | 3.5%(+1.63)#2,906 |
| 28. | Hinesburg | 4.8% | 2.8%(+2.06)#28 | 3.5%(+1.32)#3,267 |
| 29. | Barre | 4.7% | 2.8%(+1.90)#29 | 3.5%(+1.16)#3,456 |
| 30. | Shelburne | 4.5% | 2.8%(+1.72)#30 | 3.5%(+0.985)#3,667 |
| 31. | Dorset | 4.3% | 2.8%(+1.53)#31 | 3.5%(+0.792)#3,955 |
| 32. | South Burlington | 4.1% | 2.8%(+1.33)#32 | 3.5%(+0.595)#4,279 |
| 33. | Grafton | 3.7% | 2.8%(+0.916)#33 | 3.5%(+0.179)#5,005 |
| 34. | Wilder | 3.6% | 2.8%(+0.848)#34 | 3.5%(+0.111)#5,142 |
| 35. | South Barre | 3.6% | 2.8%(+0.809)#35 | 3.5%(+0.072)#5,213 |
| 36. | Newfane | 3.5% | 2.8%(+0.721)#36 | 3.5%(-0.016)#5,409 |
| 37. | West Rutland | 3.5% | 2.8%(+0.705)#37 | 3.5%(-0.032)#5,434 |
| 38. | Huntington | 3.5% | 2.8%(+0.697)#38 | 3.5%(-0.040)#5,456 |
| 39. | Waitsfield | 3.4% | 2.8%(+0.661)#39 | 3.5%(-0.076)#5,536 |
| 40. | North Bennington | 3.4% | 2.8%(+0.643)#40 | 3.5%(-0.094)#5,571 |
| 41. | Stamford | 3.4% | 2.8%(+0.602)#41 | 3.5%(-0.135)#5,657 |
| 42. | Burlington | 3.3% | 2.8%(+0.523)#42 | 3.5%(-0.214)#5,842 |
| 43. | Winooski | 3.3% | 2.8%(+0.505)#43 | 3.5%(-0.232)#5,883 |
| 44. | Richford | 3.2% | 2.8%(+0.374)#44 | 3.5%(-0.363)#6,205 |
| 45. | Johnson | 3.1% | 2.8%(+0.337)#45 | 3.5%(-0.400)#6,299 |
| 46. | Middlebury | 3.1% | 2.8%(+0.321)#46 | 3.5%(-0.416)#6,331 |
| 47. | Proctor | 3.0% | 2.8%(+0.243)#47 | 3.5%(-0.494)#6,520 |
| 48. | Brattleboro | 3.0% | 2.8%(+0.194)#48 | 3.5%(-0.543)#6,649 |
| 49. | Bellows Falls | 2.9% | 2.8%(+0.160)#49 | 3.5%(-0.578)#6,728 |
| 50. | West Brattleboro | 2.8% | 2.8%(+0.048)#50 | 3.5%(-0.689)#7,005 |
| 51. | Jericho | 2.8% | 2.8%(+0.027)#51 | 3.5%(-0.710)#7,058 |
| 52. | Newbury | 2.7% | 2.8%(-0.085)#52 | 3.5%(-0.822)#7,371 |
| 53. | North Troy | 2.2% | 2.8%(-0.549)#53 | 3.5%(-1.29)#8,818 |
| 54. | South Londonderry | 2.2% | 2.8%(-0.637)#54 | 3.5%(-1.37)#9,126 |
| 55. | Lyndonville | 2.1% | 2.8%(-0.650)#55 | 3.5%(-1.39)#9,165 |
| 56. | Springfield | 2.1% | 2.8%(-0.734)#56 | 3.5%(-1.47)#9,461 |
| 57. | Plainfield | 2.0% | 2.8%(-0.803)#57 | 3.5%(-1.54)#9,704 |
| 58. | Bethel | 1.9% | 2.8%(-0.859)#58 | 3.5%(-1.60)#9,929 |
| 59. | Newport | 1.9% | 2.8%(-0.886)#59 | 3.5%(-1.62)#10,032 |
| 60. | Chelsea | 1.6% | 2.8%(-1.18)#60 | 3.5%(-1.92)#11,256 |
| 61. | New Haven | 1.5% | 2.8%(-1.26)#61 | 3.5%(-2.00)#11,574 |
| 62. | Saxtons River | 1.5% | 2.8%(-1.28)#62 | 3.5%(-2.02)#11,660 |
| 63. | Poultney | 1.5% | 2.8%(-1.29)#63 | 3.5%(-2.02)#11,676 |
| 64. | Westminster | 1.5% | 2.8%(-1.30)#64 | 3.5%(-2.04)#11,739 |
| 65. | St Albans | 1.4% | 2.8%(-1.34)#65 | 3.5%(-2.08)#11,906 |
| 66. | Williamstown | 1.4% | 2.8%(-1.36)#66 | 3.5%(-2.09)#11,972 |
| 67. | Underhill Flats | 1.2% | 2.8%(-1.55)#67 | 3.5%(-2.28)#12,834 |
| 68. | Windsor | 1.2% | 2.8%(-1.58)#68 | 3.5%(-2.32)#12,976 |
| 69. | Jeffersonville | 1.2% | 2.8%(-1.62)#69 | 3.5%(-2.36)#13,170 |
| 70. | Hardwick | 1.1% | 2.8%(-1.67)#70 | 3.5%(-2.41)#13,401 |
| 71. | Rutland | 1.0% | 2.8%(-1.77)#71 | 3.5%(-2.51)#13,835 |
| 72. | Bennington | 0.97% | 2.8%(-1.82)#72 | 3.5%(-2.55)#14,034 |
| 73. | Brandon | 0.96% | 2.8%(-1.83)#73 | 3.5%(-2.57)#14,089 |
| 74. | Island Pond | 0.95% | 2.8%(-1.84)#74 | 3.5%(-2.58)#14,128 |
| 75. | Castleton | 0.89% | 2.8%(-1.90)#75 | 3.5%(-2.64)#14,428 |
| 76. | Bakersfield | 0.86% | 2.8%(-1.93)#76 | 3.5%(-2.66)#14,545 |
| 77. | Wells River | 0.85% | 2.8%(-1.94)#77 | 3.5%(-2.68)#14,624 |
| 78. | Ludlow | 0.78% | 2.8%(-2.00)#78 | 3.5%(-2.74)#14,926 |
| 79. | Swanton | 0.76% | 2.8%(-2.02)#79 | 3.5%(-2.76)#15,015 |
| 80. | Cambridge | 0.74% | 2.8%(-2.05)#80 | 3.5%(-2.78)#15,131 |
| 81. | Bradford | 0.70% | 2.8%(-2.09)#81 | 3.5%(-2.83)#15,318 |
| 82. | Derby Line | 0.69% | 2.8%(-2.10)#82 | 3.5%(-2.84)#15,378 |
| 83. | Orleans | 0.63% | 2.8%(-2.16)#83 | 3.5%(-2.90)#15,678 |
| 84. | Fair Haven | 0.33% | 2.8%(-2.46)#84 | 3.5%(-3.20)#16,840 |
| 85. | Manchester Center | 0.32% | 2.8%(-2.47)#85 | 3.5%(-3.21)#16,867 |
1
2Common Questions
What are the Top 10 Cities with the Highest Percentage of Population Employed in Computer & Mathematics in Vermont?
Top 10 Cities with the Highest Percentage of Population Employed in Computer & Mathematics in Vermont are:
#1
33.3%
#2
19.0%
#3
13.3%
#4
12.2%
#5
11.9%
#6
11.0%
#7
9.8%
#8
6.9%
#9
6.9%
#10
6.3%
What city has the Highest Percentage of Population Employed in Computer & Mathematics in Vermont?
Hartland has the Highest Percentage of Population Employed in Computer & Mathematics in Vermont with 33.3%.
What is the Percentage of Population Employed in Computer & Mathematics in the State of Vermont?
Percentage of Population Employed in Computer & Mathematics in Vermont is 2.8%.
What is the Percentage of Population Employed in Computer & Mathematics in the United States?
Percentage of Population Employed in Computer & Mathematics in the United States is 3.5%.