Cities with the Highest Percentage of Population Employed in Computer & Mathematics in Alabama
RELATED REPORTS & OPTIONS
Computer & Mathematics
Alabama
Compare Cities
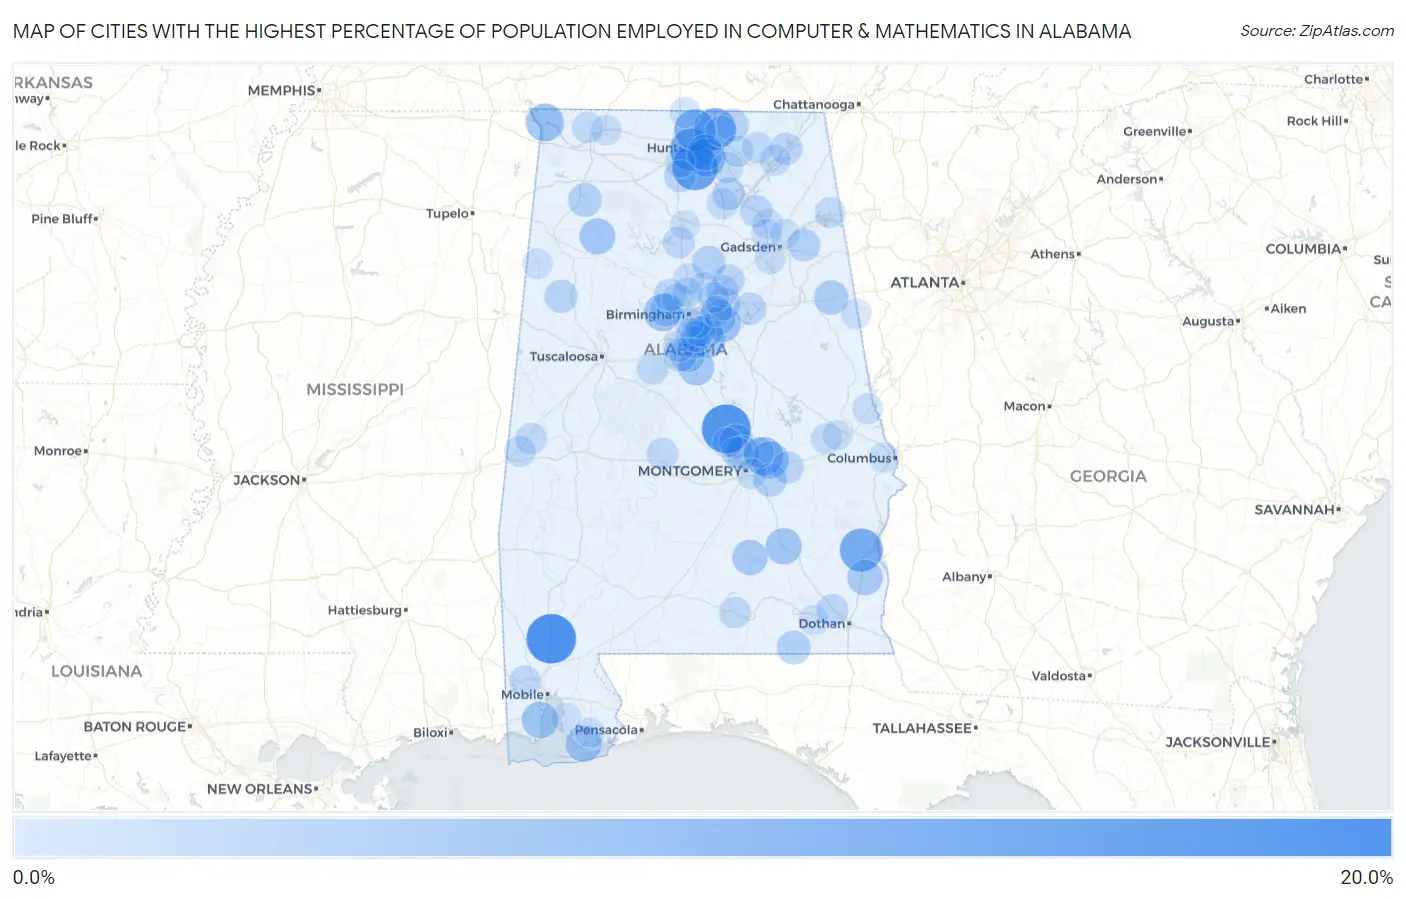
Map of Cities with the Highest Percentage of Population Employed in Computer & Mathematics in Alabama
0.0%
20.0%
Cities with the Highest Percentage of Population Employed in Computer & Mathematics in Alabama
| City | % Employed | vs State | vs National | |
| 1. | Mount Vernon | 16.5% | 2.5%(+14.0)#1 | 3.5%(+13.0)#250 |
| 2. | Marbury | 15.9% | 2.5%(+13.4)#2 | 3.5%(+12.4)#270 |
| 3. | Equality | 14.6% | 2.5%(+12.1)#3 | 3.5%(+11.1)#333 |
| 4. | Triana | 13.5% | 2.5%(+10.9)#4 | 3.5%(+9.94)#394 |
| 5. | Bakerhill | 11.7% | 2.5%(+9.17)#5 | 3.5%(+8.19)#524 |
| 6. | Madison | 11.4% | 2.5%(+8.84)#6 | 3.5%(+7.85)#551 |
| 7. | Meridianville | 10.7% | 2.5%(+8.13)#7 | 3.5%(+7.15)#634 |
| 8. | Harvest | 10.6% | 2.5%(+8.03)#8 | 3.5%(+7.05)#642 |
| 9. | Redstone Arsenal | 8.5% | 2.5%(+5.97)#9 | 3.5%(+4.99)#1,057 |
| 10. | Redland | 8.4% | 2.5%(+5.89)#10 | 3.5%(+4.91)#1,080 |
| 11. | Pea Ridge | 8.1% | 2.5%(+5.60)#11 | 3.5%(+4.62)#1,167 |
| 12. | Waterloo | 8.0% | 2.5%(+5.46)#12 | 3.5%(+4.48)#1,219 |
| 13. | Sylvan Springs | 7.6% | 2.5%(+5.03)#13 | 3.5%(+4.05)#1,379 |
| 14. | Emerald Mountain | 7.4% | 2.5%(+4.89)#14 | 3.5%(+3.91)#1,423 |
| 15. | Vandiver | 7.3% | 2.5%(+4.72)#15 | 3.5%(+3.74)#1,486 |
| 16. | Belle Fontaine | 7.1% | 2.5%(+4.54)#16 | 3.5%(+3.56)#1,561 |
| 17. | Dunnavant | 7.0% | 2.5%(+4.41)#17 | 3.5%(+3.43)#1,617 |
| 18. | Troy | 6.9% | 2.5%(+4.33)#18 | 3.5%(+3.35)#1,668 |
| 19. | Huntsville | 6.8% | 2.5%(+4.28)#19 | 3.5%(+3.30)#1,697 |
| 20. | Bon Secour | 6.8% | 2.5%(+4.24)#20 | 3.5%(+3.26)#1,716 |
| 21. | Chelsea | 6.8% | 2.5%(+4.22)#21 | 3.5%(+3.24)#1,724 |
| 22. | Eagle Point | 6.7% | 2.5%(+4.18)#22 | 3.5%(+3.20)#1,746 |
| 23. | Natural Bridge | 6.7% | 2.5%(+4.12)#23 | 3.5%(+3.14)#1,780 |
| 24. | Calera | 6.5% | 2.5%(+3.99)#24 | 3.5%(+3.01)#1,852 |
| 25. | Abbeville | 6.3% | 2.5%(+3.77)#25 | 3.5%(+2.79)#1,962 |
| 26. | Luverne | 6.2% | 2.5%(+3.64)#26 | 3.5%(+2.66)#2,046 |
| 27. | Alabaster | 5.7% | 2.5%(+3.18)#27 | 3.5%(+2.19)#2,376 |
| 28. | Heflin | 5.6% | 2.5%(+3.09)#28 | 3.5%(+2.11)#2,456 |
| 29. | Deatsville | 5.3% | 2.5%(+2.77)#29 | 3.5%(+1.79)#2,758 |
| 30. | Phil Campbell | 5.2% | 2.5%(+2.66)#30 | 3.5%(+1.68)#2,861 |
| 31. | Coosada | 5.1% | 2.5%(+2.59)#31 | 3.5%(+1.61)#2,939 |
| 32. | Highland Lakes | 5.1% | 2.5%(+2.56)#32 | 3.5%(+1.58)#2,965 |
| 33. | Geneva | 5.1% | 2.5%(+2.51)#33 | 3.5%(+1.53)#3,022 |
| 34. | Brantleyville | 5.1% | 2.5%(+2.51)#34 | 3.5%(+1.53)#3,025 |
| 35. | Pike Road | 4.9% | 2.5%(+2.38)#35 | 3.5%(+1.40)#3,178 |
| 36. | Locust Fork | 4.9% | 2.5%(+2.31)#36 | 3.5%(+1.33)#3,255 |
| 37. | Maytown | 4.8% | 2.5%(+2.26)#37 | 3.5%(+1.28)#3,318 |
| 38. | Belk | 4.7% | 2.5%(+2.17)#38 | 3.5%(+1.19)#3,423 |
| 39. | Hoover | 4.7% | 2.5%(+2.16)#39 | 3.5%(+1.18)#3,437 |
| 40. | Moody | 4.6% | 2.5%(+2.09)#40 | 3.5%(+1.11)#3,523 |
| 41. | Ballplay | 4.6% | 2.5%(+2.06)#41 | 3.5%(+1.08)#3,556 |
| 42. | New Market | 4.4% | 2.5%(+1.83)#42 | 3.5%(+0.853)#3,855 |
| 43. | Union Grove | 4.3% | 2.5%(+1.80)#43 | 3.5%(+0.823)#3,904 |
| 44. | Pell City | 4.2% | 2.5%(+1.69)#44 | 3.5%(+0.713)#4,059 |
| 45. | Hollywood | 4.2% | 2.5%(+1.64)#45 | 3.5%(+0.661)#4,151 |
| 46. | Albertville | 4.1% | 2.5%(+1.60)#46 | 3.5%(+0.617)#4,246 |
| 47. | Shorter | 4.1% | 2.5%(+1.57)#47 | 3.5%(+0.585)#4,289 |
| 48. | Graysville | 4.1% | 2.5%(+1.52)#48 | 3.5%(+0.542)#4,361 |
| 49. | Pinckard | 4.0% | 2.5%(+1.44)#49 | 3.5%(+0.464)#4,479 |
| 50. | Priceville | 4.0% | 2.5%(+1.44)#50 | 3.5%(+0.455)#4,493 |
| 51. | Argo | 3.9% | 2.5%(+1.35)#51 | 3.5%(+0.367)#4,654 |
| 52. | Pelham | 3.9% | 2.5%(+1.34)#52 | 3.5%(+0.357)#4,673 |
| 53. | Springville | 3.8% | 2.5%(+1.30)#53 | 3.5%(+0.322)#4,724 |
| 54. | Valley Grande | 3.8% | 2.5%(+1.27)#54 | 3.5%(+0.285)#4,803 |
| 55. | Dodge City | 3.8% | 2.5%(+1.27)#55 | 3.5%(+0.285)#4,804 |
| 56. | Helena | 3.8% | 2.5%(+1.22)#56 | 3.5%(+0.240)#4,885 |
| 57. | Sanford | 3.7% | 2.5%(+1.16)#57 | 3.5%(+0.179)#4,997 |
| 58. | Semmes | 3.7% | 2.5%(+1.11)#58 | 3.5%(+0.130)#5,104 |
| 59. | Millbrook | 3.6% | 2.5%(+1.09)#59 | 3.5%(+0.111)#5,141 |
| 60. | Livingston | 3.6% | 2.5%(+1.04)#60 | 3.5%(+0.061)#5,231 |
| 61. | Owens Cross Roads | 3.6% | 2.5%(+1.02)#61 | 3.5%(+0.044)#5,271 |
| 62. | Indian Springs Village | 3.6% | 2.5%(+1.01)#62 | 3.5%(+0.031)#5,298 |
| 63. | Moores Mill | 3.5% | 2.5%(+0.968)#63 | 3.5%(-0.012)#5,399 |
| 64. | West Blocton | 3.5% | 2.5%(+0.961)#64 | 3.5%(-0.019)#5,418 |
| 65. | Underwood Petersville | 3.5% | 2.5%(+0.934)#65 | 3.5%(-0.047)#5,475 |
| 66. | York | 3.5% | 2.5%(+0.922)#66 | 3.5%(-0.059)#5,496 |
| 67. | Gurley | 3.5% | 2.5%(+0.920)#67 | 3.5%(-0.061)#5,499 |
| 68. | Vestavia Hills | 3.5% | 2.5%(+0.914)#68 | 3.5%(-0.067)#5,512 |
| 69. | Arab | 3.4% | 2.5%(+0.818)#69 | 3.5%(-0.163)#5,720 |
| 70. | Pleasant Groves | 3.3% | 2.5%(+0.776)#70 | 3.5%(-0.205)#5,820 |
| 71. | Kimberly | 3.3% | 2.5%(+0.719)#71 | 3.5%(-0.262)#5,949 |
| 72. | Scottsboro | 3.3% | 2.5%(+0.711)#72 | 3.5%(-0.270)#5,973 |
| 73. | Gaylesville | 3.2% | 2.5%(+0.682)#73 | 3.5%(-0.299)#6,050 |
| 74. | Pinson | 3.2% | 2.5%(+0.664)#74 | 3.5%(-0.317)#6,098 |
| 75. | Brookside | 3.2% | 2.5%(+0.631)#75 | 3.5%(-0.350)#6,174 |
| 76. | Loachapoka | 3.1% | 2.5%(+0.606)#76 | 3.5%(-0.375)#6,239 |
| 77. | Trussville | 3.1% | 2.5%(+0.595)#77 | 3.5%(-0.386)#6,264 |
| 78. | Ardmore | 3.1% | 2.5%(+0.592)#78 | 3.5%(-0.389)#6,269 |
| 79. | Leeds | 3.1% | 2.5%(+0.547)#79 | 3.5%(-0.434)#6,377 |
| 80. | Blue Ridge | 3.1% | 2.5%(+0.533)#80 | 3.5%(-0.448)#6,418 |
| 81. | Lanett | 3.0% | 2.5%(+0.503)#81 | 3.5%(-0.478)#6,489 |
| 82. | Rainbow City | 3.0% | 2.5%(+0.425)#82 | 3.5%(-0.556)#6,675 |
| 83. | Montgomery | 3.0% | 2.5%(+0.409)#83 | 3.5%(-0.572)#6,714 |
| 84. | Sardis City | 2.9% | 2.5%(+0.383)#84 | 3.5%(-0.598)#6,777 |
| 85. | Killen | 2.9% | 2.5%(+0.369)#85 | 3.5%(-0.612)#6,799 |
| 86. | Ranburne | 2.9% | 2.5%(+0.349)#86 | 3.5%(-0.632)#6,855 |
| 87. | Mooresville | 2.9% | 2.5%(+0.313)#87 | 3.5%(-0.667)#6,955 |
| 88. | Sulligent | 2.8% | 2.5%(+0.306)#88 | 3.5%(-0.675)#6,973 |
| 89. | Carlisle Rockledge | 2.8% | 2.5%(+0.281)#89 | 3.5%(-0.700)#7,027 |
| 90. | Gardendale | 2.8% | 2.5%(+0.271)#90 | 3.5%(-0.710)#7,060 |
| 91. | Foley | 2.8% | 2.5%(+0.266)#91 | 3.5%(-0.715)#7,070 |
| 92. | Meadowbrook | 2.8% | 2.5%(+0.241)#92 | 3.5%(-0.739)#7,141 |
| 93. | Clayhatchee | 2.7% | 2.5%(+0.174)#93 | 3.5%(-0.807)#7,331 |
| 94. | Ladonia | 2.7% | 2.5%(+0.118)#94 | 3.5%(-0.863)#7,485 |
| 95. | Auburn | 2.7% | 2.5%(+0.113)#95 | 3.5%(-0.868)#7,495 |
| 96. | Cullman | 2.6% | 2.5%(+0.104)#96 | 3.5%(-0.877)#7,518 |
| 97. | Pine Level | 2.6% | 2.5%(+0.062)#97 | 3.5%(-0.919)#7,623 |
| 98. | Fairhope | 2.6% | 2.5%(+0.023)#98 | 3.5%(-0.958)#7,729 |
| 99. | Lookout Mountain | 2.5% | 2.5%(+0.006)#99 | 3.5%(-0.975)#7,801 |
| 100. | Homewood | 2.5% | 2.5%(+0.003)#100 | 3.5%(-0.978)#7,809 |
Common Questions
What are the Top 10 Cities with the Highest Percentage of Population Employed in Computer & Mathematics in Alabama?
Top 10 Cities with the Highest Percentage of Population Employed in Computer & Mathematics in Alabama are:
#1
16.5%
#2
15.9%
#3
13.5%
#4
11.7%
#5
11.4%
#6
10.7%
#7
10.6%
#8
8.5%
#9
8.4%
#10
8.0%
What city has the Highest Percentage of Population Employed in Computer & Mathematics in Alabama?
Mount Vernon has the Highest Percentage of Population Employed in Computer & Mathematics in Alabama with 16.5%.
What is the Percentage of Population Employed in Computer & Mathematics in the State of Alabama?
Percentage of Population Employed in Computer & Mathematics in Alabama is 2.5%.
What is the Percentage of Population Employed in Computer & Mathematics in the United States?
Percentage of Population Employed in Computer & Mathematics in the United States is 3.5%.