Cities with the Highest Percentage of Population Employed in Computer & Mathematics in Oklahoma
RELATED REPORTS & OPTIONS
Computer & Mathematics
Oklahoma
Compare Cities
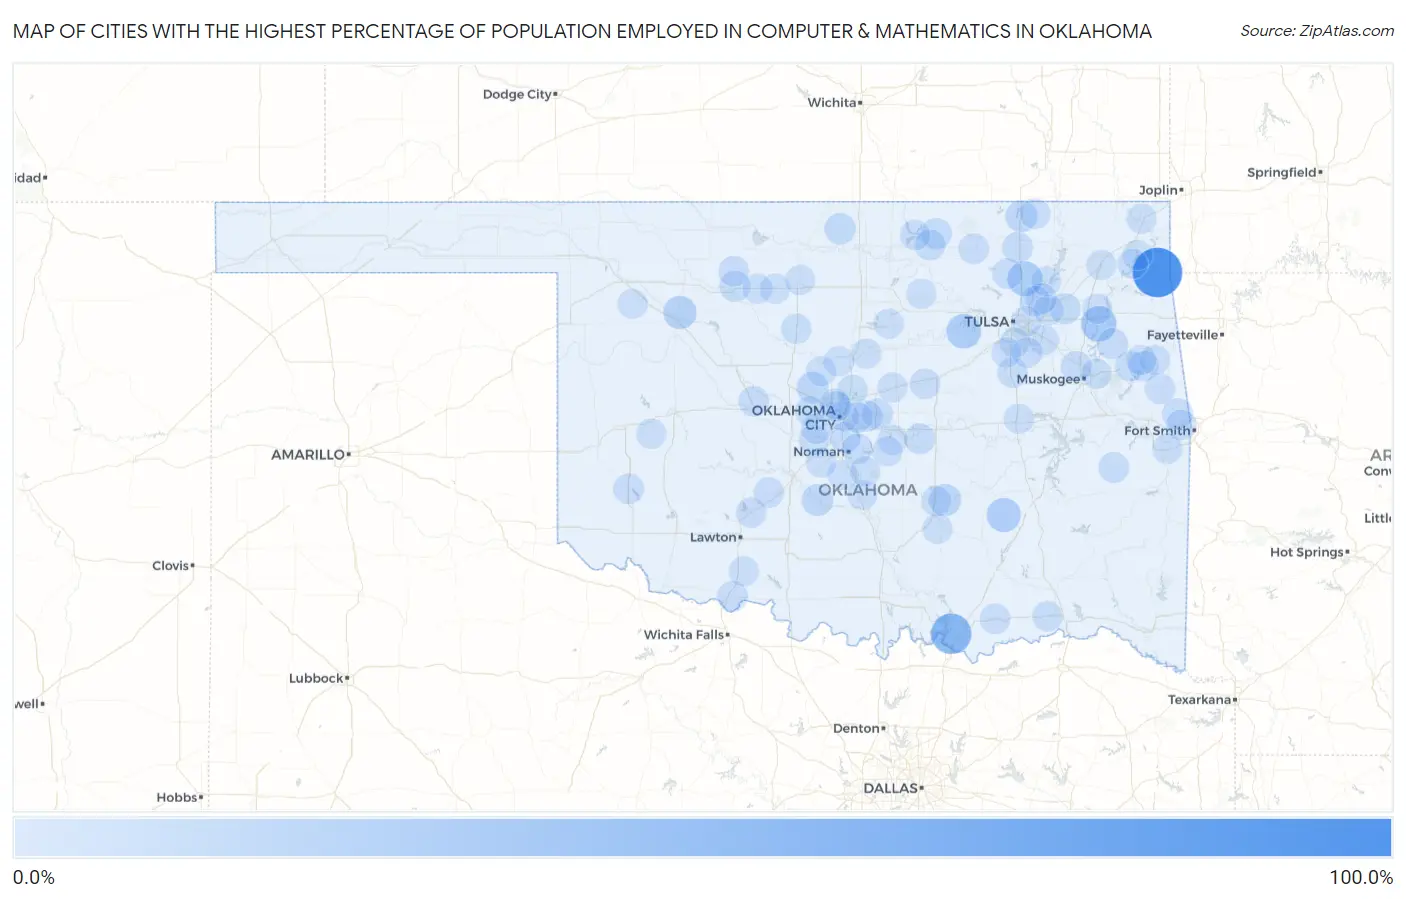
Map of Cities with the Highest Percentage of Population Employed in Computer & Mathematics in Oklahoma
0.0%
100.0%
Cities with the Highest Percentage of Population Employed in Computer & Mathematics in Oklahoma
| City | % Employed | vs State | vs National | |
| 1. | White Water | 100.0% | 2.3%(+97.7)#1 | 3.5%(+96.5)#4 |
| 2. | Platter | 52.9% | 2.3%(+50.6)#2 | 3.5%(+49.4)#18 |
| 3. | Lawtonka Acres | 28.9% | 2.3%(+26.6)#3 | 3.5%(+25.4)#74 |
| 4. | Murphy | 27.7% | 2.3%(+25.3)#4 | 3.5%(+24.1)#86 |
| 5. | Vera | 25.0% | 2.3%(+22.7)#5 | 3.5%(+21.5)#103 |
| 6. | Lawrence Creek | 23.1% | 2.3%(+20.8)#6 | 3.5%(+19.6)#120 |
| 7. | Ashland | 21.1% | 2.3%(+18.7)#7 | 3.5%(+17.5)#154 |
| 8. | Chester | 16.7% | 2.3%(+14.3)#8 | 3.5%(+13.1)#244 |
| 9. | Little Ponderosa | 12.8% | 2.3%(+10.5)#9 | 3.5%(+9.32)#441 |
| 10. | Francis | 11.8% | 2.3%(+9.48)#10 | 3.5%(+8.28)#512 |
| 11. | Piedmont | 9.8% | 2.3%(+7.48)#11 | 3.5%(+6.28)#769 |
| 12. | Bradley | 9.7% | 2.3%(+7.35)#12 | 3.5%(+6.15)#798 |
| 13. | Copan | 9.4% | 2.3%(+7.06)#13 | 3.5%(+5.86)#858 |
| 14. | Deer Creek | 8.1% | 2.3%(+5.78)#14 | 3.5%(+4.58)#1,177 |
| 15. | Shidler | 6.9% | 2.3%(+4.55)#15 | 3.5%(+3.35)#1,659 |
| 16. | Tiawah | 6.5% | 2.3%(+4.20)#16 | 3.5%(+3.00)#1,862 |
| 17. | Cleo Springs | 6.0% | 2.3%(+3.66)#17 | 3.5%(+2.46)#2,181 |
| 18. | Long | 5.8% | 2.3%(+3.44)#18 | 3.5%(+2.24)#2,336 |
| 19. | Lost City | 5.7% | 2.3%(+3.42)#19 | 3.5%(+2.22)#2,352 |
| 20. | Bartlesville | 5.5% | 2.3%(+3.17)#20 | 3.5%(+1.97)#2,578 |
| 21. | Moore | 5.4% | 2.3%(+3.03)#21 | 3.5%(+1.83)#2,719 |
| 22. | Lequire | 5.0% | 2.3%(+2.67)#22 | 3.5%(+1.48)#3,093 |
| 23. | Burbank | 5.0% | 2.3%(+2.67)#23 | 3.5%(+1.48)#3,094 |
| 24. | Harrah | 4.8% | 2.3%(+2.52)#24 | 3.5%(+1.32)#3,274 |
| 25. | Earlsboro | 4.7% | 2.3%(+2.36)#25 | 3.5%(+1.16)#3,459 |
| 26. | Limestone | 4.6% | 2.3%(+2.29)#26 | 3.5%(+1.09)#3,547 |
| 27. | Tullahassee | 4.5% | 2.3%(+2.22)#27 | 3.5%(+1.02)#3,629 |
| 28. | Randlett | 4.5% | 2.3%(+2.14)#28 | 3.5%(+0.945)#3,716 |
| 29. | Avant | 4.3% | 2.3%(+2.02)#29 | 3.5%(+0.823)#3,899 |
| 30. | Pawhuska | 4.3% | 2.3%(+1.94)#30 | 3.5%(+0.741)#4,030 |
| 31. | Lowrey | 4.3% | 2.3%(+1.93)#31 | 3.5%(+0.731)#4,040 |
| 32. | Wann | 4.3% | 2.3%(+1.93)#32 | 3.5%(+0.731)#4,041 |
| 33. | Edmond | 4.2% | 2.3%(+1.91)#33 | 3.5%(+0.711)#4,067 |
| 34. | Granite | 4.1% | 2.3%(+1.76)#34 | 3.5%(+0.557)#4,338 |
| 35. | Geary | 4.1% | 2.3%(+1.74)#35 | 3.5%(+0.538)#4,371 |
| 36. | Cement | 4.0% | 2.3%(+1.64)#36 | 3.5%(+0.440)#4,530 |
| 37. | Kaw City | 4.0% | 2.3%(+1.63)#37 | 3.5%(+0.436)#4,532 |
| 38. | Roland | 3.7% | 2.3%(+1.35)#38 | 3.5%(+0.147)#5,063 |
| 39. | Choctaw | 3.6% | 2.3%(+1.30)#39 | 3.5%(+0.105)#5,149 |
| 40. | Owasso | 3.6% | 2.3%(+1.28)#40 | 3.5%(+0.085)#5,185 |
| 41. | Norman | 3.6% | 2.3%(+1.27)#41 | 3.5%(+0.074)#5,204 |
| 42. | Broken Arrow | 3.5% | 2.3%(+1.19)#42 | 3.5%(-0.011)#5,396 |
| 43. | Greasy | 3.5% | 2.3%(+1.16)#43 | 3.5%(-0.036)#5,444 |
| 44. | Oklahoma City | 3.5% | 2.3%(+1.15)#44 | 3.5%(-0.045)#5,472 |
| 45. | Elgin | 3.5% | 2.3%(+1.14)#45 | 3.5%(-0.062)#5,501 |
| 46. | Midwest City | 3.4% | 2.3%(+1.09)#46 | 3.5%(-0.108)#5,605 |
| 47. | Park Hill | 3.4% | 2.3%(+1.09)#47 | 3.5%(-0.113)#5,615 |
| 48. | The Village | 3.4% | 2.3%(+1.08)#48 | 3.5%(-0.114)#5,616 |
| 49. | Aline | 3.4% | 2.3%(+1.06)#49 | 3.5%(-0.135)#5,662 |
| 50. | Caney | 3.4% | 2.3%(+1.05)#50 | 3.5%(-0.149)#5,691 |
| 51. | Bixby | 3.3% | 2.3%(+1.01)#51 | 3.5%(-0.190)#5,781 |
| 52. | Soper | 3.3% | 2.3%(+1.01)#52 | 3.5%(-0.191)#5,796 |
| 53. | Davenport | 3.3% | 2.3%(+0.935)#53 | 3.5%(-0.264)#5,956 |
| 54. | Hennessey | 3.2% | 2.3%(+0.906)#54 | 3.5%(-0.293)#6,033 |
| 55. | Nichols Hills | 3.2% | 2.3%(+0.893)#55 | 3.5%(-0.306)#6,070 |
| 56. | Bokchito | 3.2% | 2.3%(+0.866)#56 | 3.5%(-0.333)#6,136 |
| 57. | Tuttle | 3.1% | 2.3%(+0.784)#57 | 3.5%(-0.415)#6,330 |
| 58. | Fort Gibson | 3.0% | 2.3%(+0.701)#58 | 3.5%(-0.498)#6,537 |
| 59. | Spiro | 2.9% | 2.3%(+0.624)#59 | 3.5%(-0.575)#6,725 |
| 60. | Winchester | 2.9% | 2.3%(+0.615)#60 | 3.5%(-0.583)#6,742 |
| 61. | Mustang | 2.9% | 2.3%(+0.572)#61 | 3.5%(-0.627)#6,843 |
| 62. | Cedar Valley | 2.8% | 2.3%(+0.437)#62 | 3.5%(-0.762)#7,213 |
| 63. | Walters | 2.7% | 2.3%(+0.344)#63 | 3.5%(-0.855)#7,461 |
| 64. | Bethel Acres | 2.6% | 2.3%(+0.306)#64 | 3.5%(-0.893)#7,556 |
| 65. | Washington | 2.6% | 2.3%(+0.306)#65 | 3.5%(-0.893)#7,561 |
| 66. | Tulsa | 2.6% | 2.3%(+0.263)#66 | 3.5%(-0.936)#7,661 |
| 67. | Pawnee | 2.6% | 2.3%(+0.245)#67 | 3.5%(-0.954)#7,715 |
| 68. | Yukon | 2.6% | 2.3%(+0.229)#68 | 3.5%(-0.969)#7,778 |
| 69. | Ada | 2.5% | 2.3%(+0.222)#69 | 3.5%(-0.977)#7,804 |
| 70. | Cedar Lake | 2.5% | 2.3%(+0.222)#70 | 3.5%(-0.977)#7,806 |
| 71. | Lahoma | 2.5% | 2.3%(+0.214)#71 | 3.5%(-0.985)#7,827 |
| 72. | Titanic | 2.5% | 2.3%(+0.174)#72 | 3.5%(-1.02)#7,935 |
| 73. | Jenks | 2.5% | 2.3%(+0.158)#73 | 3.5%(-1.04)#7,983 |
| 74. | Big Cabin | 2.5% | 2.3%(+0.143)#74 | 3.5%(-1.06)#8,035 |
| 75. | Moodys | 2.5% | 2.3%(+0.130)#75 | 3.5%(-1.07)#8,085 |
| 76. | Sportsmen Acres | 2.5% | 2.3%(+0.125)#76 | 3.5%(-1.07)#8,100 |
| 77. | Cashion | 2.4% | 2.3%(+0.103)#77 | 3.5%(-1.10)#8,168 |
| 78. | Stillwater | 2.3% | 2.3%(+0.003)#78 | 3.5%(-1.20)#8,513 |
| 79. | Bernice | 2.3% | 2.3%(-0.018)#79 | 3.5%(-1.22)#8,601 |
| 80. | Verdigris | 2.3% | 2.3%(-0.025)#80 | 3.5%(-1.22)#8,622 |
| 81. | Sharon | 2.3% | 2.3%(-0.027)#81 | 3.5%(-1.23)#8,629 |
| 82. | White Eagle | 2.2% | 2.3%(-0.104)#82 | 3.5%(-1.30)#8,874 |
| 83. | Wayne | 2.2% | 2.3%(-0.110)#83 | 3.5%(-1.31)#8,899 |
| 84. | Oologah | 2.2% | 2.3%(-0.111)#84 | 3.5%(-1.31)#8,904 |
| 85. | Whitehorn Cove | 2.2% | 2.3%(-0.120)#85 | 3.5%(-1.32)#8,925 |
| 86. | Cleora | 2.2% | 2.3%(-0.133)#86 | 3.5%(-1.33)#8,964 |
| 87. | Pink | 2.2% | 2.3%(-0.136)#87 | 3.5%(-1.33)#8,976 |
| 88. | Wellston | 2.2% | 2.3%(-0.159)#88 | 3.5%(-1.36)#9,062 |
| 89. | Tonkawa Tribal Housing | 2.1% | 2.3%(-0.198)#89 | 3.5%(-1.40)#9,206 |
| 90. | Langston | 2.1% | 2.3%(-0.203)#90 | 3.5%(-1.40)#9,216 |
| 91. | Welling | 2.1% | 2.3%(-0.207)#91 | 3.5%(-1.41)#9,234 |
| 92. | Miami | 2.1% | 2.3%(-0.208)#92 | 3.5%(-1.41)#9,236 |
| 93. | Burns Flat | 2.1% | 2.3%(-0.209)#93 | 3.5%(-1.41)#9,237 |
| 94. | North Enid | 2.1% | 2.3%(-0.221)#94 | 3.5%(-1.42)#9,280 |
| 95. | Dewar | 2.1% | 2.3%(-0.251)#95 | 3.5%(-1.45)#9,395 |
| 96. | Blanchard | 2.1% | 2.3%(-0.255)#96 | 3.5%(-1.45)#9,409 |
| 97. | Kiefer | 2.1% | 2.3%(-0.259)#97 | 3.5%(-1.46)#9,427 |
| 98. | Byng | 2.1% | 2.3%(-0.270)#98 | 3.5%(-1.47)#9,455 |
| 99. | Slaughterville | 2.0% | 2.3%(-0.291)#99 | 3.5%(-1.49)#9,512 |
| 100. | Ringwood | 2.0% | 2.3%(-0.295)#100 | 3.5%(-1.49)#9,533 |
Common Questions
What are the Top 10 Cities with the Highest Percentage of Population Employed in Computer & Mathematics in Oklahoma?
Top 10 Cities with the Highest Percentage of Population Employed in Computer & Mathematics in Oklahoma are:
#1
100.0%
#2
52.9%
#3
27.7%
#4
25.0%
#5
23.1%
#6
21.1%
#7
16.7%
#8
11.8%
#9
9.8%
#10
9.7%
What city has the Highest Percentage of Population Employed in Computer & Mathematics in Oklahoma?
White Water has the Highest Percentage of Population Employed in Computer & Mathematics in Oklahoma with 100.0%.
What is the Percentage of Population Employed in Computer & Mathematics in the State of Oklahoma?
Percentage of Population Employed in Computer & Mathematics in Oklahoma is 2.3%.
What is the Percentage of Population Employed in Computer & Mathematics in the United States?
Percentage of Population Employed in Computer & Mathematics in the United States is 3.5%.