Cities with the Highest Percentage of Population Employed in Computer & Mathematics in New Mexico
RELATED REPORTS & OPTIONS
Computer & Mathematics
New Mexico
Compare Cities
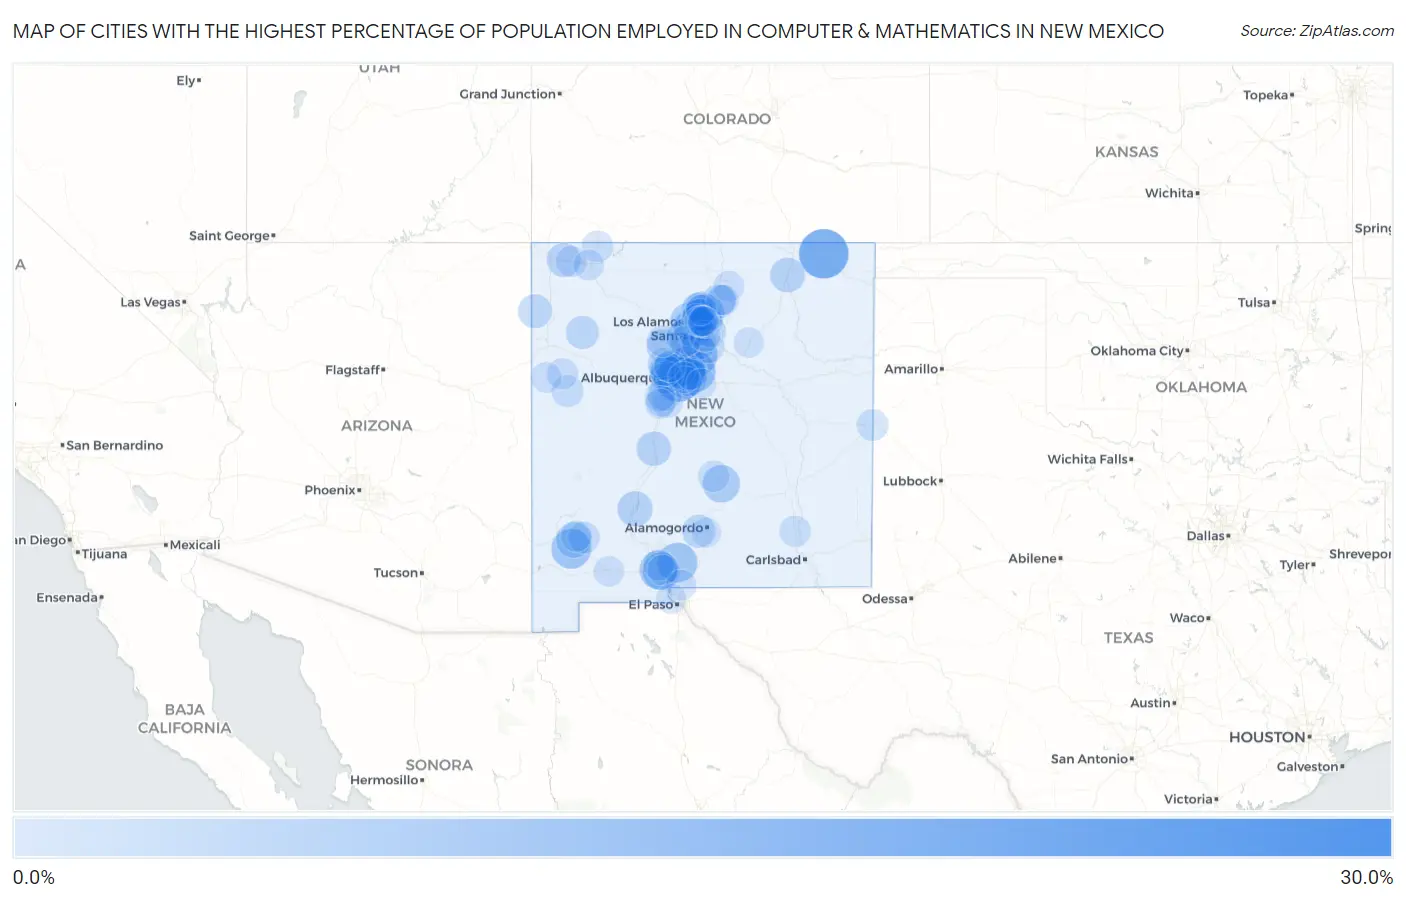
Map of Cities with the Highest Percentage of Population Employed in Computer & Mathematics in New Mexico
0.0%
30.0%
Cities with the Highest Percentage of Population Employed in Computer & Mathematics in New Mexico
| City | % Employed | vs State | vs National | |
| 1. | Fort Wingate | 29.9% | 2.4%(+27.4)#1 | 3.5%(+26.3)#70 |
| 2. | Folsom | 20.0% | 2.4%(+17.6)#2 | 3.5%(+16.5)#167 |
| 3. | Carnuel | 16.6% | 2.4%(+14.2)#3 | 3.5%(+13.1)#246 |
| 4. | Madrid | 13.2% | 2.4%(+10.7)#4 | 3.5%(+9.63)#421 |
| 5. | Cedar Grove | 11.8% | 2.4%(+9.34)#5 | 3.5%(+8.26)#515 |
| 6. | White Signal | 10.6% | 2.4%(+8.15)#6 | 3.5%(+7.06)#641 |
| 7. | White Rock | 10.6% | 2.4%(+8.13)#7 | 3.5%(+7.04)#644 |
| 8. | White Sands | 10.5% | 2.4%(+8.10)#8 | 3.5%(+7.02)#651 |
| 9. | La Madera | 10.5% | 2.4%(+8.02)#9 | 3.5%(+6.94)#660 |
| 10. | North Valley | 9.9% | 2.4%(+7.50)#10 | 3.5%(+6.41)#745 |
| 11. | Mesilla | 9.6% | 2.4%(+7.21)#11 | 3.5%(+6.12)#804 |
| 12. | La Puebla | 9.5% | 2.4%(+7.04)#12 | 3.5%(+5.96)#839 |
| 13. | San Pablo | 8.7% | 2.4%(+6.23)#13 | 3.5%(+5.15)#1,013 |
| 14. | Nogal | 8.5% | 2.4%(+6.01)#14 | 3.5%(+4.93)#1,075 |
| 15. | Sunlit Hills | 8.3% | 2.4%(+5.89)#15 | 3.5%(+4.81)#1,103 |
| 16. | Sedillo | 8.0% | 2.4%(+5.60)#16 | 3.5%(+4.52)#1,200 |
| 17. | Los Alamos | 8.0% | 2.4%(+5.53)#17 | 3.5%(+4.44)#1,235 |
| 18. | Paa-Ko | 7.9% | 2.4%(+5.49)#18 | 3.5%(+4.41)#1,248 |
| 19. | Cochiti Lake | 7.9% | 2.4%(+5.48)#19 | 3.5%(+4.40)#1,252 |
| 20. | La Mesilla | 7.5% | 2.4%(+5.06)#20 | 3.5%(+3.98)#1,403 |
| 21. | San Antonito Cdp Bernalillo County | 7.5% | 2.4%(+5.03)#21 | 3.5%(+3.94)#1,414 |
| 22. | Sandia Knolls | 7.3% | 2.4%(+4.89)#22 | 3.5%(+3.81)#1,465 |
| 23. | El Valle De Arroyo Seco | 7.2% | 2.4%(+4.73)#23 | 3.5%(+3.65)#1,522 |
| 24. | Conejo | 6.8% | 2.4%(+4.31)#24 | 3.5%(+3.23)#1,732 |
| 25. | Tyrone | 6.6% | 2.4%(+4.17)#25 | 3.5%(+3.09)#1,802 |
| 26. | Sandia Heights | 6.3% | 2.4%(+3.82)#26 | 3.5%(+2.74)#1,986 |
| 27. | Elephant Butte | 6.2% | 2.4%(+3.79)#27 | 3.5%(+2.71)#2,002 |
| 28. | Becenti | 6.1% | 2.4%(+3.62)#28 | 3.5%(+2.54)#2,132 |
| 29. | Penasco | 6.0% | 2.4%(+3.53)#29 | 3.5%(+2.45)#2,188 |
| 30. | Maxwell | 5.9% | 2.4%(+3.44)#30 | 3.5%(+2.36)#2,256 |
| 31. | Placitas Cdp Sandoval County | 5.8% | 2.4%(+3.33)#31 | 3.5%(+2.25)#2,332 |
| 32. | Socorro | 5.7% | 2.4%(+3.25)#32 | 3.5%(+2.17)#2,400 |
| 33. | Zia Pueblo | 5.3% | 2.4%(+2.85)#33 | 3.5%(+1.77)#2,783 |
| 34. | La Cienega | 5.2% | 2.4%(+2.73)#34 | 3.5%(+1.65)#2,888 |
| 35. | Waterflow | 5.2% | 2.4%(+2.73)#35 | 3.5%(+1.65)#2,889 |
| 36. | Tres Arroyos | 5.2% | 2.4%(+2.72)#36 | 3.5%(+1.64)#2,898 |
| 37. | Chamisal | 5.1% | 2.4%(+2.65)#37 | 3.5%(+1.57)#2,973 |
| 38. | Crystal | 5.0% | 2.4%(+2.56)#38 | 3.5%(+1.48)#3,090 |
| 39. | Bosque Farms | 4.7% | 2.4%(+2.27)#39 | 3.5%(+1.19)#3,426 |
| 40. | Los Ranchos De Albuquerque | 4.6% | 2.4%(+2.13)#40 | 3.5%(+1.04)#3,597 |
| 41. | Crownpoint | 4.3% | 2.4%(+1.88)#41 | 3.5%(+0.801)#3,934 |
| 42. | Holloman Afb | 4.3% | 2.4%(+1.85)#42 | 3.5%(+0.771)#3,992 |
| 43. | Nambe | 3.9% | 2.4%(+1.45)#43 | 3.5%(+0.365)#4,662 |
| 44. | Cedro | 3.9% | 2.4%(+1.42)#44 | 3.5%(+0.338)#4,703 |
| 45. | Hernandez | 3.8% | 2.4%(+1.39)#45 | 3.5%(+0.307)#4,767 |
| 46. | Chamita | 3.8% | 2.4%(+1.32)#46 | 3.5%(+0.233)#4,896 |
| 47. | Santa Clara Pueblo | 3.7% | 2.4%(+1.30)#47 | 3.5%(+0.217)#4,929 |
| 48. | Santa Fe Foothills | 3.7% | 2.4%(+1.26)#48 | 3.5%(+0.179)#4,994 |
| 49. | Albuquerque | 3.6% | 2.4%(+1.15)#49 | 3.5%(+0.069)#5,217 |
| 50. | South River | 3.5% | 2.4%(+1.07)#50 | 3.5%(-0.011)#5,395 |
| 51. | Paradise Hills | 3.5% | 2.4%(+1.04)#51 | 3.5%(-0.039)#5,451 |
| 52. | Edgewood | 3.5% | 2.4%(+1.02)#52 | 3.5%(-0.058)#5,495 |
| 53. | Tesuque | 3.4% | 2.4%(+0.932)#53 | 3.5%(-0.150)#5,696 |
| 54. | Alcalde | 3.3% | 2.4%(+0.891)#54 | 3.5%(-0.191)#5,797 |
| 55. | San Ildefonso Pueblo | 3.3% | 2.4%(+0.846)#55 | 3.5%(-0.237)#5,896 |
| 56. | Rio Rancho | 3.3% | 2.4%(+0.839)#56 | 3.5%(-0.244)#5,915 |
| 57. | Pinehill | 3.3% | 2.4%(+0.810)#57 | 3.5%(-0.273)#5,981 |
| 58. | Bayard | 3.2% | 2.4%(+0.795)#58 | 3.5%(-0.287)#6,013 |
| 59. | Corrales | 3.0% | 2.4%(+0.607)#59 | 3.5%(-0.476)#6,480 |
| 60. | Edith Enclave | 3.0% | 2.4%(+0.588)#60 | 3.5%(-0.494)#6,530 |
| 61. | Texico | 3.0% | 2.4%(+0.546)#61 | 3.5%(-0.536)#6,634 |
| 62. | Jemez Pueblo | 2.9% | 2.4%(+0.438)#62 | 3.5%(-0.644)#6,883 |
| 63. | Jaconita | 2.8% | 2.4%(+0.401)#63 | 3.5%(-0.681)#6,992 |
| 64. | Tano Road | 2.8% | 2.4%(+0.354)#64 | 3.5%(-0.729)#7,109 |
| 65. | Carrizozo | 2.8% | 2.4%(+0.336)#65 | 3.5%(-0.747)#7,162 |
| 66. | Tijeras | 2.7% | 2.4%(+0.273)#66 | 3.5%(-0.810)#7,343 |
| 67. | Eldorado At Santa Fe | 2.7% | 2.4%(+0.208)#67 | 3.5%(-0.875)#7,514 |
| 68. | Artesia | 2.6% | 2.4%(+0.199)#68 | 3.5%(-0.883)#7,539 |
| 69. | Cedar Hill | 2.6% | 2.4%(+0.189)#69 | 3.5%(-0.893)#7,560 |
| 70. | Cochiti | 2.6% | 2.4%(+0.144)#70 | 3.5%(-0.938)#7,672 |
| 71. | Ramah | 2.6% | 2.4%(+0.122)#71 | 3.5%(-0.960)#7,744 |
| 72. | Kirtland | 2.6% | 2.4%(+0.111)#72 | 3.5%(-0.971)#7,784 |
| 73. | Barton | 2.6% | 2.4%(+0.108)#73 | 3.5%(-0.975)#7,797 |
| 74. | Las Cruces | 2.5% | 2.4%(+0.017)#74 | 3.5%(-1.07)#8,069 |
| 75. | Silver City | 2.4% | 2.4%(-0.011)#75 | 3.5%(-1.09)#8,160 |
| 76. | Santa Fe | 2.4% | 2.4%(-0.035)#76 | 3.5%(-1.12)#8,238 |
| 77. | Cuyamungue | 2.4% | 2.4%(-0.061)#77 | 3.5%(-1.14)#8,325 |
| 78. | Taos | 2.2% | 2.4%(-0.235)#78 | 3.5%(-1.32)#8,922 |
| 79. | El Rancho | 2.2% | 2.4%(-0.259)#79 | 3.5%(-1.34)#9,006 |
| 80. | Black Rock | 2.2% | 2.4%(-0.259)#80 | 3.5%(-1.34)#9,007 |
| 81. | Las Maravillas | 2.2% | 2.4%(-0.264)#81 | 3.5%(-1.35)#9,029 |
| 82. | Pena Blanca | 2.1% | 2.4%(-0.297)#82 | 3.5%(-1.38)#9,147 |
| 83. | West Hammond | 2.1% | 2.4%(-0.310)#83 | 3.5%(-1.39)#9,186 |
| 84. | Ventura | 2.1% | 2.4%(-0.344)#84 | 3.5%(-1.43)#9,305 |
| 85. | Vadito | 2.0% | 2.4%(-0.415)#85 | 3.5%(-1.50)#9,544 |
| 86. | Los Chaves | 2.0% | 2.4%(-0.451)#86 | 3.5%(-1.53)#9,686 |
| 87. | Los Lunas | 2.0% | 2.4%(-0.488)#87 | 3.5%(-1.57)#9,824 |
| 88. | Ohkay Owingeh | 1.9% | 2.4%(-0.493)#88 | 3.5%(-1.58)#9,846 |
| 89. | Chaparral | 1.9% | 2.4%(-0.519)#89 | 3.5%(-1.60)#9,942 |
| 90. | Pojoaque | 1.9% | 2.4%(-0.548)#90 | 3.5%(-1.63)#10,051 |
| 91. | University Park | 1.9% | 2.4%(-0.552)#91 | 3.5%(-1.63)#10,072 |
| 92. | Rio Lucio | 1.9% | 2.4%(-0.555)#92 | 3.5%(-1.64)#10,087 |
| 93. | San Jose Cdp Rio Arriba County | 1.8% | 2.4%(-0.607)#93 | 3.5%(-1.69)#10,276 |
| 94. | Moriarty | 1.8% | 2.4%(-0.612)#94 | 3.5%(-1.69)#10,296 |
| 95. | Canada De Los Alamos | 1.8% | 2.4%(-0.656)#95 | 3.5%(-1.74)#10,490 |
| 96. | Jacona | 1.8% | 2.4%(-0.688)#96 | 3.5%(-1.77)#10,622 |
| 97. | Las Vegas | 1.7% | 2.4%(-0.722)#97 | 3.5%(-1.80)#10,762 |
| 98. | Belen | 1.7% | 2.4%(-0.786)#98 | 3.5%(-1.87)#11,022 |
| 99. | Sunland Park | 1.7% | 2.4%(-0.790)#99 | 3.5%(-1.87)#11,044 |
| 100. | Boles Acres | 1.6% | 2.4%(-0.810)#100 | 3.5%(-1.89)#11,125 |
Common Questions
What are the Top 10 Cities with the Highest Percentage of Population Employed in Computer & Mathematics in New Mexico?
Top 10 Cities with the Highest Percentage of Population Employed in Computer & Mathematics in New Mexico are:
#1
20.0%
#2
16.6%
#3
13.2%
#4
11.8%
#5
10.6%
#6
10.6%
#7
10.5%
#8
10.5%
#9
9.9%
#10
9.6%
What city has the Highest Percentage of Population Employed in Computer & Mathematics in New Mexico?
Folsom has the Highest Percentage of Population Employed in Computer & Mathematics in New Mexico with 20.0%.
What is the Percentage of Population Employed in Computer & Mathematics in the State of New Mexico?
Percentage of Population Employed in Computer & Mathematics in New Mexico is 2.4%.
What is the Percentage of Population Employed in Computer & Mathematics in the United States?
Percentage of Population Employed in Computer & Mathematics in the United States is 3.5%.