Cities with the Highest Percentage of Population Employed in Computer & Mathematics in Texas
RELATED REPORTS & OPTIONS
Computer & Mathematics
Texas
Compare Cities
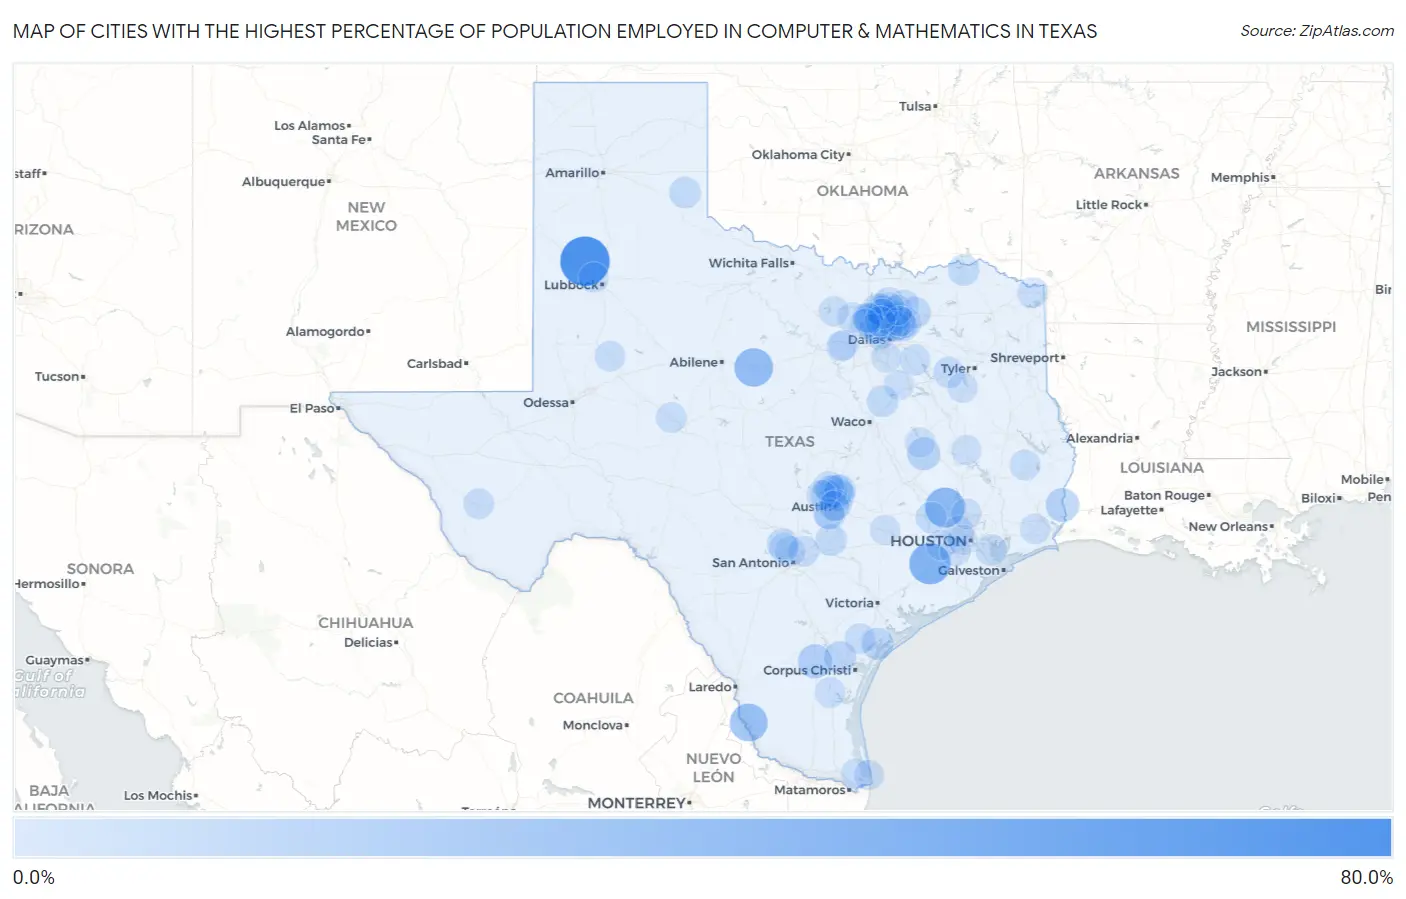
Map of Cities with the Highest Percentage of Population Employed in Computer & Mathematics in Texas
0.0%
80.0%
Cities with the Highest Percentage of Population Employed in Computer & Mathematics in Texas
| City | % Employed | vs State | vs National | |
| 1. | Spade | 77.4% | 3.4%(+74.0)#1 | 3.5%(+73.9)#8 |
| 2. | Magnolia Beach | 51.2% | 3.4%(+47.8)#2 | 3.5%(+47.7)#19 |
| 3. | Hungerford | 46.6% | 3.4%(+43.1)#3 | 3.5%(+43.0)#25 |
| 4. | Todd Mission | 40.7% | 3.4%(+37.3)#4 | 3.5%(+37.2)#34 |
| 5. | Putnam | 36.4% | 3.4%(+32.9)#5 | 3.5%(+32.8)#45 |
| 6. | Las Palmas | 33.3% | 3.4%(+29.9)#6 | 3.5%(+29.8)#61 |
| 7. | Praesel | 21.0% | 3.4%(+17.5)#7 | 3.5%(+17.4)#157 |
| 8. | Amargosa | 19.7% | 3.4%(+16.3)#8 | 3.5%(+16.2)#170 |
| 9. | Deweyville | 18.0% | 3.4%(+14.6)#9 | 3.5%(+14.5)#206 |
| 10. | Hilltop Lakes | 16.2% | 3.4%(+12.8)#10 | 3.5%(+12.7)#257 |
| 11. | Brushy Creek | 15.0% | 3.4%(+11.6)#11 | 3.5%(+11.5)#315 |
| 12. | Edroy | 13.6% | 3.4%(+10.1)#12 | 3.5%(+10.0)#389 |
| 13. | Mound | 13.2% | 3.4%(+9.74)#13 | 3.5%(+9.65)#419 |
| 14. | Holiday Beach | 12.8% | 3.4%(+9.35)#14 | 3.5%(+9.27)#444 |
| 15. | Wells Branch | 12.7% | 3.4%(+9.22)#15 | 3.5%(+9.13)#453 |
| 16. | Frisco | 12.4% | 3.4%(+9.01)#16 | 3.5%(+8.92)#461 |
| 17. | Hebron | 12.3% | 3.4%(+8.88)#17 | 3.5%(+8.79)#471 |
| 18. | Cedar Park | 12.3% | 3.4%(+8.84)#18 | 3.5%(+8.75)#476 |
| 19. | Murphy | 12.3% | 3.4%(+8.83)#19 | 3.5%(+8.74)#477 |
| 20. | Volente | 11.9% | 3.4%(+8.43)#20 | 3.5%(+8.34)#508 |
| 21. | Farmersville | 11.7% | 3.4%(+8.31)#21 | 3.5%(+8.22)#523 |
| 22. | Steiner Ranch | 11.4% | 3.4%(+7.99)#22 | 3.5%(+7.90)#547 |
| 23. | Plano | 11.4% | 3.4%(+7.93)#23 | 3.5%(+7.84)#554 |
| 24. | Coppell | 11.3% | 3.4%(+7.86)#24 | 3.5%(+7.77)#559 |
| 25. | Quail | 11.1% | 3.4%(+7.68)#25 | 3.5%(+7.59)#582 |
| 26. | Penelope | 10.9% | 3.4%(+7.46)#26 | 3.5%(+7.37)#607 |
| 27. | Irving | 10.8% | 3.4%(+7.41)#27 | 3.5%(+7.32)#612 |
| 28. | Powderly | 10.8% | 3.4%(+7.37)#28 | 3.5%(+7.28)#617 |
| 29. | Belterra | 10.4% | 3.4%(+7.00)#29 | 3.5%(+6.91)#665 |
| 30. | Shoreacres | 10.3% | 3.4%(+6.85)#30 | 3.5%(+6.76)#686 |
| 31. | Staples | 10.3% | 3.4%(+6.84)#31 | 3.5%(+6.75)#687 |
| 32. | Hempstead | 10.1% | 3.4%(+6.63)#32 | 3.5%(+6.54)#722 |
| 33. | Lakewood Village | 9.8% | 3.4%(+6.37)#33 | 3.5%(+6.28)#764 |
| 34. | Paloma Creek South | 9.7% | 3.4%(+6.27)#34 | 3.5%(+6.19)#789 |
| 35. | Round Rock | 9.6% | 3.4%(+6.16)#35 | 3.5%(+6.07)#815 |
| 36. | Melissa | 9.4% | 3.4%(+5.98)#36 | 3.5%(+5.89)#852 |
| 37. | Beaver Creek | 9.4% | 3.4%(+5.95)#37 | 3.5%(+5.87)#857 |
| 38. | Little Elm | 9.4% | 3.4%(+5.92)#38 | 3.5%(+5.83)#864 |
| 39. | Flower Mound | 9.3% | 3.4%(+5.85)#39 | 3.5%(+5.76)#877 |
| 40. | Murchison | 9.2% | 3.4%(+5.78)#40 | 3.5%(+5.70)#891 |
| 41. | Scenic Oaks | 9.1% | 3.4%(+5.70)#41 | 3.5%(+5.61)#913 |
| 42. | Woodsboro | 8.7% | 3.4%(+5.24)#42 | 3.5%(+5.16)#1,011 |
| 43. | Grays Prairie | 8.6% | 3.4%(+5.12)#43 | 3.5%(+5.03)#1,046 |
| 44. | Marfa | 8.5% | 3.4%(+5.10)#44 | 3.5%(+5.01)#1,049 |
| 45. | Seis Lagos | 8.5% | 3.4%(+5.09)#45 | 3.5%(+5.00)#1,051 |
| 46. | Allen | 8.4% | 3.4%(+5.00)#46 | 3.5%(+4.91)#1,079 |
| 47. | Colmesneil | 8.4% | 3.4%(+4.98)#47 | 3.5%(+4.89)#1,085 |
| 48. | Austin | 8.4% | 3.4%(+4.96)#48 | 3.5%(+4.87)#1,092 |
| 49. | Selma | 8.3% | 3.4%(+4.89)#49 | 3.5%(+4.81)#1,109 |
| 50. | The Colony | 8.3% | 3.4%(+4.86)#50 | 3.5%(+4.77)#1,119 |
| 51. | Cross Roads | 8.2% | 3.4%(+4.75)#51 | 3.5%(+4.66)#1,152 |
| 52. | Celina | 8.1% | 3.4%(+4.69)#52 | 3.5%(+4.60)#1,170 |
| 53. | Manchaca | 7.9% | 3.4%(+4.47)#53 | 3.5%(+4.38)#1,259 |
| 54. | Shady Hollow | 7.9% | 3.4%(+4.46)#54 | 3.5%(+4.37)#1,269 |
| 55. | Sachse | 7.8% | 3.4%(+4.39)#55 | 3.5%(+4.30)#1,287 |
| 56. | Carlsbad | 7.8% | 3.4%(+4.39)#56 | 3.5%(+4.30)#1,288 |
| 57. | Ackerly | 7.8% | 3.4%(+4.38)#57 | 3.5%(+4.29)#1,293 |
| 58. | Wylie | 7.7% | 3.4%(+4.31)#58 | 3.5%(+4.22)#1,316 |
| 59. | Bear Creek Ranch | 7.7% | 3.4%(+4.29)#59 | 3.5%(+4.20)#1,319 |
| 60. | Lantana | 7.7% | 3.4%(+4.28)#60 | 3.5%(+4.19)#1,328 |
| 61. | Leander | 7.7% | 3.4%(+4.23)#61 | 3.5%(+4.15)#1,347 |
| 62. | Jersey Village | 7.6% | 3.4%(+4.14)#62 | 3.5%(+4.05)#1,376 |
| 63. | Ricardo | 7.6% | 3.4%(+4.12)#63 | 3.5%(+4.03)#1,388 |
| 64. | Addison | 7.3% | 3.4%(+3.90)#64 | 3.5%(+3.82)#1,459 |
| 65. | Oak Ridge North | 7.3% | 3.4%(+3.90)#65 | 3.5%(+3.81)#1,463 |
| 66. | Richardson | 7.3% | 3.4%(+3.89)#66 | 3.5%(+3.80)#1,467 |
| 67. | Mckinney | 7.3% | 3.4%(+3.84)#67 | 3.5%(+3.75)#1,482 |
| 68. | Bayview | 7.2% | 3.4%(+3.80)#68 | 3.5%(+3.71)#1,499 |
| 69. | Fannett | 7.2% | 3.4%(+3.77)#69 | 3.5%(+3.68)#1,516 |
| 70. | Rollingwood | 7.1% | 3.4%(+3.69)#70 | 3.5%(+3.60)#1,549 |
| 71. | Bartonville | 7.1% | 3.4%(+3.64)#71 | 3.5%(+3.55)#1,562 |
| 72. | Fulshear | 7.0% | 3.4%(+3.52)#72 | 3.5%(+3.43)#1,620 |
| 73. | Frankston | 7.0% | 3.4%(+3.51)#73 | 3.5%(+3.43)#1,621 |
| 74. | Shavano Park | 6.9% | 3.4%(+3.49)#74 | 3.5%(+3.40)#1,637 |
| 75. | Shallowater | 6.9% | 3.4%(+3.47)#75 | 3.5%(+3.39)#1,649 |
| 76. | South Padre Island | 6.9% | 3.4%(+3.44)#76 | 3.5%(+3.35)#1,665 |
| 77. | New Fairview | 6.9% | 3.4%(+3.43)#77 | 3.5%(+3.34)#1,670 |
| 78. | Mcleod | 6.8% | 3.4%(+3.41)#78 | 3.5%(+3.32)#1,678 |
| 79. | Stockton Bend | 6.8% | 3.4%(+3.34)#79 | 3.5%(+3.25)#1,722 |
| 80. | Bridgeport | 6.8% | 3.4%(+3.32)#80 | 3.5%(+3.23)#1,731 |
| 81. | Hooks | 6.7% | 3.4%(+3.23)#81 | 3.5%(+3.14)#1,770 |
| 82. | Prosper | 6.6% | 3.4%(+3.20)#82 | 3.5%(+3.12)#1,793 |
| 83. | Aledo | 6.6% | 3.4%(+3.17)#83 | 3.5%(+3.08)#1,813 |
| 84. | Parker | 6.6% | 3.4%(+3.17)#84 | 3.5%(+3.08)#1,817 |
| 85. | Cross Mountain | 6.6% | 3.4%(+3.14)#85 | 3.5%(+3.05)#1,829 |
| 86. | Grapevine | 6.6% | 3.4%(+3.13)#86 | 3.5%(+3.04)#1,838 |
| 87. | Marquez | 6.5% | 3.4%(+3.09)#87 | 3.5%(+3.00)#1,863 |
| 88. | Hackberry | 6.4% | 3.4%(+3.00)#88 | 3.5%(+2.91)#1,902 |
| 89. | Argyle | 6.4% | 3.4%(+2.94)#89 | 3.5%(+2.85)#1,928 |
| 90. | Annetta South | 6.3% | 3.4%(+2.91)#90 | 3.5%(+2.82)#1,943 |
| 91. | Lewisville | 6.3% | 3.4%(+2.87)#91 | 3.5%(+2.78)#1,969 |
| 92. | Roanoke | 6.3% | 3.4%(+2.86)#92 | 3.5%(+2.77)#1,972 |
| 93. | Barry | 6.3% | 3.4%(+2.85)#93 | 3.5%(+2.76)#1,974 |
| 94. | Lago Vista | 6.2% | 3.4%(+2.73)#94 | 3.5%(+2.64)#2,057 |
| 95. | Oak Leaf | 6.1% | 3.4%(+2.71)#95 | 3.5%(+2.62)#2,077 |
| 96. | Lovelady | 6.1% | 3.4%(+2.66)#96 | 3.5%(+2.57)#2,103 |
| 97. | Santa Rita Ranch | 6.1% | 3.4%(+2.62)#97 | 3.5%(+2.53)#2,137 |
| 98. | Sugar Land | 6.0% | 3.4%(+2.61)#98 | 3.5%(+2.52)#2,139 |
| 99. | La Grange | 6.0% | 3.4%(+2.60)#99 | 3.5%(+2.51)#2,146 |
| 100. | Piney Point Village | 6.0% | 3.4%(+2.58)#100 | 3.5%(+2.49)#2,157 |
Common Questions
What are the Top 10 Cities with the Highest Percentage of Population Employed in Computer & Mathematics in Texas?
Top 10 Cities with the Highest Percentage of Population Employed in Computer & Mathematics in Texas are:
#1
77.4%
#2
46.6%
#3
40.7%
#4
36.4%
#5
33.3%
#6
19.7%
#7
18.0%
#8
16.2%
#9
15.0%
#10
13.6%
What city has the Highest Percentage of Population Employed in Computer & Mathematics in Texas?
Spade has the Highest Percentage of Population Employed in Computer & Mathematics in Texas with 77.4%.
What is the Percentage of Population Employed in Computer & Mathematics in the State of Texas?
Percentage of Population Employed in Computer & Mathematics in Texas is 3.4%.
What is the Percentage of Population Employed in Computer & Mathematics in the United States?
Percentage of Population Employed in Computer & Mathematics in the United States is 3.5%.