Cities with the Highest Percentage of Population Employed in Computer & Mathematics in Georgia
RELATED REPORTS & OPTIONS
Computer & Mathematics
Georgia
Compare Cities
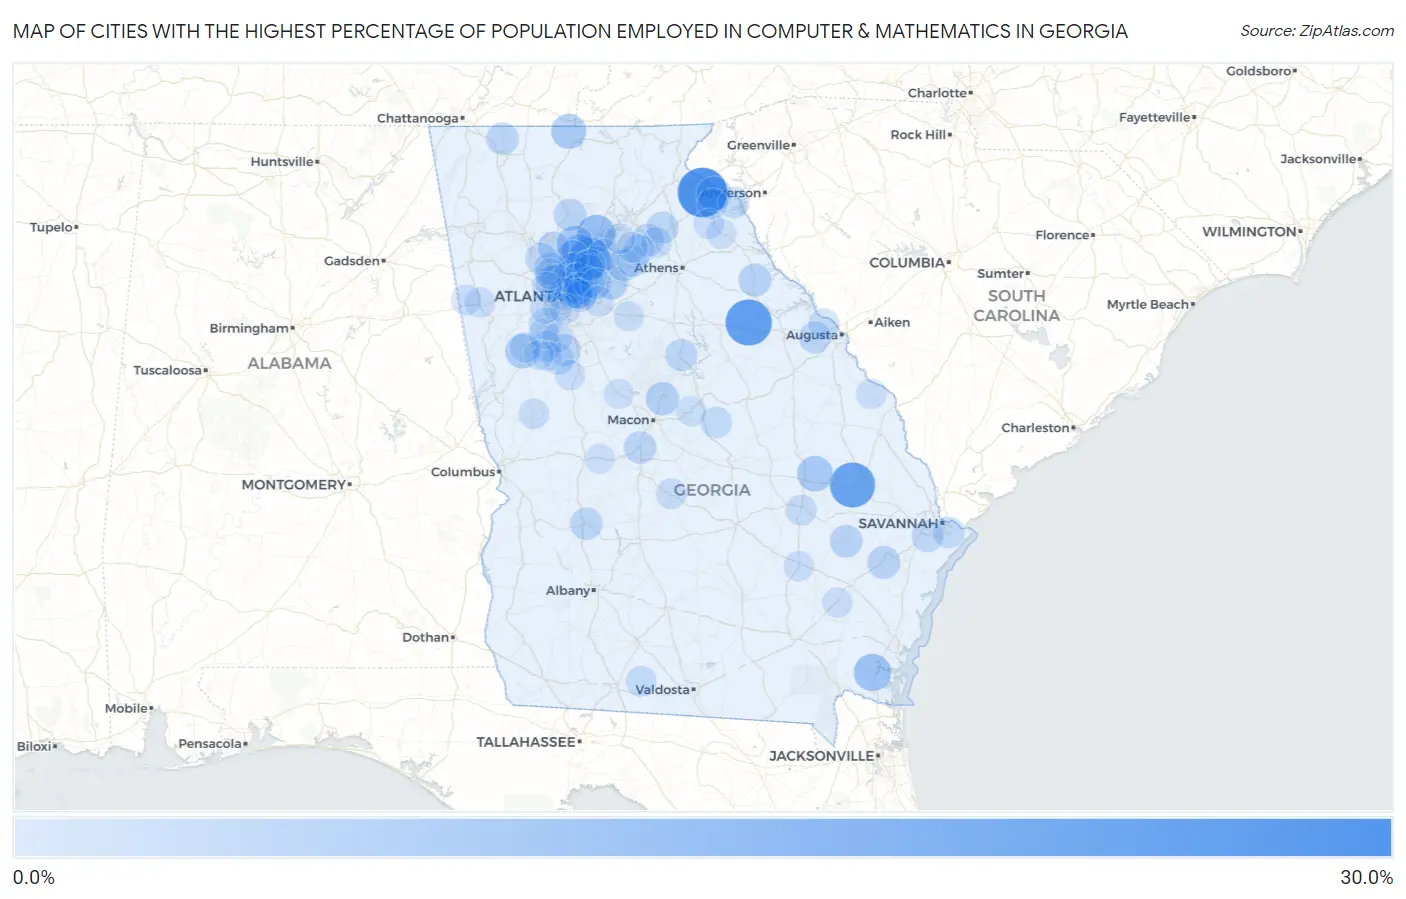
Map of Cities with the Highest Percentage of Population Employed in Computer & Mathematics in Georgia
0.0%
30.0%
Cities with the Highest Percentage of Population Employed in Computer & Mathematics in Georgia
| City | % Employed | vs State | vs National | |
| 1. | Avalon | 26.1% | 3.7%(+22.4)#1 | 3.5%(+22.6)#95 |
| 2. | Sharon | 22.2% | 3.7%(+18.6)#2 | 3.5%(+18.7)#132 |
| 3. | Register | 21.0% | 3.7%(+17.3)#3 | 3.5%(+17.4)#156 |
| 4. | Johns Creek | 14.5% | 3.7%(+10.8)#4 | 3.5%(+11.0)#343 |
| 5. | Hortense | 14.0% | 3.7%(+10.4)#5 | 3.5%(+10.5)#367 |
| 6. | Cumming | 12.7% | 3.7%(+9.06)#6 | 3.5%(+9.19)#446 |
| 7. | Woodbine | 11.8% | 3.7%(+8.19)#7 | 3.5%(+8.32)#509 |
| 8. | Alpharetta | 10.6% | 3.7%(+6.90)#8 | 3.5%(+7.04)#645 |
| 9. | Milton | 10.4% | 3.7%(+6.79)#9 | 3.5%(+6.92)#664 |
| 10. | Dunwoody | 10.2% | 3.7%(+6.54)#10 | 3.5%(+6.67)#697 |
| 11. | Stillmore | 10.0% | 3.7%(+6.34)#11 | 3.5%(+6.48)#730 |
| 12. | Epworth | 9.4% | 3.7%(+5.70)#12 | 3.5%(+5.83)#863 |
| 13. | Bolingbroke | 9.0% | 3.7%(+5.36)#13 | 3.5%(+5.49)#939 |
| 14. | Eulonia | 8.8% | 3.7%(+5.19)#14 | 3.5%(+5.32)#969 |
| 15. | Gumlog | 8.7% | 3.7%(+5.09)#15 | 3.5%(+5.22)#995 |
| 16. | East Newnan | 8.7% | 3.7%(+5.04)#16 | 3.5%(+5.17)#1,008 |
| 17. | Scottdale | 8.5% | 3.7%(+4.80)#17 | 3.5%(+4.93)#1,072 |
| 18. | Antioch | 8.0% | 3.7%(+4.30)#18 | 3.5%(+4.43)#1,241 |
| 19. | Snellville | 7.9% | 3.7%(+4.20)#19 | 3.5%(+4.33)#1,279 |
| 20. | North Druid Hills | 7.8% | 3.7%(+4.19)#20 | 3.5%(+4.32)#1,281 |
| 21. | Smyrna | 7.8% | 3.7%(+4.12)#21 | 3.5%(+4.25)#1,309 |
| 22. | Cataula | 7.8% | 3.7%(+4.11)#22 | 3.5%(+4.24)#1,311 |
| 23. | Sandy Springs | 7.7% | 3.7%(+4.02)#23 | 3.5%(+4.16)#1,344 |
| 24. | Vinings | 7.6% | 3.7%(+3.93)#24 | 3.5%(+4.06)#1,374 |
| 25. | Gray | 7.5% | 3.7%(+3.82)#25 | 3.5%(+3.96)#1,412 |
| 26. | Druid Hills | 7.1% | 3.7%(+3.49)#26 | 3.5%(+3.62)#1,530 |
| 27. | Tignall | 7.1% | 3.7%(+3.42)#27 | 3.5%(+3.55)#1,564 |
| 28. | Allenhurst | 7.1% | 3.7%(+3.40)#28 | 3.5%(+3.53)#1,576 |
| 29. | Brookhaven | 6.9% | 3.7%(+3.27)#29 | 3.5%(+3.40)#1,632 |
| 30. | Glennville | 6.7% | 3.7%(+3.04)#30 | 3.5%(+3.17)#1,764 |
| 31. | Varnell | 6.6% | 3.7%(+2.98)#31 | 3.5%(+3.11)#1,795 |
| 32. | Americus | 6.6% | 3.7%(+2.96)#32 | 3.5%(+3.09)#1,803 |
| 33. | Peachtree Corners | 6.6% | 3.7%(+2.92)#33 | 3.5%(+3.06)#1,825 |
| 34. | Pendergrass | 6.6% | 3.7%(+2.90)#34 | 3.5%(+3.04)#1,837 |
| 35. | Dacula | 6.6% | 3.7%(+2.90)#35 | 3.5%(+3.03)#1,841 |
| 36. | Ball Ground | 6.6% | 3.7%(+2.90)#36 | 3.5%(+3.03)#1,843 |
| 37. | Byron | 6.4% | 3.7%(+2.79)#37 | 3.5%(+2.92)#1,897 |
| 38. | Eatonton | 6.3% | 3.7%(+2.69)#38 | 3.5%(+2.82)#1,947 |
| 39. | Duluth | 6.2% | 3.7%(+2.55)#39 | 3.5%(+2.69)#2,020 |
| 40. | Roswell | 6.2% | 3.7%(+2.55)#40 | 3.5%(+2.68)#2,025 |
| 41. | Suwanee | 6.2% | 3.7%(+2.52)#41 | 3.5%(+2.65)#2,052 |
| 42. | Maysville | 6.1% | 3.7%(+2.42)#42 | 3.5%(+2.55)#2,116 |
| 43. | Marietta | 6.1% | 3.7%(+2.41)#43 | 3.5%(+2.55)#2,124 |
| 44. | Woolsey | 6.1% | 3.7%(+2.40)#44 | 3.5%(+2.54)#2,133 |
| 45. | Grovetown | 6.0% | 3.7%(+2.37)#45 | 3.5%(+2.51)#2,150 |
| 46. | Atlanta | 5.9% | 3.7%(+2.25)#46 | 3.5%(+2.39)#2,238 |
| 47. | Kennesaw | 5.9% | 3.7%(+2.25)#47 | 3.5%(+2.38)#2,239 |
| 48. | West Brow | 5.9% | 3.7%(+2.19)#48 | 3.5%(+2.33)#2,280 |
| 49. | Chamblee | 5.9% | 3.7%(+2.19)#49 | 3.5%(+2.33)#2,281 |
| 50. | North Decatur | 5.7% | 3.7%(+2.09)#50 | 3.5%(+2.22)#2,358 |
| 51. | Fairburn | 5.7% | 3.7%(+2.05)#51 | 3.5%(+2.18)#2,389 |
| 52. | Woodstock | 5.7% | 3.7%(+2.01)#52 | 3.5%(+2.14)#2,430 |
| 53. | Georgetown | 5.6% | 3.7%(+1.97)#53 | 3.5%(+2.10)#2,461 |
| 54. | Avondale Estates | 5.5% | 3.7%(+1.87)#54 | 3.5%(+2.01)#2,548 |
| 55. | Dutch Island | 5.5% | 3.7%(+1.87)#55 | 3.5%(+2.00)#2,554 |
| 56. | Toomsboro | 5.5% | 3.7%(+1.80)#56 | 3.5%(+1.94)#2,604 |
| 57. | Carl | 5.5% | 3.7%(+1.80)#57 | 3.5%(+1.93)#2,614 |
| 58. | Brooks | 5.4% | 3.7%(+1.71)#58 | 3.5%(+1.84)#2,706 |
| 59. | Reed Creek | 5.3% | 3.7%(+1.66)#59 | 3.5%(+1.79)#2,762 |
| 60. | Norcross | 5.2% | 3.7%(+1.51)#60 | 3.5%(+1.64)#2,894 |
| 61. | Belvedere Park | 5.1% | 3.7%(+1.45)#61 | 3.5%(+1.58)#2,964 |
| 62. | Tucker | 5.1% | 3.7%(+1.44)#62 | 3.5%(+1.57)#2,969 |
| 63. | Santa Claus | 5.1% | 3.7%(+1.43)#63 | 3.5%(+1.56)#2,988 |
| 64. | Hoschton | 5.1% | 3.7%(+1.42)#64 | 3.5%(+1.55)#2,995 |
| 65. | Berkeley Lake | 5.1% | 3.7%(+1.41)#65 | 3.5%(+1.54)#3,011 |
| 66. | Evans | 5.0% | 3.7%(+1.36)#66 | 3.5%(+1.49)#3,071 |
| 67. | Barwick | 5.0% | 3.7%(+1.34)#67 | 3.5%(+1.48)#3,088 |
| 68. | Mableton | 4.9% | 3.7%(+1.27)#68 | 3.5%(+1.40)#3,172 |
| 69. | Peachtree City | 4.9% | 3.7%(+1.20)#69 | 3.5%(+1.33)#3,256 |
| 70. | Jefferson | 4.8% | 3.7%(+1.18)#70 | 3.5%(+1.32)#3,273 |
| 71. | Braselton | 4.7% | 3.7%(+1.07)#71 | 3.5%(+1.20)#3,414 |
| 72. | Mountain Park | 4.7% | 3.7%(+1.03)#72 | 3.5%(+1.16)#3,457 |
| 73. | Hapeville | 4.7% | 3.7%(+1.01)#73 | 3.5%(+1.14)#3,486 |
| 74. | Fair Oaks | 4.7% | 3.7%(+1.00)#74 | 3.5%(+1.13)#3,498 |
| 75. | Warm Springs | 4.6% | 3.7%(+0.912)#75 | 3.5%(+1.04)#3,599 |
| 76. | Lavonia | 4.5% | 3.7%(+0.889)#76 | 3.5%(+1.02)#3,620 |
| 77. | Hawkinsville | 4.5% | 3.7%(+0.874)#77 | 3.5%(+1.01)#3,647 |
| 78. | Newnan | 4.5% | 3.7%(+0.840)#78 | 3.5%(+0.972)#3,681 |
| 79. | Bremen | 4.5% | 3.7%(+0.814)#79 | 3.5%(+0.946)#3,714 |
| 80. | Lithonia | 4.4% | 3.7%(+0.788)#80 | 3.5%(+0.920)#3,741 |
| 81. | Decatur | 4.4% | 3.7%(+0.766)#81 | 3.5%(+0.898)#3,781 |
| 82. | Tallapoosa | 4.4% | 3.7%(+0.747)#82 | 3.5%(+0.879)#3,813 |
| 83. | Girard | 4.3% | 3.7%(+0.691)#83 | 3.5%(+0.823)#3,900 |
| 84. | Baxley | 4.3% | 3.7%(+0.667)#84 | 3.5%(+0.799)#3,944 |
| 85. | Williamson | 4.3% | 3.7%(+0.633)#85 | 3.5%(+0.765)#3,995 |
| 86. | Franklin Springs | 4.2% | 3.7%(+0.581)#86 | 3.5%(+0.713)#4,061 |
| 87. | Tyrone | 4.2% | 3.7%(+0.532)#87 | 3.5%(+0.663)#4,145 |
| 88. | Screven | 4.2% | 3.7%(+0.525)#88 | 3.5%(+0.657)#4,159 |
| 89. | Covington | 4.2% | 3.7%(+0.523)#89 | 3.5%(+0.655)#4,167 |
| 90. | Ivey | 4.1% | 3.7%(+0.487)#90 | 3.5%(+0.619)#4,239 |
| 91. | Smarr | 4.1% | 3.7%(+0.486)#91 | 3.5%(+0.617)#4,244 |
| 92. | Flowery Branch | 4.1% | 3.7%(+0.484)#92 | 3.5%(+0.616)#4,248 |
| 93. | Fayetteville | 4.1% | 3.7%(+0.451)#93 | 3.5%(+0.583)#4,291 |
| 94. | East Point | 4.1% | 3.7%(+0.445)#94 | 3.5%(+0.577)#4,302 |
| 95. | Bowman | 4.1% | 3.7%(+0.445)#95 | 3.5%(+0.576)#4,306 |
| 96. | Forsyth | 4.0% | 3.7%(+0.388)#96 | 3.5%(+0.520)#4,389 |
| 97. | South Fulton | 4.0% | 3.7%(+0.382)#97 | 3.5%(+0.514)#4,394 |
| 98. | Reynolds | 3.9% | 3.7%(+0.291)#98 | 3.5%(+0.423)#4,553 |
| 99. | Senoia | 3.9% | 3.7%(+0.270)#99 | 3.5%(+0.401)#4,587 |
| 100. | Turin | 3.9% | 3.7%(+0.265)#100 | 3.5%(+0.397)#4,597 |
Common Questions
What are the Top 10 Cities with the Highest Percentage of Population Employed in Computer & Mathematics in Georgia?
Top 10 Cities with the Highest Percentage of Population Employed in Computer & Mathematics in Georgia are:
#1
26.1%
#2
22.2%
#3
21.0%
#4
14.5%
#5
12.7%
#6
11.8%
#7
10.6%
#8
10.4%
#9
10.2%
#10
10.0%
What city has the Highest Percentage of Population Employed in Computer & Mathematics in Georgia?
Avalon has the Highest Percentage of Population Employed in Computer & Mathematics in Georgia with 26.1%.
What is the Percentage of Population Employed in Computer & Mathematics in the State of Georgia?
Percentage of Population Employed in Computer & Mathematics in Georgia is 3.7%.
What is the Percentage of Population Employed in Computer & Mathematics in the United States?
Percentage of Population Employed in Computer & Mathematics in the United States is 3.5%.