Cities with the Highest Percentage of Population Employed in Computer & Mathematics in Massachusetts
RELATED REPORTS & OPTIONS
Computer & Mathematics
Massachusetts
Compare Cities
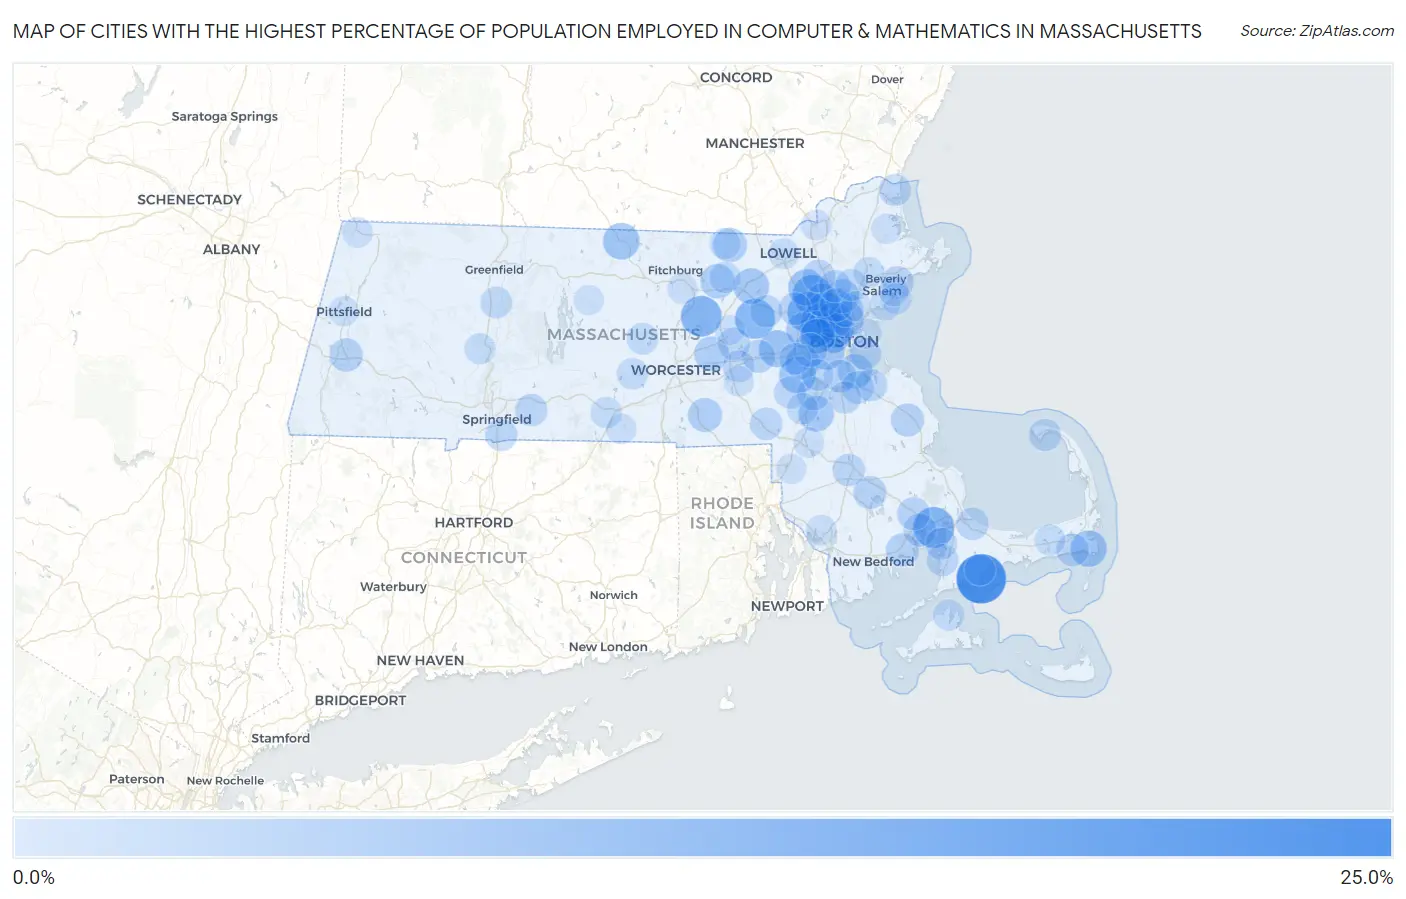
Map of Cities with the Highest Percentage of Population Employed in Computer & Mathematics in Massachusetts
0.0%
25.0%
Cities with the Highest Percentage of Population Employed in Computer & Mathematics in Massachusetts
| City | % Employed | vs State | vs National | |
| 1. | Popponesset | 20.6% | 4.8%(+15.8)#1 | 3.5%(+17.1)#161 |
| 2. | Onset | 12.8% | 4.8%(+7.96)#2 | 3.5%(+9.23)#445 |
| 3. | South Lancaster | 12.6% | 4.8%(+7.80)#3 | 3.5%(+9.07)#454 |
| 4. | Lexington | 12.1% | 4.8%(+7.35)#4 | 3.5%(+8.62)#486 |
| 5. | Maynard | 12.0% | 4.8%(+7.23)#5 | 3.5%(+8.50)#495 |
| 6. | Burlington | 12.0% | 4.8%(+7.15)#6 | 3.5%(+8.43)#500 |
| 7. | Arlington | 10.9% | 4.8%(+6.14)#7 | 3.5%(+7.42)#598 |
| 8. | Cambridge | 10.5% | 4.8%(+5.67)#8 | 3.5%(+6.95)#659 |
| 9. | Somerville | 10.1% | 4.8%(+5.33)#9 | 3.5%(+6.60)#713 |
| 10. | Cochituate | 9.4% | 4.8%(+4.62)#10 | 3.5%(+5.89)#851 |
| 11. | Brookline | 9.1% | 4.8%(+4.26)#11 | 3.5%(+5.54)#929 |
| 12. | Winchendon | 9.0% | 4.8%(+4.16)#12 | 3.5%(+5.43)#949 |
| 13. | Dover | 8.9% | 4.8%(+4.14)#13 | 3.5%(+5.41)#951 |
| 14. | West Chatham | 8.8% | 4.8%(+3.99)#14 | 3.5%(+5.26)#983 |
| 15. | Pinehurst | 8.7% | 4.8%(+3.93)#15 | 3.5%(+5.21)#1,001 |
| 16. | Winchester | 8.6% | 4.8%(+3.81)#16 | 3.5%(+5.08)#1,034 |
| 17. | Littleton Common | 8.2% | 4.8%(+3.44)#17 | 3.5%(+4.72)#1,133 |
| 18. | Belmont | 8.1% | 4.8%(+3.29)#18 | 3.5%(+4.57)#1,183 |
| 19. | Sharon | 8.1% | 4.8%(+3.26)#19 | 3.5%(+4.53)#1,197 |
| 20. | Medford | 8.0% | 4.8%(+3.24)#20 | 3.5%(+4.52)#1,202 |
| 21. | Malden | 7.9% | 4.8%(+3.10)#21 | 3.5%(+4.37)#1,268 |
| 22. | Waltham | 7.8% | 4.8%(+2.96)#22 | 3.5%(+4.24)#1,312 |
| 23. | Watertown Town | 7.5% | 4.8%(+2.72)#23 | 3.5%(+4.00)#1,397 |
| 24. | Quincy | 7.3% | 4.8%(+2.52)#24 | 3.5%(+3.80)#1,469 |
| 25. | Needham | 7.2% | 4.8%(+2.37)#25 | 3.5%(+3.65)#1,523 |
| 26. | Devens | 7.0% | 4.8%(+2.23)#26 | 3.5%(+3.50)#1,586 |
| 27. | Northborough | 7.0% | 4.8%(+2.18)#27 | 3.5%(+3.45)#1,608 |
| 28. | East Pepperell | 6.9% | 4.8%(+2.08)#28 | 3.5%(+3.35)#1,661 |
| 29. | Melrose | 6.9% | 4.8%(+2.06)#29 | 3.5%(+3.33)#1,674 |
| 30. | Newton | 6.8% | 4.8%(+2.03)#30 | 3.5%(+3.31)#1,694 |
| 31. | Wakefield | 6.7% | 4.8%(+1.93)#31 | 3.5%(+3.21)#1,742 |
| 32. | Whitinsville | 6.7% | 4.8%(+1.91)#32 | 3.5%(+3.19)#1,754 |
| 33. | Woburn | 6.3% | 4.8%(+1.52)#33 | 3.5%(+2.79)#1,960 |
| 34. | Lee | 6.2% | 4.8%(+1.38)#34 | 3.5%(+2.65)#2,050 |
| 35. | Stoneham | 6.2% | 4.8%(+1.38)#35 | 3.5%(+2.65)#2,051 |
| 36. | Mattapoisett Center | 6.0% | 4.8%(+1.20)#36 | 3.5%(+2.48)#2,166 |
| 37. | North Pembroke | 5.9% | 4.8%(+1.15)#37 | 3.5%(+2.42)#2,207 |
| 38. | Norwood | 5.9% | 4.8%(+1.15)#38 | 3.5%(+2.42)#2,208 |
| 39. | North Lakeville | 5.9% | 4.8%(+1.09)#39 | 3.5%(+2.36)#2,248 |
| 40. | Weweantic | 5.9% | 4.8%(+1.05)#40 | 3.5%(+2.33)#2,279 |
| 41. | West Wareham | 5.8% | 4.8%(+1.03)#41 | 3.5%(+2.30)#2,296 |
| 42. | Framingham | 5.8% | 4.8%(+0.976)#42 | 3.5%(+2.25)#2,334 |
| 43. | Wilmington | 5.8% | 4.8%(+0.970)#43 | 3.5%(+2.24)#2,340 |
| 44. | Harwich Port | 5.7% | 4.8%(+0.938)#44 | 3.5%(+2.21)#2,367 |
| 45. | Beverly | 5.7% | 4.8%(+0.899)#45 | 3.5%(+2.17)#2,396 |
| 46. | Hanscom Afb | 5.6% | 4.8%(+0.815)#46 | 3.5%(+2.09)#2,474 |
| 47. | Milton | 5.6% | 4.8%(+0.779)#47 | 3.5%(+2.05)#2,507 |
| 48. | Amherst | 5.6% | 4.8%(+0.773)#48 | 3.5%(+2.05)#2,510 |
| 49. | Franklin Town | 5.4% | 4.8%(+0.632)#49 | 3.5%(+1.91)#2,631 |
| 50. | Braintree Town | 5.4% | 4.8%(+0.625)#50 | 3.5%(+1.90)#2,640 |
| 51. | Sandwich | 5.4% | 4.8%(+0.620)#51 | 3.5%(+1.89)#2,650 |
| 52. | Reading | 5.4% | 4.8%(+0.564)#52 | 3.5%(+1.84)#2,715 |
| 53. | Weymouth Town | 5.4% | 4.8%(+0.556)#53 | 3.5%(+1.83)#2,723 |
| 54. | Marlborough | 5.4% | 4.8%(+0.552)#54 | 3.5%(+1.83)#2,726 |
| 55. | West Concord | 5.3% | 4.8%(+0.538)#55 | 3.5%(+1.81)#2,736 |
| 56. | Raynham Center | 5.3% | 4.8%(+0.514)#56 | 3.5%(+1.79)#2,763 |
| 57. | Wilbraham | 5.3% | 4.8%(+0.481)#57 | 3.5%(+1.75)#2,798 |
| 58. | Boston | 5.2% | 4.8%(+0.428)#58 | 3.5%(+1.70)#2,831 |
| 59. | Medfield | 5.2% | 4.8%(+0.366)#59 | 3.5%(+1.64)#2,899 |
| 60. | Provincetown | 5.1% | 4.8%(+0.341)#60 | 3.5%(+1.62)#2,933 |
| 61. | Randolph Town | 5.1% | 4.8%(+0.330)#61 | 3.5%(+1.60)#2,943 |
| 62. | Longmeadow | 5.1% | 4.8%(+0.325)#62 | 3.5%(+1.60)#2,949 |
| 63. | North Falmouth | 5.0% | 4.8%(+0.244)#63 | 3.5%(+1.52)#3,038 |
| 64. | Salisbury | 5.0% | 4.8%(+0.198)#64 | 3.5%(+1.47)#3,099 |
| 65. | Cordaville | 4.9% | 4.8%(+0.115)#65 | 3.5%(+1.39)#3,187 |
| 66. | North Attleborough | 4.9% | 4.8%(+0.111)#66 | 3.5%(+1.39)#3,192 |
| 67. | Pocasset | 4.9% | 4.8%(+0.095)#67 | 3.5%(+1.37)#3,208 |
| 68. | Lynnfield | 4.8% | 4.8%(+0.010)#68 | 3.5%(+1.28)#3,315 |
| 69. | South Deerfield | 4.7% | 4.8%(-0.049)#69 | 3.5%(+1.23)#3,384 |
| 70. | Dedham | 4.7% | 4.8%(-0.052)#70 | 3.5%(+1.22)#3,386 |
| 71. | Wellesley | 4.7% | 4.8%(-0.072)#71 | 3.5%(+1.20)#3,407 |
| 72. | Rutland | 4.7% | 4.8%(-0.139)#72 | 3.5%(+1.13)#3,497 |
| 73. | Spencer | 4.4% | 4.8%(-0.359)#73 | 3.5%(+0.915)#3,752 |
| 74. | Ayer | 4.4% | 4.8%(-0.388)#74 | 3.5%(+0.886)#3,799 |
| 75. | Walpole | 4.4% | 4.8%(-0.390)#75 | 3.5%(+0.884)#3,806 |
| 76. | Vineyard Haven | 4.4% | 4.8%(-0.447)#76 | 3.5%(+0.827)#3,890 |
| 77. | Fiskdale | 4.3% | 4.8%(-0.491)#77 | 3.5%(+0.783)#3,970 |
| 78. | Marblehead | 4.3% | 4.8%(-0.497)#78 | 3.5%(+0.777)#3,981 |
| 79. | Pepperell | 4.3% | 4.8%(-0.545)#79 | 3.5%(+0.729)#4,044 |
| 80. | Northampton | 4.2% | 4.8%(-0.597)#80 | 3.5%(+0.677)#4,125 |
| 81. | Danvers | 4.2% | 4.8%(-0.606)#81 | 3.5%(+0.668)#4,136 |
| 82. | South Dennis | 4.2% | 4.8%(-0.619)#82 | 3.5%(+0.655)#4,168 |
| 83. | Mashpee Neck | 4.1% | 4.8%(-0.732)#83 | 3.5%(+0.542)#4,363 |
| 84. | Swampscott | 4.0% | 4.8%(-0.769)#84 | 3.5%(+0.505)#4,408 |
| 85. | Lowell | 3.9% | 4.8%(-0.877)#85 | 3.5%(+0.397)#4,593 |
| 86. | Williamstown | 3.8% | 4.8%(-0.983)#86 | 3.5%(+0.291)#4,792 |
| 87. | Methuen Town | 3.8% | 4.8%(-0.984)#87 | 3.5%(+0.290)#4,795 |
| 88. | Winthrop Town | 3.8% | 4.8%(-1.01)#88 | 3.5%(+0.268)#4,847 |
| 89. | Southbridge Town | 3.7% | 4.8%(-1.09)#89 | 3.5%(+0.184)#4,982 |
| 90. | Mansfield Center | 3.7% | 4.8%(-1.11)#90 | 3.5%(+0.165)#5,031 |
| 91. | Leominster | 3.7% | 4.8%(-1.12)#91 | 3.5%(+0.157)#5,043 |
| 92. | Somerset | 3.7% | 4.8%(-1.15)#92 | 3.5%(+0.127)#5,109 |
| 93. | Hopkinton | 3.6% | 4.8%(-1.21)#93 | 3.5%(+0.069)#5,218 |
| 94. | Rowley | 3.5% | 4.8%(-1.26)#94 | 3.5%(+0.012)#5,343 |
| 95. | Attleboro | 3.5% | 4.8%(-1.26)#95 | 3.5%(+0.009)#5,349 |
| 96. | Hudson | 3.5% | 4.8%(-1.33)#96 | 3.5%(-0.057)#5,494 |
| 97. | Salem | 3.5% | 4.8%(-1.34)#97 | 3.5%(-0.067)#5,509 |
| 98. | Petersham | 3.4% | 4.8%(-1.35)#98 | 3.5%(-0.076)#5,534 |
| 99. | Pittsfield | 3.4% | 4.8%(-1.37)#99 | 3.5%(-0.093)#5,567 |
| 100. | Saugus | 3.4% | 4.8%(-1.40)#100 | 3.5%(-0.122)#5,633 |
Common Questions
What are the Top 10 Cities with the Highest Percentage of Population Employed in Computer & Mathematics in Massachusetts?
Top 10 Cities with the Highest Percentage of Population Employed in Computer & Mathematics in Massachusetts are:
#1
20.6%
#2
12.8%
#3
12.6%
#4
12.1%
#5
12.0%
#6
12.0%
#7
10.9%
#8
10.5%
#9
10.1%
#10
9.4%
What city has the Highest Percentage of Population Employed in Computer & Mathematics in Massachusetts?
Popponesset has the Highest Percentage of Population Employed in Computer & Mathematics in Massachusetts with 20.6%.
What is the Percentage of Population Employed in Computer & Mathematics in the State of Massachusetts?
Percentage of Population Employed in Computer & Mathematics in Massachusetts is 4.8%.
What is the Percentage of Population Employed in Computer & Mathematics in the United States?
Percentage of Population Employed in Computer & Mathematics in the United States is 3.5%.