Cities with the Highest Percentage of Population Employed in Computer & Mathematics in Maine
RELATED REPORTS & OPTIONS
Computer & Mathematics
Maine
Compare Cities
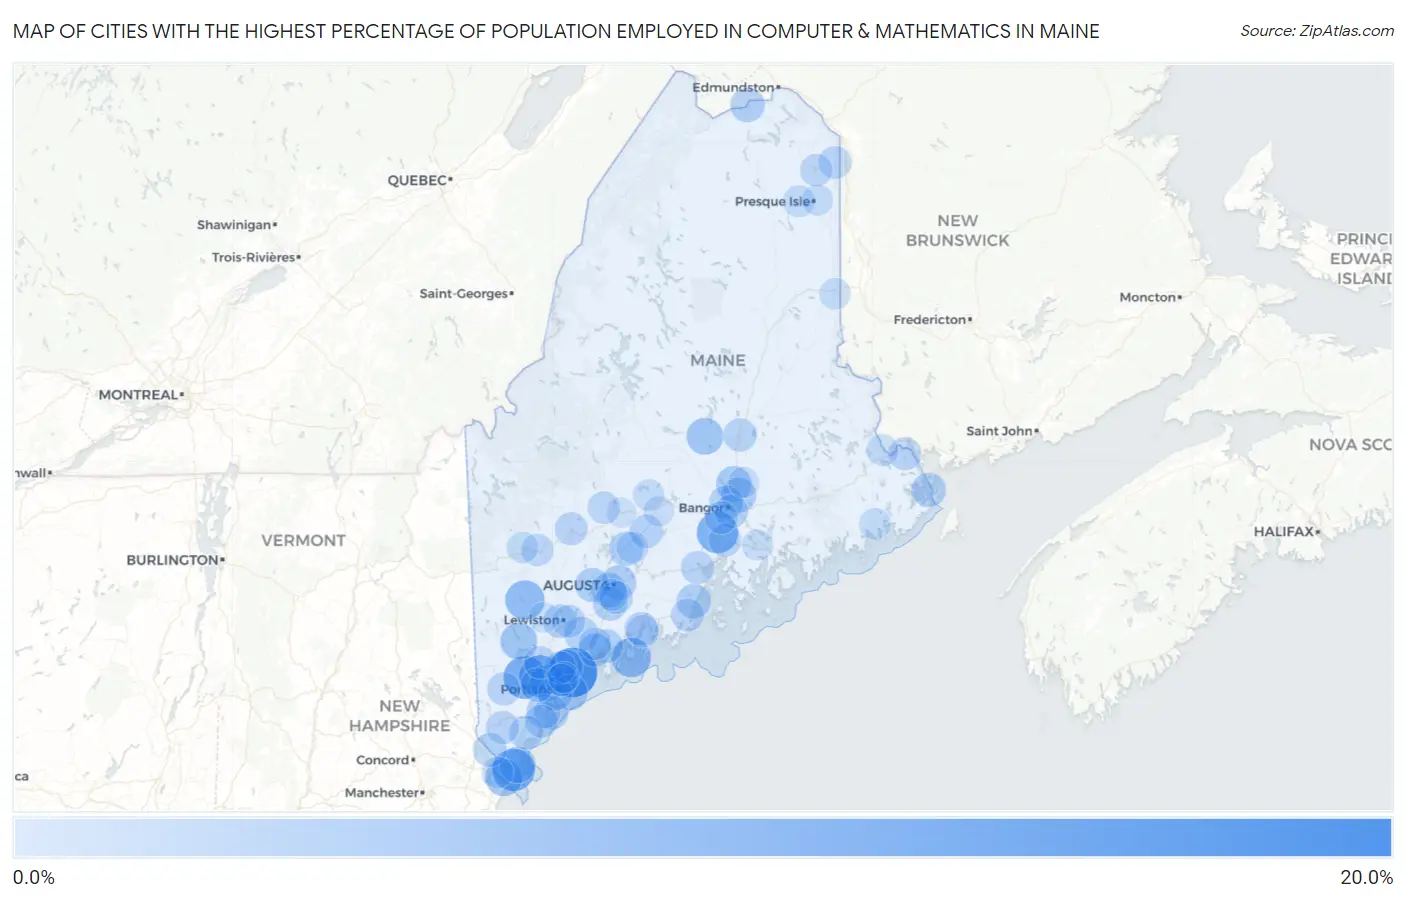
Map of Cities with the Highest Percentage of Population Employed in Computer & Mathematics in Maine
0.0%
20.0%
Cities with the Highest Percentage of Population Employed in Computer & Mathematics in Maine
| City | % Employed | vs State | vs National | |
| 1. | Cousins Island | 15.7% | 2.4%(+13.3)#1 | 3.5%(+12.2)#282 |
| 2. | Standish | 10.2% | 2.4%(+7.79)#2 | 3.5%(+6.72)#691 |
| 3. | York Harbor | 9.8% | 2.4%(+7.40)#3 | 3.5%(+6.32)#757 |
| 4. | South Windham | 9.6% | 2.4%(+7.18)#4 | 3.5%(+6.10)#808 |
| 5. | Winterport | 9.0% | 2.4%(+6.55)#5 | 3.5%(+5.48)#941 |
| 6. | Boothbay Harbor | 7.4% | 2.4%(+4.97)#6 | 3.5%(+3.90)#1,429 |
| 7. | Norway | 7.3% | 2.4%(+4.81)#7 | 3.5%(+3.73)#1,491 |
| 8. | Island Falls | 6.6% | 2.4%(+4.16)#8 | 3.5%(+3.09)#1,805 |
| 9. | Kittery | 5.6% | 2.4%(+3.13)#9 | 3.5%(+2.06)#2,506 |
| 10. | Milo | 5.3% | 2.4%(+2.81)#10 | 3.5%(+1.74)#2,802 |
| 11. | Naples | 5.2% | 2.4%(+2.78)#11 | 3.5%(+1.70)#2,835 |
| 12. | Cape Neddick | 5.0% | 2.4%(+2.51)#12 | 3.5%(+1.43)#3,140 |
| 13. | Westbrook | 4.7% | 2.4%(+2.21)#13 | 3.5%(+1.13)#3,502 |
| 14. | Portland | 4.4% | 2.4%(+1.99)#14 | 3.5%(+0.918)#3,746 |
| 15. | Old Town | 4.2% | 2.4%(+1.78)#15 | 3.5%(+0.700)#4,095 |
| 16. | Orono | 4.0% | 2.4%(+1.52)#16 | 3.5%(+0.442)#4,523 |
| 17. | Oak Hill | 3.8% | 2.4%(+1.31)#17 | 3.5%(+0.229)#4,902 |
| 18. | Hallowell | 3.7% | 2.4%(+1.21)#18 | 3.5%(+0.138)#5,083 |
| 19. | Augusta | 3.7% | 2.4%(+1.21)#19 | 3.5%(+0.131)#5,100 |
| 20. | Camden | 3.4% | 2.4%(+0.993)#20 | 3.5%(-0.083)#5,551 |
| 21. | Fort Kent | 3.4% | 2.4%(+0.981)#21 | 3.5%(-0.095)#5,576 |
| 22. | Winthrop | 3.3% | 2.4%(+0.854)#22 | 3.5%(-0.222)#5,860 |
| 23. | Waterville | 3.3% | 2.4%(+0.846)#23 | 3.5%(-0.231)#5,878 |
| 24. | Eastport | 3.3% | 2.4%(+0.834)#24 | 3.5%(-0.242)#5,909 |
| 25. | Lisbon | 3.3% | 2.4%(+0.814)#25 | 3.5%(-0.263)#5,951 |
| 26. | Lisbon Falls | 3.2% | 2.4%(+0.773)#26 | 3.5%(-0.304)#6,063 |
| 27. | Old Orchard Beach | 3.2% | 2.4%(+0.737)#27 | 3.5%(-0.339)#6,149 |
| 28. | Saco | 3.2% | 2.4%(+0.733)#28 | 3.5%(-0.343)#6,155 |
| 29. | South Portland | 3.2% | 2.4%(+0.710)#29 | 3.5%(-0.366)#6,211 |
| 30. | Gardiner | 3.1% | 2.4%(+0.692)#30 | 3.5%(-0.384)#6,262 |
| 31. | Bangor | 3.1% | 2.4%(+0.617)#31 | 3.5%(-0.459)#6,443 |
| 32. | Kennebunk | 3.0% | 2.4%(+0.591)#32 | 3.5%(-0.485)#6,499 |
| 33. | Berwick | 3.0% | 2.4%(+0.575)#33 | 3.5%(-0.501)#6,545 |
| 34. | Bath | 3.0% | 2.4%(+0.549)#34 | 3.5%(-0.527)#6,607 |
| 35. | Gorham | 2.9% | 2.4%(+0.423)#35 | 3.5%(-0.653)#6,910 |
| 36. | South Berwick | 2.9% | 2.4%(+0.407)#36 | 3.5%(-0.669)#6,961 |
| 37. | Auburn | 2.8% | 2.4%(+0.376)#37 | 3.5%(-0.701)#7,031 |
| 38. | Brownville Junction | 2.8% | 2.4%(+0.355)#38 | 3.5%(-0.721)#7,089 |
| 39. | Brewer | 2.8% | 2.4%(+0.339)#39 | 3.5%(-0.737)#7,135 |
| 40. | Brunswick | 2.8% | 2.4%(+0.309)#40 | 3.5%(-0.767)#7,223 |
| 41. | Clinton | 2.8% | 2.4%(+0.307)#41 | 3.5%(-0.770)#7,228 |
| 42. | Kingfield | 2.7% | 2.4%(+0.282)#42 | 3.5%(-0.794)#7,300 |
| 43. | Newcastle | 2.6% | 2.4%(+0.129)#43 | 3.5%(-0.947)#7,702 |
| 44. | Howland | 2.5% | 2.4%(+0.064)#44 | 3.5%(-1.01)#7,895 |
| 45. | Randolph | 2.5% | 2.4%(+0.027)#45 | 3.5%(-1.05)#8,010 |
| 46. | Yarmouth | 2.4% | 2.4%(-0.011)#46 | 3.5%(-1.09)#8,145 |
| 47. | Belfast | 2.4% | 2.4%(-0.043)#47 | 3.5%(-1.12)#8,241 |
| 48. | Lake Arrowhead | 2.4% | 2.4%(-0.063)#48 | 3.5%(-1.14)#8,313 |
| 49. | Sanford | 2.4% | 2.4%(-0.093)#49 | 3.5%(-1.17)#8,402 |
| 50. | Calais | 2.3% | 2.4%(-0.130)#50 | 3.5%(-1.21)#8,558 |
| 51. | Biddeford | 2.3% | 2.4%(-0.136)#51 | 3.5%(-1.21)#8,580 |
| 52. | Danforth | 2.3% | 2.4%(-0.136)#52 | 3.5%(-1.21)#8,583 |
| 53. | Bucksport | 2.3% | 2.4%(-0.176)#53 | 3.5%(-1.25)#8,701 |
| 54. | Farmington | 2.3% | 2.4%(-0.180)#54 | 3.5%(-1.26)#8,730 |
| 55. | Limestone | 2.2% | 2.4%(-0.210)#55 | 3.5%(-1.29)#8,816 |
| 56. | Rockland | 2.2% | 2.4%(-0.231)#56 | 3.5%(-1.31)#8,894 |
| 57. | Lewiston | 2.2% | 2.4%(-0.263)#57 | 3.5%(-1.34)#8,995 |
| 58. | Hampden | 2.2% | 2.4%(-0.282)#58 | 3.5%(-1.36)#9,066 |
| 59. | Damariscotta | 1.8% | 2.4%(-0.609)#59 | 3.5%(-1.69)#10,257 |
| 60. | North Windham | 1.8% | 2.4%(-0.630)#60 | 3.5%(-1.71)#10,332 |
| 61. | Cumberland Center | 1.8% | 2.4%(-0.642)#61 | 3.5%(-1.72)#10,398 |
| 62. | Caribou | 1.8% | 2.4%(-0.643)#62 | 3.5%(-1.72)#10,401 |
| 63. | Topsham | 1.8% | 2.4%(-0.652)#63 | 3.5%(-1.73)#10,440 |
| 64. | Dixfield | 1.8% | 2.4%(-0.652)#64 | 3.5%(-1.73)#10,442 |
| 65. | Falmouth | 1.8% | 2.4%(-0.694)#65 | 3.5%(-1.77)#10,614 |
| 66. | Madison | 1.7% | 2.4%(-0.752)#66 | 3.5%(-1.83)#10,857 |
| 67. | Winslow | 1.6% | 2.4%(-0.895)#67 | 3.5%(-1.97)#11,465 |
| 68. | South Eliot | 1.3% | 2.4%(-1.10)#68 | 3.5%(-2.18)#12,335 |
| 69. | Mapleton | 1.3% | 2.4%(-1.11)#69 | 3.5%(-2.19)#12,364 |
| 70. | Cornish | 1.3% | 2.4%(-1.16)#70 | 3.5%(-2.24)#12,606 |
| 71. | Greene | 1.3% | 2.4%(-1.17)#71 | 3.5%(-2.25)#12,641 |
| 72. | Farmingdale | 1.3% | 2.4%(-1.18)#72 | 3.5%(-2.26)#12,710 |
| 73. | Woodland | 1.2% | 2.4%(-1.20)#73 | 3.5%(-2.28)#12,800 |
| 74. | Machias | 1.2% | 2.4%(-1.29)#74 | 3.5%(-2.37)#13,204 |
| 75. | Hartland | 1.1% | 2.4%(-1.32)#75 | 3.5%(-2.39)#13,318 |
| 76. | Rumford | 1.1% | 2.4%(-1.39)#76 | 3.5%(-2.46)#13,643 |
| 77. | Houlton | 1.0% | 2.4%(-1.41)#77 | 3.5%(-2.48)#13,723 |
| 78. | Presque Isle | 0.95% | 2.4%(-1.50)#78 | 3.5%(-2.58)#14,140 |
| 79. | Veazie | 0.93% | 2.4%(-1.52)#79 | 3.5%(-2.60)#14,225 |
| 80. | Ellsworth | 0.79% | 2.4%(-1.66)#80 | 3.5%(-2.73)#14,877 |
| 81. | Milford | 0.78% | 2.4%(-1.67)#81 | 3.5%(-2.75)#14,944 |
| 82. | Dunstan | 0.76% | 2.4%(-1.69)#82 | 3.5%(-2.76)#15,021 |
| 83. | Jonesport | 0.68% | 2.4%(-1.77)#83 | 3.5%(-2.85)#15,439 |
| 84. | Falmouth Foreside | 0.66% | 2.4%(-1.78)#84 | 3.5%(-2.86)#15,500 |
| 85. | Pittsfield | 0.47% | 2.4%(-1.97)#85 | 3.5%(-3.05)#16,341 |
| 86. | Mechanic Falls | 0.40% | 2.4%(-2.05)#86 | 3.5%(-3.13)#16,618 |
| 87. | Skowhegan | 0.27% | 2.4%(-2.18)#87 | 3.5%(-3.25)#16,996 |
1
2Common Questions
What are the Top 10 Cities with the Highest Percentage of Population Employed in Computer & Mathematics in Maine?
Top 10 Cities with the Highest Percentage of Population Employed in Computer & Mathematics in Maine are:
#1
15.7%
#2
10.2%
#3
9.8%
#4
9.6%
#5
9.0%
#6
7.4%
#7
7.3%
#8
5.6%
#9
5.3%
#10
5.2%
What city has the Highest Percentage of Population Employed in Computer & Mathematics in Maine?
Cousins Island has the Highest Percentage of Population Employed in Computer & Mathematics in Maine with 15.7%.
What is the Percentage of Population Employed in Computer & Mathematics in the State of Maine?
Percentage of Population Employed in Computer & Mathematics in Maine is 2.4%.
What is the Percentage of Population Employed in Computer & Mathematics in the United States?
Percentage of Population Employed in Computer & Mathematics in the United States is 3.5%.