Cities with the Highest Percentage of Population Employed in Computer & Mathematics in Washington
RELATED REPORTS & OPTIONS
Computer & Mathematics
Washington
Compare Cities
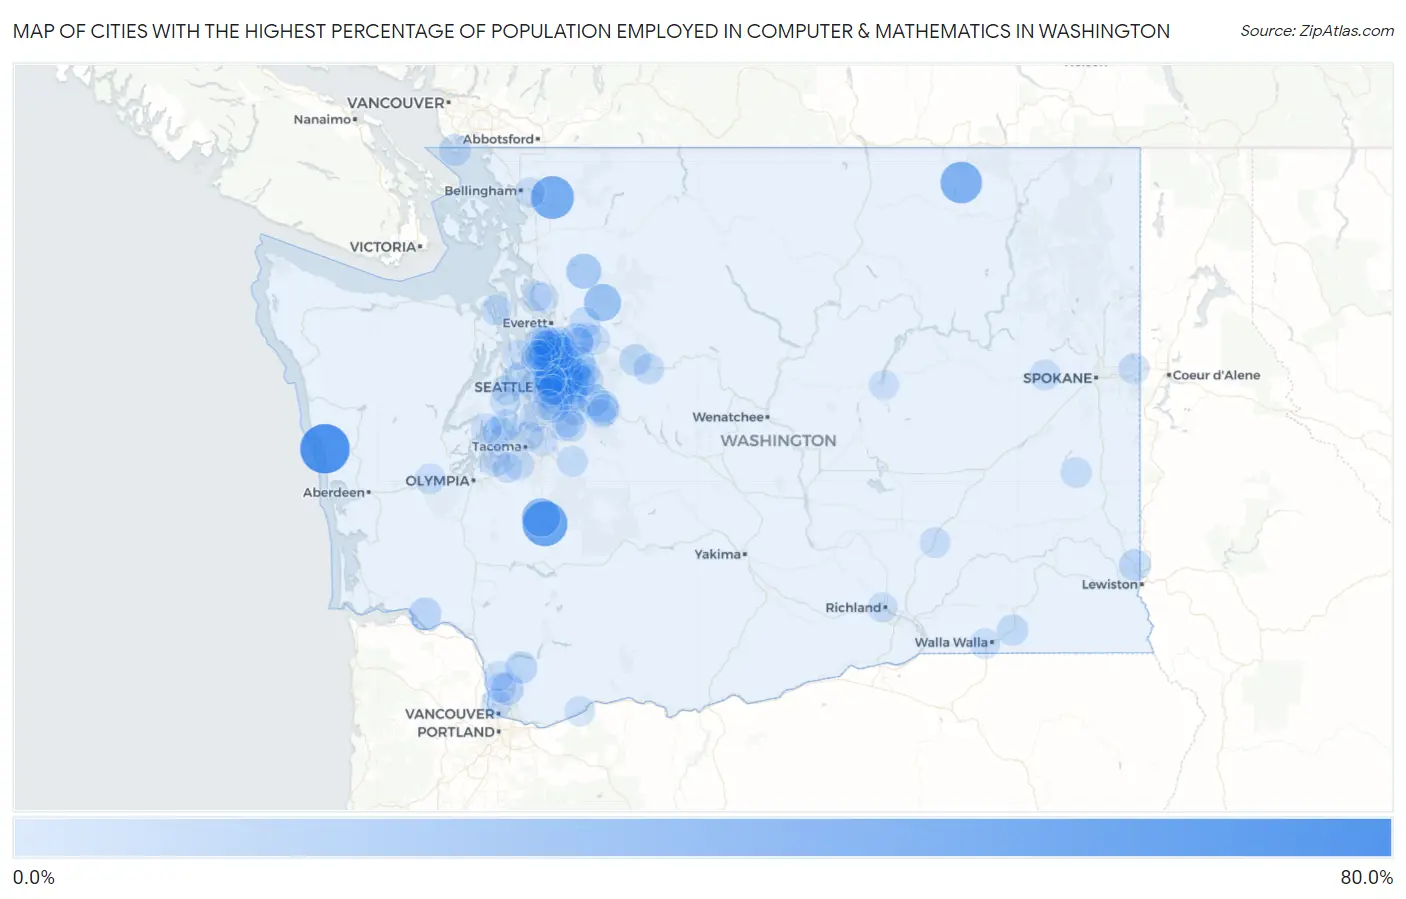
Map of Cities with the Highest Percentage of Population Employed in Computer & Mathematics in Washington
0.0%
80.0%
Cities with the Highest Percentage of Population Employed in Computer & Mathematics in Washington
| City | % Employed | vs State | vs National | |
| 1. | Moclips | 70.5% | 6.1%(+64.5)#1 | 3.5%(+67.0)#9 |
| 2. | Alder | 54.5% | 6.1%(+48.5)#2 | 3.5%(+51.0)#15 |
| 3. | Acme | 47.8% | 6.1%(+41.7)#3 | 3.5%(+44.3)#24 |
| 4. | Malo | 42.9% | 6.1%(+36.8)#4 | 3.5%(+39.3)#32 |
| 5. | Redmond | 34.1% | 6.1%(+28.1)#5 | 3.5%(+30.6)#55 |
| 6. | La Grande | 32.6% | 6.1%(+26.5)#6 | 3.5%(+29.1)#62 |
| 7. | Verlot | 28.0% | 6.1%(+21.9)#7 | 3.5%(+24.5)#81 |
| 8. | Bellevue | 24.7% | 6.1%(+18.6)#8 | 3.5%(+21.2)#105 |
| 9. | Union Hill Novelty Hill | 22.9% | 6.1%(+16.8)#9 | 3.5%(+19.3)#122 |
| 10. | Bothell East | 21.3% | 6.1%(+15.3)#10 | 3.5%(+17.8)#146 |
| 11. | Oso | 21.2% | 6.1%(+15.2)#11 | 3.5%(+17.7)#149 |
| 12. | Sammamish | 19.8% | 6.1%(+13.8)#12 | 3.5%(+16.3)#168 |
| 13. | Mill Creek East | 17.5% | 6.1%(+11.5)#13 | 3.5%(+14.0)#220 |
| 14. | Duvall | 17.4% | 6.1%(+11.3)#14 | 3.5%(+13.9)#224 |
| 15. | Issaquah | 17.3% | 6.1%(+11.3)#15 | 3.5%(+13.8)#227 |
| 16. | Kirkland | 16.5% | 6.1%(+10.4)#16 | 3.5%(+13.0)#252 |
| 17. | Ames Lake | 16.1% | 6.1%(+10.0)#17 | 3.5%(+12.6)#265 |
| 18. | Monroe North | 15.4% | 6.1%(+9.33)#18 | 3.5%(+11.9)#292 |
| 19. | Newcastle | 15.2% | 6.1%(+9.14)#19 | 3.5%(+11.7)#306 |
| 20. | Woodinville | 14.5% | 6.1%(+8.44)#20 | 3.5%(+11.0)#341 |
| 21. | Bothell | 14.4% | 6.1%(+8.33)#21 | 3.5%(+10.9)#350 |
| 22. | Hunts Point | 13.9% | 6.1%(+7.88)#22 | 3.5%(+10.4)#369 |
| 23. | Dollars Corner | 13.7% | 6.1%(+7.67)#23 | 3.5%(+10.2)#377 |
| 24. | Snoqualmie | 13.3% | 6.1%(+7.27)#24 | 3.5%(+9.80)#407 |
| 25. | Bothell West | 13.3% | 6.1%(+7.24)#25 | 3.5%(+9.77)#409 |
| 26. | Raft Island | 13.0% | 6.1%(+6.99)#26 | 3.5%(+9.52)#429 |
| 27. | Seattle | 13.0% | 6.1%(+6.94)#27 | 3.5%(+9.47)#433 |
| 28. | Kenmore | 12.7% | 6.1%(+6.65)#28 | 3.5%(+9.18)#447 |
| 29. | Upper Elochoman | 12.7% | 6.1%(+6.64)#29 | 3.5%(+9.17)#449 |
| 30. | Amboy | 11.8% | 6.1%(+5.77)#30 | 3.5%(+8.30)#511 |
| 31. | Mill Creek | 11.8% | 6.1%(+5.75)#31 | 3.5%(+8.28)#513 |
| 32. | North Bend | 11.8% | 6.1%(+5.72)#32 | 3.5%(+8.25)#517 |
| 33. | Cottage Lake | 11.3% | 6.1%(+5.28)#33 | 3.5%(+7.81)#555 |
| 34. | Uniontown | 11.3% | 6.1%(+5.25)#34 | 3.5%(+7.78)#557 |
| 35. | Point Roberts | 10.9% | 6.1%(+4.84)#35 | 3.5%(+7.38)#605 |
| 36. | Medina | 10.5% | 6.1%(+4.47)#36 | 3.5%(+7.01)#652 |
| 37. | Mercer Island | 10.2% | 6.1%(+4.13)#37 | 3.5%(+6.67)#699 |
| 38. | Riverbend | 10.1% | 6.1%(+4.08)#38 | 3.5%(+6.61)#711 |
| 39. | Baring | 10.0% | 6.1%(+3.94)#39 | 3.5%(+6.48)#735 |
| 40. | Clyde Hill | 9.9% | 6.1%(+3.88)#40 | 3.5%(+6.42)#743 |
| 41. | Clearview | 9.9% | 6.1%(+3.83)#41 | 3.5%(+6.36)#750 |
| 42. | Silver Firs | 9.8% | 6.1%(+3.72)#42 | 3.5%(+6.26)#775 |
| 43. | Alderwood Manor | 9.6% | 6.1%(+3.52)#43 | 3.5%(+6.05)#818 |
| 44. | Maltby | 9.5% | 6.1%(+3.43)#44 | 3.5%(+5.96)#837 |
| 45. | Lake Forest Park | 9.4% | 6.1%(+3.32)#45 | 3.5%(+5.86)#859 |
| 46. | Yarrow Point | 9.4% | 6.1%(+3.30)#46 | 3.5%(+5.84)#862 |
| 47. | Carnation | 9.3% | 6.1%(+3.19)#47 | 3.5%(+5.73)#885 |
| 48. | Martha Lake | 9.0% | 6.1%(+2.98)#48 | 3.5%(+5.51)#937 |
| 49. | Dixie | 9.0% | 6.1%(+2.90)#49 | 3.5%(+5.43)#950 |
| 50. | Canterwood | 8.8% | 6.1%(+2.71)#50 | 3.5%(+5.25)#984 |
| 51. | Lake Roesiger | 8.6% | 6.1%(+2.54)#51 | 3.5%(+5.07)#1,035 |
| 52. | Brier | 8.5% | 6.1%(+2.47)#52 | 3.5%(+5.00)#1,054 |
| 53. | Skykomish | 8.3% | 6.1%(+2.28)#53 | 3.5%(+4.81)#1,105 |
| 54. | Larch Way | 8.3% | 6.1%(+2.27)#54 | 3.5%(+4.80)#1,111 |
| 55. | Bainbridge Island | 8.2% | 6.1%(+2.13)#55 | 3.5%(+4.67)#1,149 |
| 56. | Marrowstone | 7.9% | 6.1%(+1.84)#56 | 3.5%(+4.37)#1,267 |
| 57. | Buckley | 7.8% | 6.1%(+1.79)#57 | 3.5%(+4.32)#1,280 |
| 58. | Shadow Lake | 7.7% | 6.1%(+1.66)#58 | 3.5%(+4.20)#1,323 |
| 59. | Normandy Park | 7.6% | 6.1%(+1.58)#59 | 3.5%(+4.11)#1,354 |
| 60. | Fairwood Cdp King County | 7.6% | 6.1%(+1.57)#60 | 3.5%(+4.10)#1,356 |
| 61. | Mirrormont | 7.6% | 6.1%(+1.56)#61 | 3.5%(+4.10)#1,362 |
| 62. | St John | 7.6% | 6.1%(+1.54)#62 | 3.5%(+4.08)#1,367 |
| 63. | Maple Valley | 7.5% | 6.1%(+1.46)#63 | 3.5%(+3.99)#1,399 |
| 64. | Otis Orchards East Farms | 7.4% | 6.1%(+1.30)#64 | 3.5%(+3.83)#1,452 |
| 65. | Reardan | 7.3% | 6.1%(+1.23)#65 | 3.5%(+3.76)#1,477 |
| 66. | Renton | 7.3% | 6.1%(+1.22)#66 | 3.5%(+3.75)#1,480 |
| 67. | Lake Stickney | 6.9% | 6.1%(+0.863)#67 | 3.5%(+3.40)#1,639 |
| 68. | Lake Shore | 6.8% | 6.1%(+0.778)#68 | 3.5%(+3.31)#1,690 |
| 69. | Anderson Island | 6.8% | 6.1%(+0.724)#69 | 3.5%(+3.26)#1,717 |
| 70. | Shoreline | 6.7% | 6.1%(+0.686)#70 | 3.5%(+3.22)#1,734 |
| 71. | Mcchord Afb | 6.7% | 6.1%(+0.666)#71 | 3.5%(+3.20)#1,748 |
| 72. | Connell | 6.7% | 6.1%(+0.641)#72 | 3.5%(+3.17)#1,758 |
| 73. | Kingston | 6.7% | 6.1%(+0.617)#73 | 3.5%(+3.15)#1,766 |
| 74. | North Sultan | 6.5% | 6.1%(+0.489)#74 | 3.5%(+3.02)#1,847 |
| 75. | Mccleary | 6.5% | 6.1%(+0.485)#75 | 3.5%(+3.02)#1,850 |
| 76. | Garrett | 6.5% | 6.1%(+0.397)#76 | 3.5%(+2.93)#1,891 |
| 77. | Dash Point | 6.4% | 6.1%(+0.325)#77 | 3.5%(+2.86)#1,920 |
| 78. | Vaughn | 6.3% | 6.1%(+0.262)#78 | 3.5%(+2.80)#1,956 |
| 79. | Woods Creek | 6.2% | 6.1%(+0.144)#79 | 3.5%(+2.68)#2,030 |
| 80. | Picnic Point | 6.2% | 6.1%(+0.138)#80 | 3.5%(+2.67)#2,036 |
| 81. | North Fort Lewis | 6.1% | 6.1%(+0.075)#81 | 3.5%(+2.61)#2,081 |
| 82. | Geneva | 6.1% | 6.1%(+0.017)#82 | 3.5%(+2.55)#2,119 |
| 83. | Duluth | 5.9% | 6.1%(-0.133)#83 | 3.5%(+2.40)#2,229 |
| 84. | Beaux Arts Village | 5.8% | 6.1%(-0.261)#84 | 3.5%(+2.27)#2,317 |
| 85. | Esperance | 5.7% | 6.1%(-0.362)#85 | 3.5%(+2.17)#2,398 |
| 86. | Monroe | 5.7% | 6.1%(-0.362)#86 | 3.5%(+2.17)#2,399 |
| 87. | North Bonneville | 5.7% | 6.1%(-0.373)#87 | 3.5%(+2.16)#2,412 |
| 88. | Enetai | 5.6% | 6.1%(-0.487)#88 | 3.5%(+2.05)#2,511 |
| 89. | Lake Goodwin | 5.5% | 6.1%(-0.578)#89 | 3.5%(+1.96)#2,587 |
| 90. | East Port Orchard | 5.4% | 6.1%(-0.700)#90 | 3.5%(+1.83)#2,720 |
| 91. | La Center | 5.3% | 6.1%(-0.783)#91 | 3.5%(+1.75)#2,799 |
| 92. | Wilderness Rim | 5.2% | 6.1%(-0.836)#92 | 3.5%(+1.70)#2,838 |
| 93. | Richland | 5.2% | 6.1%(-0.878)#93 | 3.5%(+1.66)#2,884 |
| 94. | Lake Marcel Stillwater | 5.2% | 6.1%(-0.888)#94 | 3.5%(+1.65)#2,892 |
| 95. | Covington | 5.2% | 6.1%(-0.895)#95 | 3.5%(+1.64)#2,900 |
| 96. | Bryn Mawr Skyway | 5.2% | 6.1%(-0.898)#96 | 3.5%(+1.64)#2,904 |
| 97. | Coulee City | 5.1% | 6.1%(-0.930)#97 | 3.5%(+1.60)#2,944 |
| 98. | Lakeland South | 5.1% | 6.1%(-0.940)#98 | 3.5%(+1.59)#2,953 |
| 99. | Kayak Point | 5.1% | 6.1%(-0.969)#99 | 3.5%(+1.56)#2,982 |
| 100. | Mountlake Terrace | 5.1% | 6.1%(-0.994)#100 | 3.5%(+1.54)#3,013 |
Common Questions
What are the Top 10 Cities with the Highest Percentage of Population Employed in Computer & Mathematics in Washington?
Top 10 Cities with the Highest Percentage of Population Employed in Computer & Mathematics in Washington are:
#1
70.5%
#2
54.5%
#3
47.8%
#4
42.9%
#5
34.1%
#6
32.6%
#7
28.0%
#8
24.7%
#9
22.9%
#10
21.3%
What city has the Highest Percentage of Population Employed in Computer & Mathematics in Washington?
Moclips has the Highest Percentage of Population Employed in Computer & Mathematics in Washington with 70.5%.
What is the Percentage of Population Employed in Computer & Mathematics in the State of Washington?
Percentage of Population Employed in Computer & Mathematics in Washington is 6.1%.
What is the Percentage of Population Employed in Computer & Mathematics in the United States?
Percentage of Population Employed in Computer & Mathematics in the United States is 3.5%.