Cities with the Highest Percentage of Population Employed in Computer & Mathematics in Maryland
RELATED REPORTS & OPTIONS
Computer & Mathematics
Maryland
Compare Cities
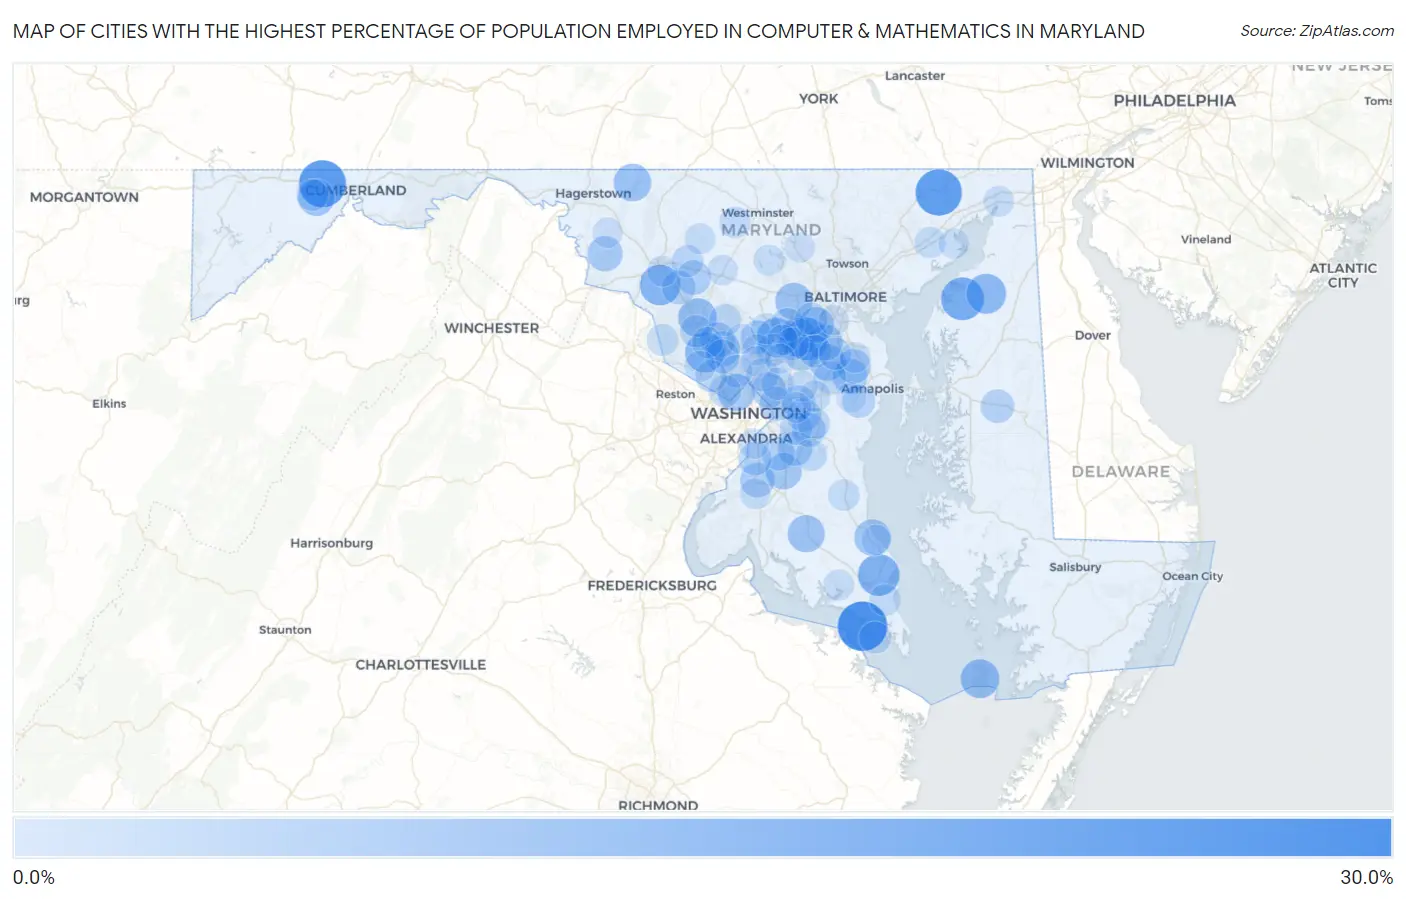
Map of Cities with the Highest Percentage of Population Employed in Computer & Mathematics in Maryland
0.0%
30.0%
Cities with the Highest Percentage of Population Employed in Computer & Mathematics in Maryland
| City | % Employed | vs State | vs National | |
| 1. | Tall Timbers | 25.9% | 6.1%(+19.8)#1 | 3.5%(+22.4)#96 |
| 2. | Zihlman | 23.6% | 6.1%(+17.4)#2 | 3.5%(+20.1)#113 |
| 3. | Lewistown | 23.1% | 6.1%(+17.0)#3 | 3.5%(+19.6)#117 |
| 4. | Darlington | 22.8% | 6.1%(+16.7)#4 | 3.5%(+19.3)#124 |
| 5. | Butlertown | 19.5% | 6.1%(+13.4)#5 | 3.5%(+16.0)#175 |
| 6. | Jessup | 19.1% | 6.1%(+13.0)#6 | 3.5%(+15.6)#184 |
| 7. | Solomons | 18.2% | 6.1%(+12.1)#7 | 3.5%(+14.7)#204 |
| 8. | Buckeystown | 17.4% | 6.1%(+11.2)#8 | 3.5%(+13.8)#225 |
| 9. | North Potomac | 16.7% | 6.1%(+10.6)#9 | 3.5%(+13.2)#241 |
| 10. | Kennedyville | 16.5% | 6.1%(+10.4)#10 | 3.5%(+13.0)#248 |
| 11. | Fulton | 16.0% | 6.1%(+9.86)#11 | 3.5%(+12.5)#268 |
| 12. | Smith Island | 15.5% | 6.1%(+9.35)#12 | 3.5%(+12.0)#289 |
| 13. | Clarksburg | 15.3% | 6.1%(+9.21)#13 | 3.5%(+11.8)#300 |
| 14. | Savage | 15.0% | 6.1%(+8.84)#14 | 3.5%(+11.4)#318 |
| 15. | Edgemont | 14.4% | 6.1%(+8.25)#15 | 3.5%(+10.9)#351 |
| 16. | Friendship Heights Village | 14.1% | 6.1%(+8.00)#16 | 3.5%(+10.6)#362 |
| 17. | Charlotte Hall | 14.0% | 6.1%(+7.87)#17 | 3.5%(+10.5)#368 |
| 18. | Ellicott City | 13.9% | 6.1%(+7.78)#18 | 3.5%(+10.4)#371 |
| 19. | Shaft | 13.6% | 6.1%(+7.50)#19 | 3.5%(+10.1)#384 |
| 20. | St Leonard | 13.3% | 6.1%(+7.16)#20 | 3.5%(+9.77)#410 |
| 21. | Wildewood | 13.3% | 6.1%(+7.15)#21 | 3.5%(+9.76)#411 |
| 22. | Odenton | 13.2% | 6.1%(+7.06)#22 | 3.5%(+9.67)#417 |
| 23. | Brandywine | 13.1% | 6.1%(+6.93)#23 | 3.5%(+9.55)#427 |
| 24. | Severn | 12.9% | 6.1%(+6.78)#24 | 3.5%(+9.40)#437 |
| 25. | Elkridge | 12.7% | 6.1%(+6.55)#25 | 3.5%(+9.16)#451 |
| 26. | Rohrersville | 12.3% | 6.1%(+6.17)#26 | 3.5%(+8.78)#472 |
| 27. | Washington Grove | 12.2% | 6.1%(+6.03)#27 | 3.5%(+8.64)#481 |
| 28. | Derwood | 12.1% | 6.1%(+6.01)#28 | 3.5%(+8.62)#485 |
| 29. | Crownsville | 12.1% | 6.1%(+5.99)#29 | 3.5%(+8.60)#488 |
| 30. | University Park | 12.0% | 6.1%(+5.88)#30 | 3.5%(+8.49)#496 |
| 31. | Accokeek | 11.8% | 6.1%(+5.66)#31 | 3.5%(+8.28)#514 |
| 32. | Rosaryville | 11.7% | 6.1%(+5.53)#32 | 3.5%(+8.14)#528 |
| 33. | Herald Harbor | 11.6% | 6.1%(+5.48)#33 | 3.5%(+8.09)#530 |
| 34. | Monrovia | 11.5% | 6.1%(+5.41)#34 | 3.5%(+8.02)#535 |
| 35. | Maryland City | 11.5% | 6.1%(+5.40)#35 | 3.5%(+8.01)#536 |
| 36. | Cheverly | 11.2% | 6.1%(+5.05)#36 | 3.5%(+7.66)#570 |
| 37. | Mitchellville | 11.1% | 6.1%(+4.93)#37 | 3.5%(+7.54)#586 |
| 38. | Ashton Sandy Spring | 11.0% | 6.1%(+4.84)#38 | 3.5%(+7.45)#595 |
| 39. | Marlboro Village | 10.9% | 6.1%(+4.77)#39 | 3.5%(+7.39)#602 |
| 40. | Columbia | 10.9% | 6.1%(+4.74)#40 | 3.5%(+7.35)#609 |
| 41. | Urbana | 10.9% | 6.1%(+4.73)#41 | 3.5%(+7.34)#610 |
| 42. | Rockville | 10.8% | 6.1%(+4.67)#42 | 3.5%(+7.28)#616 |
| 43. | Hillsboro | 10.8% | 6.1%(+4.62)#43 | 3.5%(+7.23)#618 |
| 44. | Kettering | 10.7% | 6.1%(+4.56)#44 | 3.5%(+7.17)#631 |
| 45. | Clinton | 10.7% | 6.1%(+4.53)#45 | 3.5%(+7.14)#635 |
| 46. | Fort Washington | 10.6% | 6.1%(+4.42)#46 | 3.5%(+7.03)#648 |
| 47. | Edgewater | 10.3% | 6.1%(+4.16)#47 | 3.5%(+6.77)#684 |
| 48. | Fort Meade | 10.1% | 6.1%(+3.97)#48 | 3.5%(+6.58)#716 |
| 49. | Hillandale | 10.1% | 6.1%(+3.96)#49 | 3.5%(+6.57)#719 |
| 50. | North Laurel | 10.0% | 6.1%(+3.85)#50 | 3.5%(+6.46)#740 |
| 51. | Crofton | 9.9% | 6.1%(+3.73)#51 | 3.5%(+6.34)#754 |
| 52. | Westphalia | 9.8% | 6.1%(+3.69)#52 | 3.5%(+6.30)#763 |
| 53. | Garrett Park | 9.7% | 6.1%(+3.55)#53 | 3.5%(+6.16)#794 |
| 54. | Germantown | 9.7% | 6.1%(+3.55)#54 | 3.5%(+6.16)#795 |
| 55. | Ilchester | 9.7% | 6.1%(+3.55)#55 | 3.5%(+6.16)#796 |
| 56. | Berwyn Heights | 9.6% | 6.1%(+3.45)#56 | 3.5%(+6.06)#817 |
| 57. | Gambrills | 9.6% | 6.1%(+3.43)#57 | 3.5%(+6.04)#822 |
| 58. | Brock Hall | 9.5% | 6.1%(+3.40)#58 | 3.5%(+6.01)#826 |
| 59. | Glen Echo | 9.5% | 6.1%(+3.35)#59 | 3.5%(+5.96)#836 |
| 60. | Laytonsville | 9.4% | 6.1%(+3.23)#60 | 3.5%(+5.84)#861 |
| 61. | Linganore | 9.3% | 6.1%(+3.16)#61 | 3.5%(+5.77)#875 |
| 62. | St George Island | 9.3% | 6.1%(+3.14)#62 | 3.5%(+5.75)#880 |
| 63. | Burtonsville | 9.2% | 6.1%(+3.10)#63 | 3.5%(+5.71)#889 |
| 64. | Potomac | 9.2% | 6.1%(+3.04)#64 | 3.5%(+5.65)#901 |
| 65. | Poolesville | 9.2% | 6.1%(+3.03)#65 | 3.5%(+5.64)#903 |
| 66. | Croom | 9.2% | 6.1%(+3.02)#66 | 3.5%(+5.63)#908 |
| 67. | Midlothian | 9.1% | 6.1%(+2.96)#67 | 3.5%(+5.57)#921 |
| 68. | Lexington Park | 8.9% | 6.1%(+2.73)#68 | 3.5%(+5.34)#964 |
| 69. | Huntingtown | 8.8% | 6.1%(+2.62)#69 | 3.5%(+5.23)#992 |
| 70. | New Windsor | 8.7% | 6.1%(+2.57)#70 | 3.5%(+5.18)#1,006 |
| 71. | Riverside | 8.6% | 6.1%(+2.47)#71 | 3.5%(+5.08)#1,033 |
| 72. | Gaithersburg | 8.6% | 6.1%(+2.45)#72 | 3.5%(+5.06)#1,039 |
| 73. | Cloverly | 8.5% | 6.1%(+2.40)#73 | 3.5%(+5.01)#1,050 |
| 74. | Bowie | 8.5% | 6.1%(+2.36)#74 | 3.5%(+4.97)#1,060 |
| 75. | Travilah | 8.5% | 6.1%(+2.34)#75 | 3.5%(+4.95)#1,064 |
| 76. | Callaway | 8.4% | 6.1%(+2.28)#76 | 3.5%(+4.89)#1,084 |
| 77. | Libertytown | 8.4% | 6.1%(+2.26)#77 | 3.5%(+4.87)#1,091 |
| 78. | Highland | 8.4% | 6.1%(+2.24)#78 | 3.5%(+4.85)#1,095 |
| 79. | Burnt Mills | 8.4% | 6.1%(+2.23)#79 | 3.5%(+4.84)#1,097 |
| 80. | Leonardtown | 8.3% | 6.1%(+2.15)#80 | 3.5%(+4.76)#1,120 |
| 81. | Eldersburg | 8.3% | 6.1%(+2.13)#81 | 3.5%(+4.74)#1,129 |
| 82. | Glenn Dale | 8.2% | 6.1%(+2.05)#82 | 3.5%(+4.66)#1,151 |
| 83. | Bensville | 8.2% | 6.1%(+2.03)#83 | 3.5%(+4.64)#1,158 |
| 84. | Brown Station | 8.2% | 6.1%(+2.02)#84 | 3.5%(+4.63)#1,164 |
| 85. | Severna Park | 8.1% | 6.1%(+1.96)#85 | 3.5%(+4.57)#1,178 |
| 86. | Mount Airy | 8.1% | 6.1%(+1.96)#86 | 3.5%(+4.57)#1,181 |
| 87. | Ballenger Creek | 8.1% | 6.1%(+1.95)#87 | 3.5%(+4.56)#1,185 |
| 88. | North East | 8.1% | 6.1%(+1.94)#88 | 3.5%(+4.55)#1,190 |
| 89. | Lake Arbor | 8.0% | 6.1%(+1.91)#89 | 3.5%(+4.52)#1,203 |
| 90. | Boonsboro | 8.0% | 6.1%(+1.87)#90 | 3.5%(+4.48)#1,211 |
| 91. | Scaggsville | 8.0% | 6.1%(+1.86)#91 | 3.5%(+4.47)#1,222 |
| 92. | Linthicum | 8.0% | 6.1%(+1.83)#92 | 3.5%(+4.44)#1,236 |
| 93. | National Harbor | 8.0% | 6.1%(+1.83)#93 | 3.5%(+4.44)#1,237 |
| 94. | Colesville | 7.9% | 6.1%(+1.77)#94 | 3.5%(+4.38)#1,263 |
| 95. | Long Beach | 7.9% | 6.1%(+1.76)#95 | 3.5%(+4.38)#1,264 |
| 96. | Reisterstown | 7.8% | 6.1%(+1.68)#96 | 3.5%(+4.29)#1,295 |
| 97. | Aberdeen Proving Ground | 7.8% | 6.1%(+1.66)#97 | 3.5%(+4.27)#1,300 |
| 98. | Riva | 7.7% | 6.1%(+1.52)#98 | 3.5%(+4.13)#1,353 |
| 99. | Konterra | 7.6% | 6.1%(+1.49)#99 | 3.5%(+4.10)#1,363 |
| 100. | Olney | 7.6% | 6.1%(+1.46)#100 | 3.5%(+4.07)#1,369 |
Common Questions
What are the Top 10 Cities with the Highest Percentage of Population Employed in Computer & Mathematics in Maryland?
Top 10 Cities with the Highest Percentage of Population Employed in Computer & Mathematics in Maryland are:
#1
25.9%
#2
23.6%
#3
22.8%
#4
19.5%
#5
19.1%
#6
18.2%
#7
17.4%
#8
16.7%
#9
16.5%
#10
16.0%
What city has the Highest Percentage of Population Employed in Computer & Mathematics in Maryland?
Tall Timbers has the Highest Percentage of Population Employed in Computer & Mathematics in Maryland with 25.9%.
What is the Percentage of Population Employed in Computer & Mathematics in the State of Maryland?
Percentage of Population Employed in Computer & Mathematics in Maryland is 6.1%.
What is the Percentage of Population Employed in Computer & Mathematics in the United States?
Percentage of Population Employed in Computer & Mathematics in the United States is 3.5%.