Cities with the Highest Percentage of Population Employed in Computer & Mathematics in Utah
RELATED REPORTS & OPTIONS
Computer & Mathematics
Utah
Compare Cities
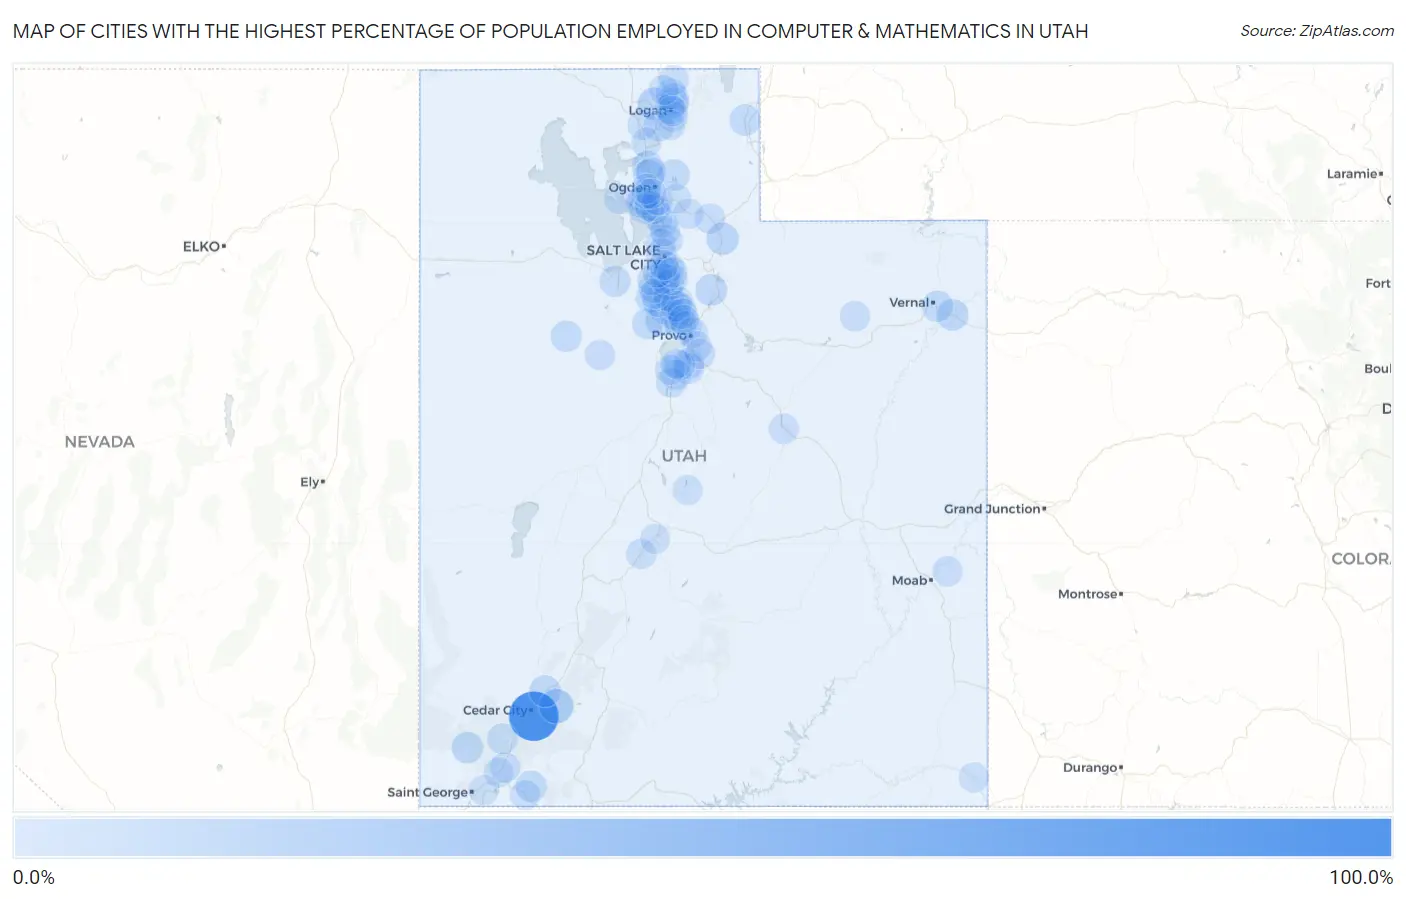
Map of Cities with the Highest Percentage of Population Employed in Computer & Mathematics in Utah
0.0%
100.0%
Cities with the Highest Percentage of Population Employed in Computer & Mathematics in Utah
| City | % Employed | vs State | vs National | |
| 1. | Cedar Highlands | 100.0% | 4.5%(+95.5)#1 | 3.5%(+96.5)#6 |
| 2. | Brian Head | 24.0% | 4.5%(+19.5)#2 | 3.5%(+20.5)#111 |
| 3. | Brighton | 22.2% | 4.5%(+17.7)#3 | 3.5%(+18.7)#131 |
| 4. | Peter | 15.3% | 4.5%(+10.7)#4 | 3.5%(+11.7)#303 |
| 5. | Hoytsville | 13.1% | 4.5%(+8.56)#5 | 3.5%(+9.56)#426 |
| 6. | Summit | 11.1% | 4.5%(+6.59)#6 | 3.5%(+7.59)#576 |
| 7. | Interlaken | 10.9% | 4.5%(+6.39)#7 | 3.5%(+7.38)#603 |
| 8. | Jensen | 10.9% | 4.5%(+6.37)#8 | 3.5%(+7.36)#608 |
| 9. | Central | 10.7% | 4.5%(+6.23)#9 | 3.5%(+7.22)#619 |
| 10. | Saratoga Springs | 10.2% | 4.5%(+5.70)#10 | 3.5%(+6.70)#693 |
| 11. | Naples | 9.6% | 4.5%(+5.13)#11 | 3.5%(+6.13)#801 |
| 12. | Eden | 9.3% | 4.5%(+4.75)#12 | 3.5%(+5.75)#882 |
| 13. | Lehi | 9.1% | 4.5%(+4.60)#13 | 3.5%(+5.59)#916 |
| 14. | Randolph | 9.0% | 4.5%(+4.51)#14 | 3.5%(+5.50)#938 |
| 15. | Rockville | 8.8% | 4.5%(+4.31)#15 | 3.5%(+5.30)#975 |
| 16. | Dugway | 8.6% | 4.5%(+4.12)#16 | 3.5%(+5.11)#1,028 |
| 17. | Erda | 8.6% | 4.5%(+4.07)#17 | 3.5%(+5.06)#1,040 |
| 18. | Vineyard | 8.5% | 4.5%(+3.94)#18 | 3.5%(+4.94)#1,069 |
| 19. | South Willard | 8.5% | 4.5%(+3.94)#19 | 3.5%(+4.94)#1,070 |
| 20. | Herriman | 8.0% | 4.5%(+3.45)#20 | 3.5%(+4.44)#1,239 |
| 21. | Eagle Mountain | 7.7% | 4.5%(+3.16)#21 | 3.5%(+4.15)#1,346 |
| 22. | Bluffdale | 7.4% | 4.5%(+2.89)#22 | 3.5%(+3.89)#1,433 |
| 23. | Farr West | 7.1% | 4.5%(+2.60)#23 | 3.5%(+3.59)#1,550 |
| 24. | Cedar Hills | 6.8% | 4.5%(+2.29)#24 | 3.5%(+3.28)#1,703 |
| 25. | West Point | 6.8% | 4.5%(+2.28)#25 | 3.5%(+3.27)#1,708 |
| 26. | Murray | 6.8% | 4.5%(+2.27)#26 | 3.5%(+3.26)#1,711 |
| 27. | South Jordan | 6.7% | 4.5%(+2.22)#27 | 3.5%(+3.22)#1,738 |
| 28. | Sandy | 6.7% | 4.5%(+2.14)#28 | 3.5%(+3.14)#1,782 |
| 29. | Hyde Park | 6.6% | 4.5%(+2.07)#29 | 3.5%(+3.06)#1,821 |
| 30. | Alpine | 6.3% | 4.5%(+1.81)#30 | 3.5%(+2.80)#1,954 |
| 31. | American Fork | 6.2% | 4.5%(+1.73)#31 | 3.5%(+2.72)#1,999 |
| 32. | Draper | 6.2% | 4.5%(+1.70)#32 | 3.5%(+2.69)#2,018 |
| 33. | New Harmony | 6.2% | 4.5%(+1.65)#33 | 3.5%(+2.64)#2,062 |
| 34. | Highland | 6.1% | 4.5%(+1.57)#34 | 3.5%(+2.56)#2,111 |
| 35. | Smithfield | 5.8% | 4.5%(+1.28)#35 | 3.5%(+2.27)#2,319 |
| 36. | Salt Lake City | 5.7% | 4.5%(+1.23)#36 | 3.5%(+2.22)#2,359 |
| 37. | Orem | 5.7% | 4.5%(+1.14)#37 | 3.5%(+2.13)#2,442 |
| 38. | Elk Ridge | 5.6% | 4.5%(+1.08)#38 | 3.5%(+2.07)#2,486 |
| 39. | Kaysville | 5.4% | 4.5%(+0.873)#39 | 3.5%(+1.87)#2,682 |
| 40. | Millville | 5.4% | 4.5%(+0.860)#40 | 3.5%(+1.85)#2,694 |
| 41. | Clinton | 5.3% | 4.5%(+0.817)#41 | 3.5%(+1.81)#2,741 |
| 42. | Bluebell | 5.3% | 4.5%(+0.786)#42 | 3.5%(+1.78)#2,773 |
| 43. | West Jordan | 5.3% | 4.5%(+0.778)#43 | 3.5%(+1.77)#2,778 |
| 44. | Henefer | 5.3% | 4.5%(+0.774)#44 | 3.5%(+1.77)#2,782 |
| 45. | Salem | 5.3% | 4.5%(+0.738)#45 | 3.5%(+1.73)#2,812 |
| 46. | Cottonwood Heights | 5.2% | 4.5%(+0.723)#46 | 3.5%(+1.71)#2,820 |
| 47. | Provo | 5.2% | 4.5%(+0.719)#47 | 3.5%(+1.71)#2,823 |
| 48. | Pleasant Grove | 5.2% | 4.5%(+0.656)#48 | 3.5%(+1.65)#2,887 |
| 49. | Millcreek | 5.1% | 4.5%(+0.573)#49 | 3.5%(+1.57)#2,979 |
| 50. | Springville | 5.0% | 4.5%(+0.491)#50 | 3.5%(+1.48)#3,079 |
| 51. | Bountiful | 4.9% | 4.5%(+0.433)#51 | 3.5%(+1.43)#3,145 |
| 52. | Hobble Creek | 4.9% | 4.5%(+0.385)#52 | 3.5%(+1.38)#3,200 |
| 53. | Farmington | 4.9% | 4.5%(+0.382)#53 | 3.5%(+1.37)#3,203 |
| 54. | Wellsville | 4.9% | 4.5%(+0.352)#54 | 3.5%(+1.34)#3,245 |
| 55. | Vernon | 4.8% | 4.5%(+0.303)#55 | 3.5%(+1.29)#3,305 |
| 56. | Castle Valley | 4.8% | 4.5%(+0.296)#56 | 3.5%(+1.29)#3,310 |
| 57. | Layton | 4.8% | 4.5%(+0.280)#57 | 3.5%(+1.27)#3,329 |
| 58. | White | 4.8% | 4.5%(+0.240)#58 | 3.5%(+1.23)#3,372 |
| 59. | Midvale | 4.7% | 4.5%(+0.206)#59 | 3.5%(+1.20)#3,416 |
| 60. | Toquerville | 4.6% | 4.5%(+0.059)#60 | 3.5%(+1.05)#3,590 |
| 61. | West Wood | 4.6% | 4.5%(+0.050)#61 | 3.5%(+1.04)#3,604 |
| 62. | Riverton | 4.5% | 4.5%(+0.020)#62 | 3.5%(+1.01)#3,639 |
| 63. | Santaquin | 4.5% | 4.5%(-0.049)#63 | 3.5%(+0.943)#3,720 |
| 64. | Syracuse | 4.5% | 4.5%(-0.062)#64 | 3.5%(+0.930)#3,733 |
| 65. | Holladay | 4.5% | 4.5%(-0.065)#65 | 3.5%(+0.927)#3,734 |
| 66. | Mapleton | 4.4% | 4.5%(-0.107)#66 | 3.5%(+0.885)#3,801 |
| 67. | Payson | 4.4% | 4.5%(-0.137)#67 | 3.5%(+0.855)#3,852 |
| 68. | Clearfield | 4.4% | 4.5%(-0.146)#68 | 3.5%(+0.846)#3,863 |
| 69. | Pleasant View | 4.4% | 4.5%(-0.156)#69 | 3.5%(+0.836)#3,878 |
| 70. | Richfield | 4.3% | 4.5%(-0.183)#70 | 3.5%(+0.809)#3,926 |
| 71. | Rocky Ridge | 4.3% | 4.5%(-0.209)#71 | 3.5%(+0.783)#3,971 |
| 72. | North Salt Lake | 4.2% | 4.5%(-0.308)#72 | 3.5%(+0.684)#4,116 |
| 73. | South Weber | 4.2% | 4.5%(-0.318)#73 | 3.5%(+0.674)#4,130 |
| 74. | Lindon | 4.1% | 4.5%(-0.367)#74 | 3.5%(+0.625)#4,229 |
| 75. | North Logan | 4.1% | 4.5%(-0.391)#75 | 3.5%(+0.601)#4,268 |
| 76. | Centerville | 4.1% | 4.5%(-0.404)#76 | 3.5%(+0.588)#4,283 |
| 77. | Hooper | 4.1% | 4.5%(-0.420)#77 | 3.5%(+0.572)#4,316 |
| 78. | Taylorsville | 4.1% | 4.5%(-0.426)#78 | 3.5%(+0.566)#4,325 |
| 79. | Logan | 4.1% | 4.5%(-0.449)#79 | 3.5%(+0.543)#4,360 |
| 80. | Honeyville | 4.0% | 4.5%(-0.488)#80 | 3.5%(+0.504)#4,410 |
| 81. | Sterling | 4.0% | 4.5%(-0.548)#81 | 3.5%(+0.444)#4,521 |
| 82. | Morgan | 3.9% | 4.5%(-0.596)#82 | 3.5%(+0.396)#4,605 |
| 83. | East Basin | 3.9% | 4.5%(-0.600)#83 | 3.5%(+0.392)#4,612 |
| 84. | Mountain Green | 3.9% | 4.5%(-0.663)#84 | 3.5%(+0.329)#4,714 |
| 85. | Richmond | 3.8% | 4.5%(-0.693)#85 | 3.5%(+0.299)#4,778 |
| 86. | Hyrum | 3.7% | 4.5%(-0.784)#86 | 3.5%(+0.208)#4,947 |
| 87. | Roy | 3.7% | 4.5%(-0.789)#87 | 3.5%(+0.203)#4,951 |
| 88. | River Heights | 3.7% | 4.5%(-0.810)#88 | 3.5%(+0.182)#4,987 |
| 89. | Genola | 3.6% | 4.5%(-0.883)#89 | 3.5%(+0.109)#5,143 |
| 90. | Amalga | 3.6% | 4.5%(-0.917)#90 | 3.5%(+0.075)#5,201 |
| 91. | West Haven | 3.6% | 4.5%(-0.922)#91 | 3.5%(+0.070)#5,216 |
| 92. | Apple Valley | 3.6% | 4.5%(-0.952)#92 | 3.5%(+0.040)#5,277 |
| 93. | West Mountain | 3.6% | 4.5%(-0.956)#93 | 3.5%(+0.036)#5,287 |
| 94. | South Salt Lake | 3.6% | 4.5%(-0.966)#94 | 3.5%(+0.026)#5,306 |
| 95. | Riverdale | 3.5% | 4.5%(-0.970)#95 | 3.5%(+0.022)#5,315 |
| 96. | Washington | 3.5% | 4.5%(-0.970)#96 | 3.5%(+0.022)#5,317 |
| 97. | Aneth | 3.5% | 4.5%(-0.987)#97 | 3.5%(+0.005)#5,357 |
| 98. | Brigham City | 3.5% | 4.5%(-0.995)#98 | 3.5%(-0.003)#5,379 |
| 99. | Sigurd | 3.5% | 4.5%(-1.01)#99 | 3.5%(-0.016)#5,404 |
| 100. | Leeds | 3.5% | 4.5%(-1.02)#100 | 3.5%(-0.033)#5,435 |
Common Questions
What are the Top 10 Cities with the Highest Percentage of Population Employed in Computer & Mathematics in Utah?
Top 10 Cities with the Highest Percentage of Population Employed in Computer & Mathematics in Utah are:
#1
100.0%
#2
24.0%
#3
15.3%
#4
13.1%
#5
11.1%
#6
10.9%
#7
10.9%
#8
10.7%
#9
10.2%
#10
9.6%
What city has the Highest Percentage of Population Employed in Computer & Mathematics in Utah?
Cedar Highlands has the Highest Percentage of Population Employed in Computer & Mathematics in Utah with 100.0%.
What is the Percentage of Population Employed in Computer & Mathematics in the State of Utah?
Percentage of Population Employed in Computer & Mathematics in Utah is 4.5%.
What is the Percentage of Population Employed in Computer & Mathematics in the United States?
Percentage of Population Employed in Computer & Mathematics in the United States is 3.5%.