Colma, CA Map & Demographics
Colma Map
Colma Overview
$49,696
PER CAPITA INCOME
$134,861
AVG FAMILY INCOME
$123,864
AVG HOUSEHOLD INCOME
22.5%
WAGE / INCOME GAP [ % ]
77.5¢/ $1
WAGE / INCOME GAP [ $ ]
0.40
INEQUALITY / GINI INDEX
1,376
TOTAL POPULATION
722
MALE POPULATION
654
FEMALE POPULATION
110.40
MALES / 100 FEMALES
90.58
FEMALES / 100 MALES
42.4
MEDIAN AGE
3.8
AVG FAMILY SIZE
3.1
AVG HOUSEHOLD SIZE
782
LABOR FORCE [ PEOPLE ]
68.5%
PERCENT IN LABOR FORCE
6.9%
UNEMPLOYMENT RATE
Colma Area Codes
Income in Colma
Income Overview in Colma
Per Capita Income in Colma is $49,696, while median incomes of families and households are $134,861 and $123,864 respectively.
| Characteristic | Number | Measure |
| Per Capita Income | 1,376 | $49,696 |
| Median Family Income | 313 | $134,861 |
| Mean Family Income | 313 | $142,620 |
| Median Household Income | 444 | $123,864 |
| Mean Household Income | 444 | $145,735 |
| Income Deficit | 313 | $0 |
| Wage / Income Gap (%) | 1,376 | 22.47% |
| Wage / Income Gap ($) | 1,376 | 77.53¢ per $1 |
| Gini / Inequality Index | 1,376 | 0.40 |
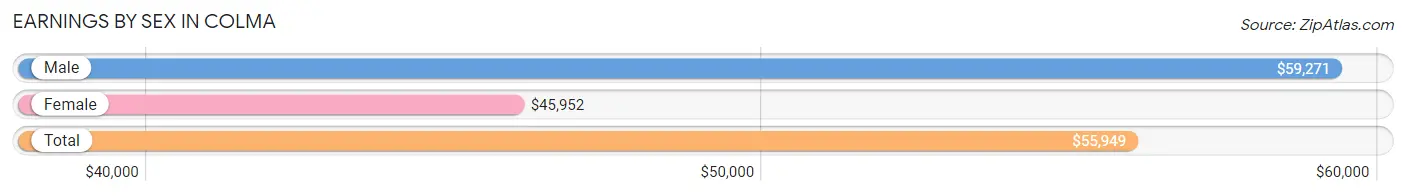
Earnings by Sex in Colma
Average Earnings in Colma are $55,949, $59,271 for men and $45,952 for women, a difference of 22.5%.
| Sex | Number | Average Earnings |
| Male | 393 (50.3%) | $59,271 |
| Female | 388 (49.7%) | $45,952 |
| Total | 781 (100.0%) | $55,949 |
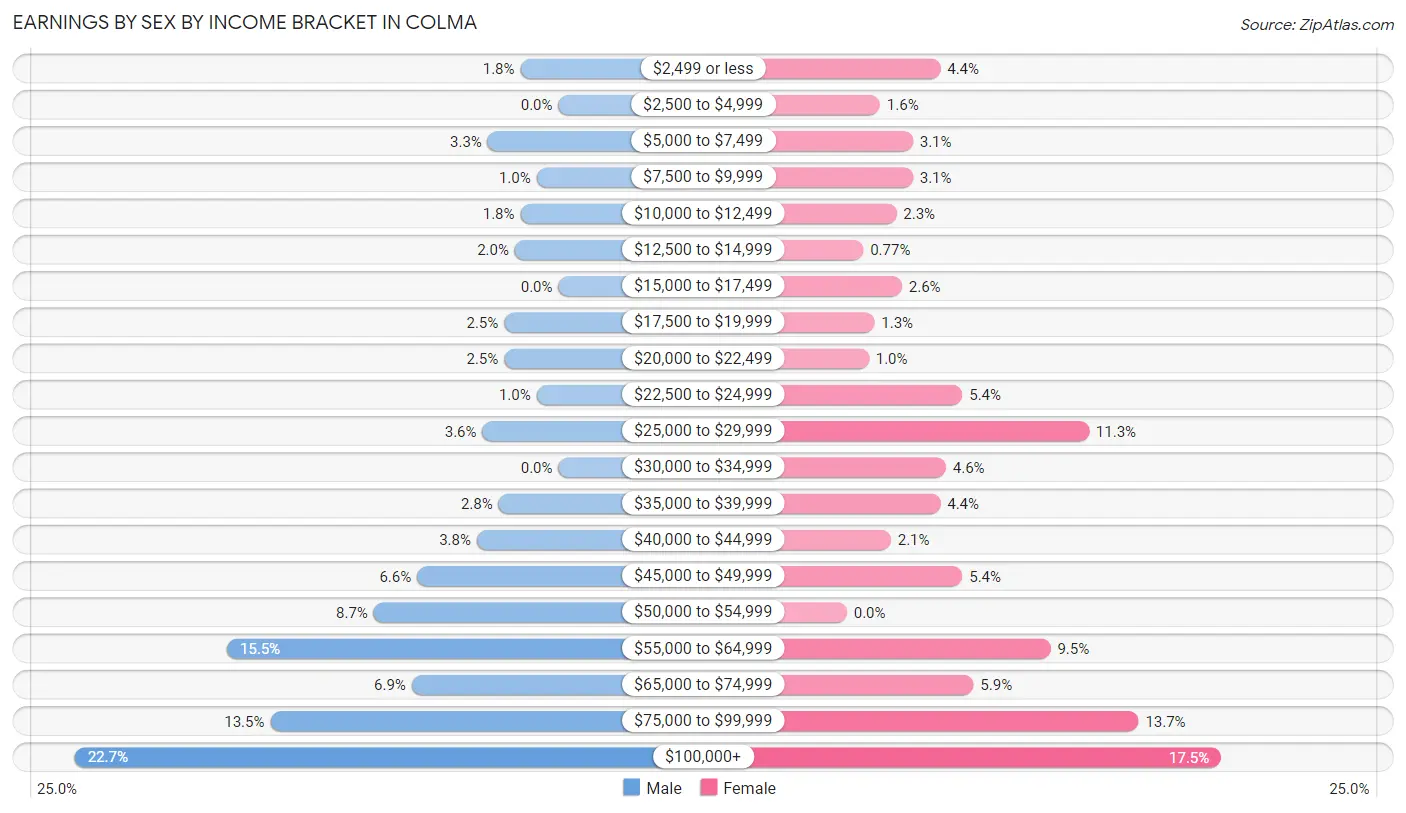
Earnings by Sex by Income Bracket in Colma
The most common earnings brackets in Colma are $100,000+ for men (89 | 22.7%) and $100,000+ for women (68 | 17.5%).
| Income | Male | Female |
| $2,499 or less | 7 (1.8%) | 17 (4.4%) |
| $2,500 to $4,999 | 0 (0.0%) | 6 (1.5%) |
| $5,000 to $7,499 | 13 (3.3%) | 12 (3.1%) |
| $7,500 to $9,999 | 4 (1.0%) | 12 (3.1%) |
| $10,000 to $12,499 | 7 (1.8%) | 9 (2.3%) |
| $12,500 to $14,999 | 8 (2.0%) | 3 (0.8%) |
| $15,000 to $17,499 | 0 (0.0%) | 10 (2.6%) |
| $17,500 to $19,999 | 10 (2.5%) | 5 (1.3%) |
| $20,000 to $22,499 | 10 (2.5%) | 4 (1.0%) |
| $22,500 to $24,999 | 4 (1.0%) | 21 (5.4%) |
| $25,000 to $29,999 | 14 (3.6%) | 44 (11.3%) |
| $30,000 to $34,999 | 0 (0.0%) | 18 (4.6%) |
| $35,000 to $39,999 | 11 (2.8%) | 17 (4.4%) |
| $40,000 to $44,999 | 15 (3.8%) | 8 (2.1%) |
| $45,000 to $49,999 | 26 (6.6%) | 21 (5.4%) |
| $50,000 to $54,999 | 34 (8.6%) | 0 (0.0%) |
| $55,000 to $64,999 | 61 (15.5%) | 37 (9.5%) |
| $65,000 to $74,999 | 27 (6.9%) | 23 (5.9%) |
| $75,000 to $99,999 | 53 (13.5%) | 53 (13.7%) |
| $100,000+ | 89 (22.7%) | 68 (17.5%) |
| Total | 393 (100.0%) | 388 (100.0%) |
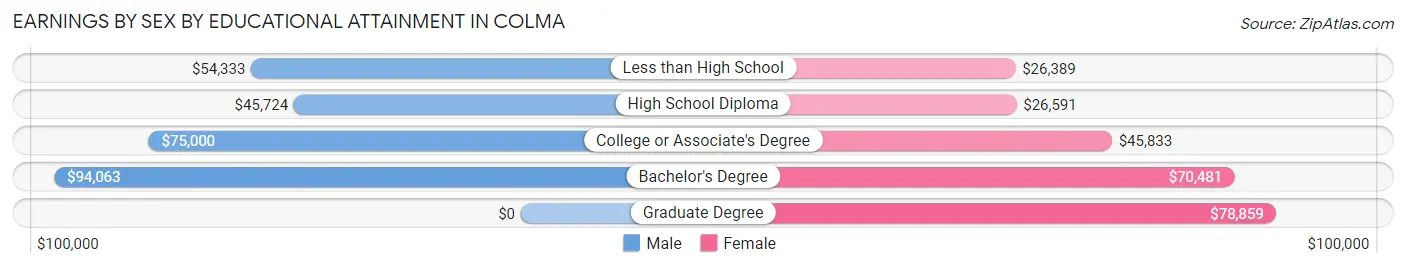
Earnings by Sex by Educational Attainment in Colma
Average earnings in Colma are $63,646 for men and $55,833 for women, a difference of 12.3%. Men with an educational attainment of bachelor's degree enjoy the highest average annual earnings of $94,063, while those with high school diploma education earn the least with $45,724. Women with an educational attainment of graduate degree earn the most with the average annual earnings of $78,859, while those with less than high school education have the smallest earnings of $26,389.
| Educational Attainment | Male Income | Female Income |
| Less than High School | $54,333 | $26,389 |
| High School Diploma | $45,724 | $26,591 |
| College or Associate's Degree | $75,000 | $45,833 |
| Bachelor's Degree | $94,063 | $70,481 |
| Graduate Degree | - | - |
| Total | $63,646 | $55,833 |
Family Income in Colma
Family Income Brackets in Colma
According to the Colma family income data, there are 90 families falling into the $150,000 to $199,999 income range, which is the most common income bracket and makes up 28.7% of all families. Conversely, the less than $10,000 income bracket is the least frequent group with only 3 families (1.0%) belonging to this category.
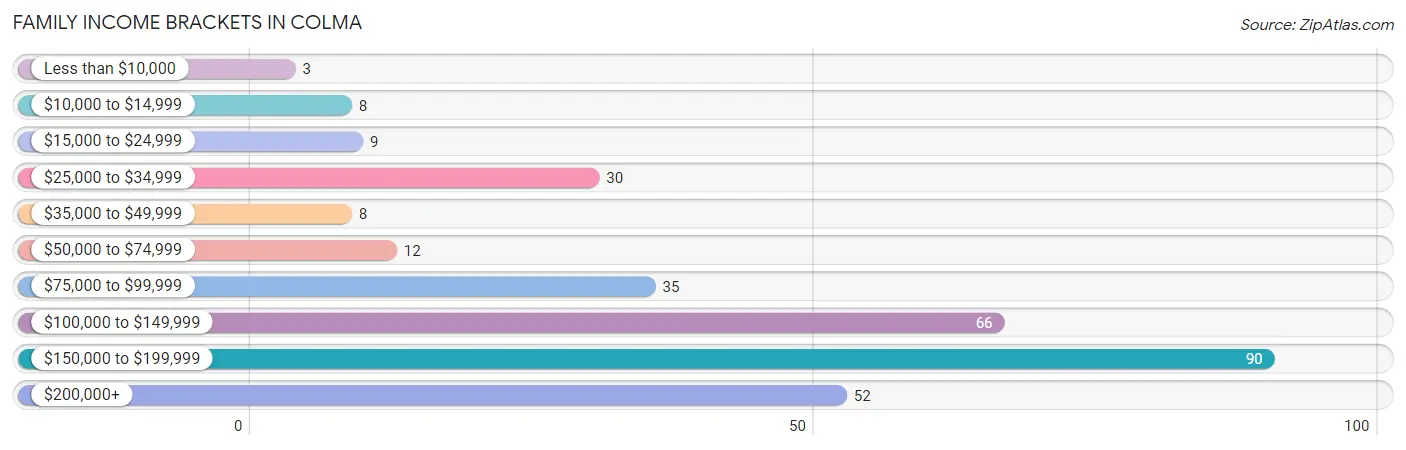
| Income Bracket | # Families | % Families |
| Less than $10,000 | 3 | 1.0% |
| $10,000 to $14,999 | 8 | 2.6% |
| $15,000 to $24,999 | 9 | 2.9% |
| $25,000 to $34,999 | 30 | 9.6% |
| $35,000 to $49,999 | 8 | 2.6% |
| $50,000 to $74,999 | 12 | 3.8% |
| $75,000 to $99,999 | 35 | 11.2% |
| $100,000 to $149,999 | 66 | 21.1% |
| $150,000 to $199,999 | 90 | 28.8% |
| $200,000+ | 52 | 16.6% |
Family Income by Famaliy Size in Colma
6-person families (12 | 3.8%) account for the highest median family income in Colma with $213,750 per family, while 3-person families (98 | 31.3%) have the highest median income of $49,792 per family member.
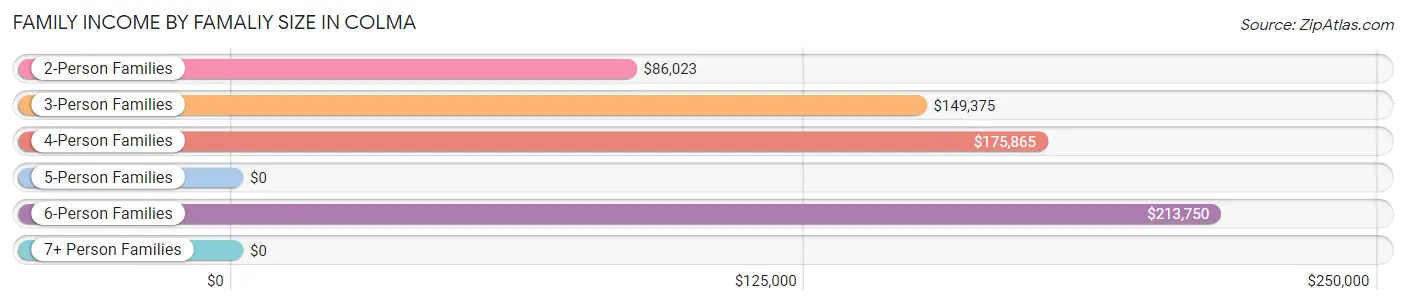
| Income Bracket | # Families | Median Income |
| 2-Person Families | 95 (30.3%) | $86,023 |
| 3-Person Families | 98 (31.3%) | $149,375 |
| 4-Person Families | 63 (20.1%) | $175,865 |
| 5-Person Families | 30 (9.6%) | $0 |
| 6-Person Families | 12 (3.8%) | $213,750 |
| 7+ Person Families | 15 (4.8%) | $0 |
| Total | 313 (100.0%) | $134,861 |
Family Income by Number of Earners in Colma
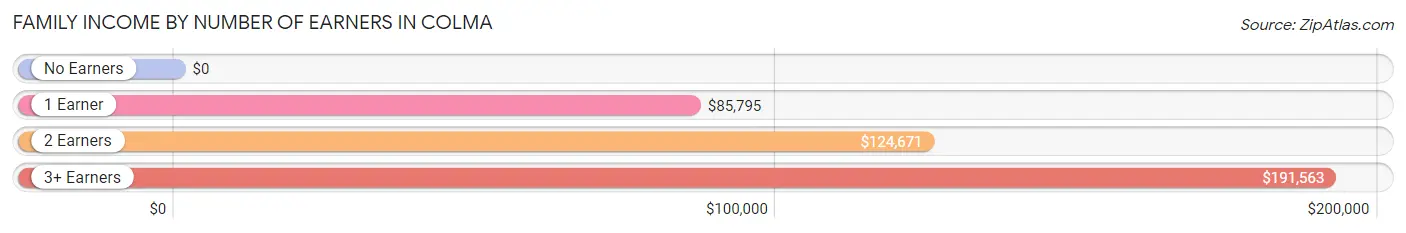
| Number of Earners | # Families | Median Income |
| No Earners | 24 (7.7%) | $0 |
| 1 Earner | 85 (27.2%) | $85,795 |
| 2 Earners | 127 (40.6%) | $124,671 |
| 3+ Earners | 77 (24.6%) | $191,563 |
| Total | 313 (100.0%) | $134,861 |
Household Income in Colma
Household Income Brackets in Colma
With 102 households falling in the category, the $150,000 to $199,999 income range is the most frequent in Colma, accounting for 23.0% of all households. In contrast, only 10 households (2.2%) fall into the less than $10,000 income bracket, making it the least populous group.
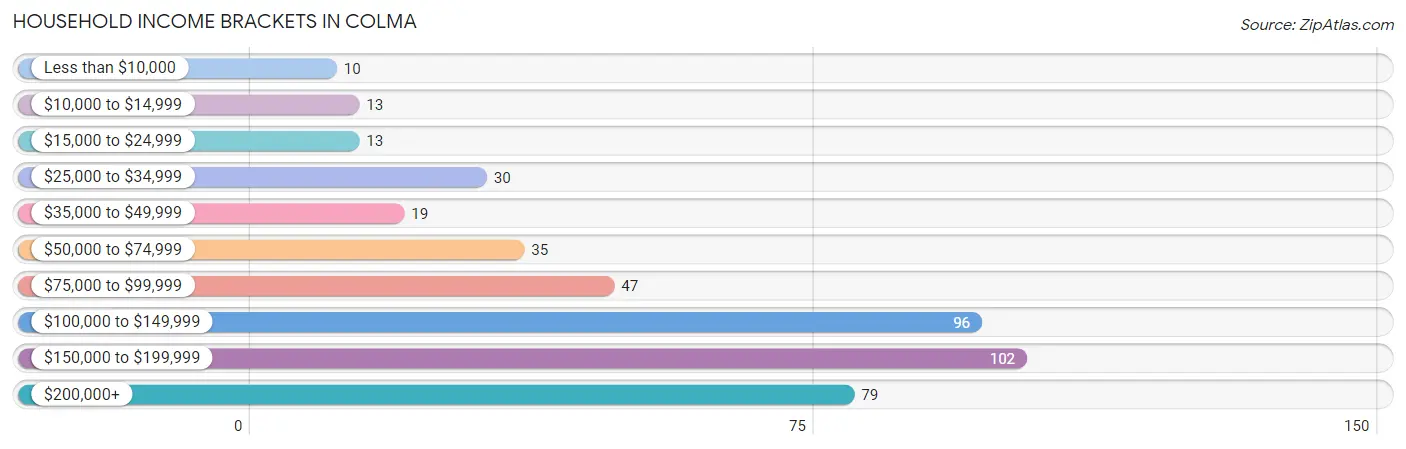
| Income Bracket | # Households | % Households |
| Less than $10,000 | 10 | 2.3% |
| $10,000 to $14,999 | 13 | 2.9% |
| $15,000 to $24,999 | 13 | 2.9% |
| $25,000 to $34,999 | 30 | 6.8% |
| $35,000 to $49,999 | 19 | 4.3% |
| $50,000 to $74,999 | 35 | 7.9% |
| $75,000 to $99,999 | 47 | 10.6% |
| $100,000 to $149,999 | 96 | 21.6% |
| $150,000 to $199,999 | 102 | 23.0% |
| $200,000+ | 79 | 17.8% |
Household Income by Householder Age in Colma
The median household income in Colma is $123,864, with the highest median household income of $161,250 found in the 45 to 64 years age bracket for the primary householder. A total of 208 households (46.9%) fall into this category. Meanwhile, the 15 to 24 years age bracket for the primary householder has the lowest median household income of $0, with 11 households (2.5%) in this group.
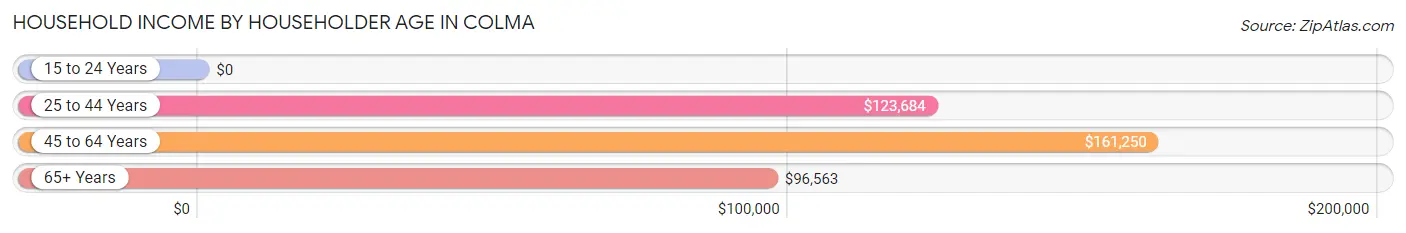
| Income Bracket | # Households | Median Income |
| 15 to 24 Years | 11 (2.5%) | $0 |
| 25 to 44 Years | 114 (25.7%) | $123,684 |
| 45 to 64 Years | 208 (46.9%) | $161,250 |
| 65+ Years | 111 (25.0%) | $96,563 |
| Total | 444 (100.0%) | $123,864 |
Poverty in Colma
Income Below Poverty by Sex and Age in Colma
With 8.6% poverty level for males and 6.7% for females among the residents of Colma, 12 to 14 year old males and 75 year old and over females are the most vulnerable to poverty, with 12 males (38.7%) and 18 females (26.1%) in their respective age groups living below the poverty level.
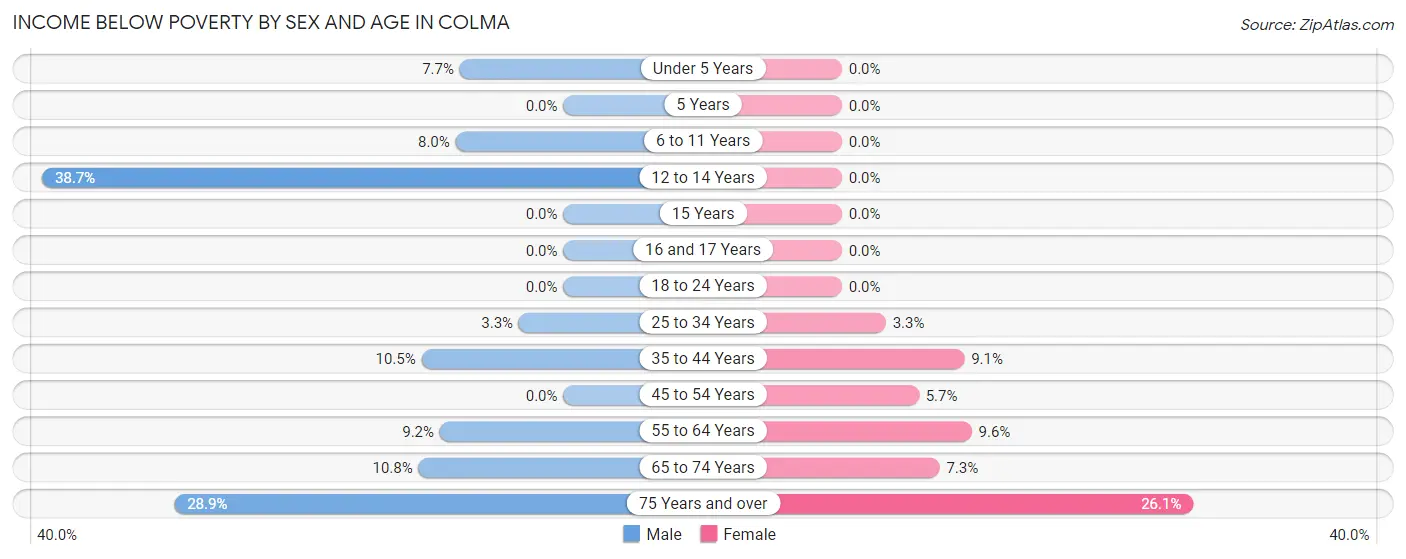
| Age Bracket | Male | Female |
| Under 5 Years | 4 (7.7%) | 0 (0.0%) |
| 5 Years | 0 (0.0%) | 0 (0.0%) |
| 6 to 11 Years | 4 (8.0%) | 0 (0.0%) |
| 12 to 14 Years | 12 (38.7%) | 0 (0.0%) |
| 15 Years | 0 (0.0%) | 0 (0.0%) |
| 16 and 17 Years | 0 (0.0%) | 0 (0.0%) |
| 18 to 24 Years | 0 (0.0%) | 0 (0.0%) |
| 25 to 34 Years | 3 (3.3%) | 3 (3.3%) |
| 35 to 44 Years | 6 (10.5%) | 6 (9.1%) |
| 45 to 54 Years | 0 (0.0%) | 4 (5.7%) |
| 55 to 64 Years | 10 (9.2%) | 8 (9.6%) |
| 65 to 74 Years | 10 (10.7%) | 5 (7.2%) |
| 75 Years and over | 13 (28.9%) | 18 (26.1%) |
| Total | 62 (8.6%) | 44 (6.7%) |
Income Above Poverty by Sex and Age in Colma
According to the poverty statistics in Colma, males aged 15 years and females aged under 5 years are the age groups that are most secure financially, with 100.0% of males and 100.0% of females in these age groups living above the poverty line.
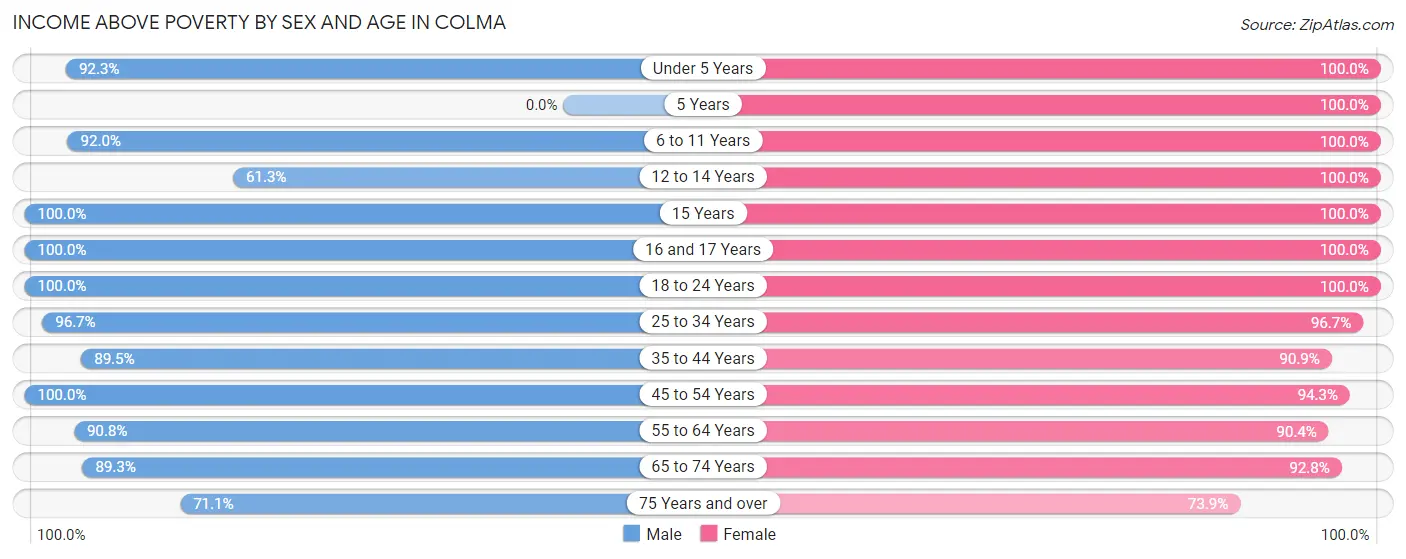
| Age Bracket | Male | Female |
| Under 5 Years | 48 (92.3%) | 7 (100.0%) |
| 5 Years | 0 (0.0%) | 7 (100.0%) |
| 6 to 11 Years | 46 (92.0%) | 56 (100.0%) |
| 12 to 14 Years | 19 (61.3%) | 11 (100.0%) |
| 15 Years | 5 (100.0%) | 15 (100.0%) |
| 16 and 17 Years | 28 (100.0%) | 39 (100.0%) |
| 18 to 24 Years | 40 (100.0%) | 70 (100.0%) |
| 25 to 34 Years | 88 (96.7%) | 89 (96.7%) |
| 35 to 44 Years | 51 (89.5%) | 60 (90.9%) |
| 45 to 54 Years | 120 (100.0%) | 66 (94.3%) |
| 55 to 64 Years | 99 (90.8%) | 75 (90.4%) |
| 65 to 74 Years | 83 (89.2%) | 64 (92.7%) |
| 75 Years and over | 32 (71.1%) | 51 (73.9%) |
| Total | 659 (91.4%) | 610 (93.3%) |
Income Below Poverty Among Married-Couple Families in Colma
The poverty statistics for married-couple families in Colma show that 4.9% or 10 of the total 206 families live below the poverty line. Families with no children have the highest poverty rate of 9.7%, comprising of 10 families. On the other hand, families with 1 or 2 children have the lowest poverty rate of 0.0%, which includes 0 families.
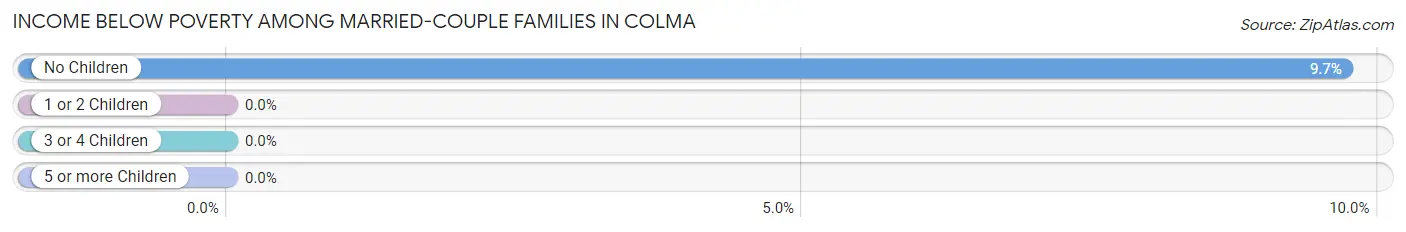
| Children | Above Poverty | Below Poverty |
| No Children | 93 (90.3%) | 10 (9.7%) |
| 1 or 2 Children | 79 (100.0%) | 0 (0.0%) |
| 3 or 4 Children | 14 (100.0%) | 0 (0.0%) |
| 5 or more Children | 10 (100.0%) | 0 (0.0%) |
| Total | 196 (95.2%) | 10 (4.9%) |
Income Below Poverty Among Single-Parent Households in Colma
According to the poverty data in Colma, 10.3% or 3 single-father households and 12.8% or 10 single-mother households are living below the poverty line. Among single-father households, those with no children have the highest poverty rate, with 3 households (12.0%) experiencing poverty. Likewise, among single-mother households, those with 1 or 2 children have the highest poverty rate, with 10 households (25.0%) falling below the poverty line.
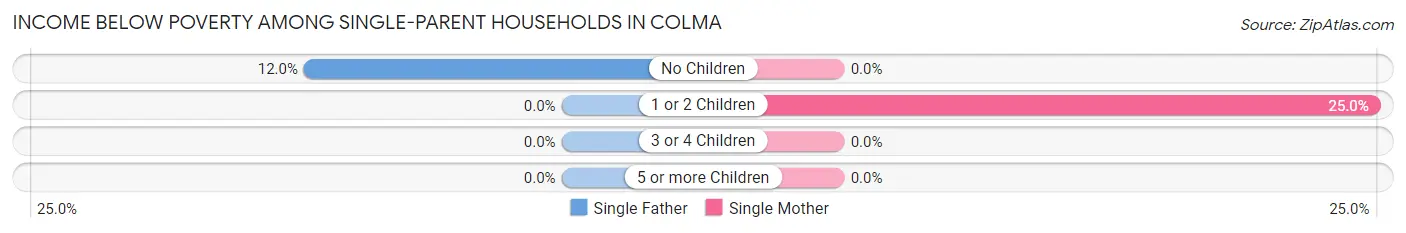
| Children | Single Father | Single Mother |
| No Children | 3 (12.0%) | 0 (0.0%) |
| 1 or 2 Children | 0 (0.0%) | 10 (25.0%) |
| 3 or 4 Children | 0 (0.0%) | 0 (0.0%) |
| 5 or more Children | 0 (0.0%) | 0 (0.0%) |
| Total | 3 (10.3%) | 10 (12.8%) |
Income Below Poverty Among Married-Couple vs Single-Parent Households in Colma
The poverty data for Colma shows that 10 of the married-couple family households (4.9%) and 13 of the single-parent households (12.1%) are living below the poverty level. Within the married-couple family households, those with no children have the highest poverty rate, with 10 households (9.7%) falling below the poverty line. Among the single-parent households, those with 1 or 2 children have the highest poverty rate, with 10 household (22.7%) living below poverty.
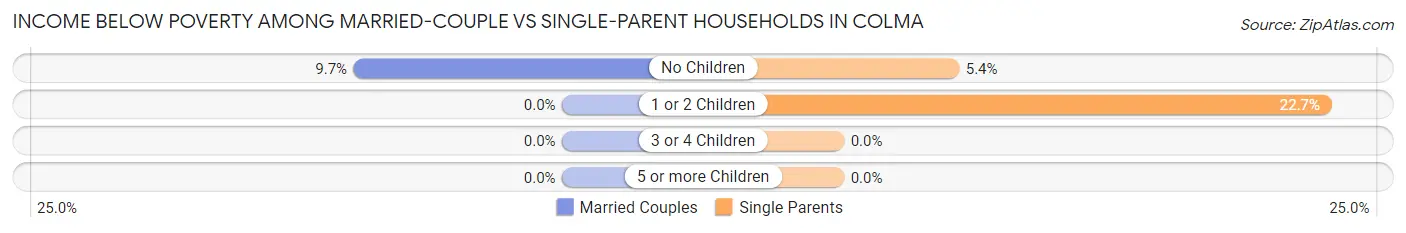
| Children | Married-Couple Families | Single-Parent Households |
| No Children | 10 (9.7%) | 3 (5.4%) |
| 1 or 2 Children | 0 (0.0%) | 10 (22.7%) |
| 3 or 4 Children | 0 (0.0%) | 0 (0.0%) |
| 5 or more Children | 0 (0.0%) | 0 (0.0%) |
| Total | 10 (4.9%) | 13 (12.1%) |
Race in Colma
The most populous races in Colma are Hispanic or Latino (560 | 40.7%), Asian (512 | 37.2%), and White / Caucasian (479 | 34.8%).
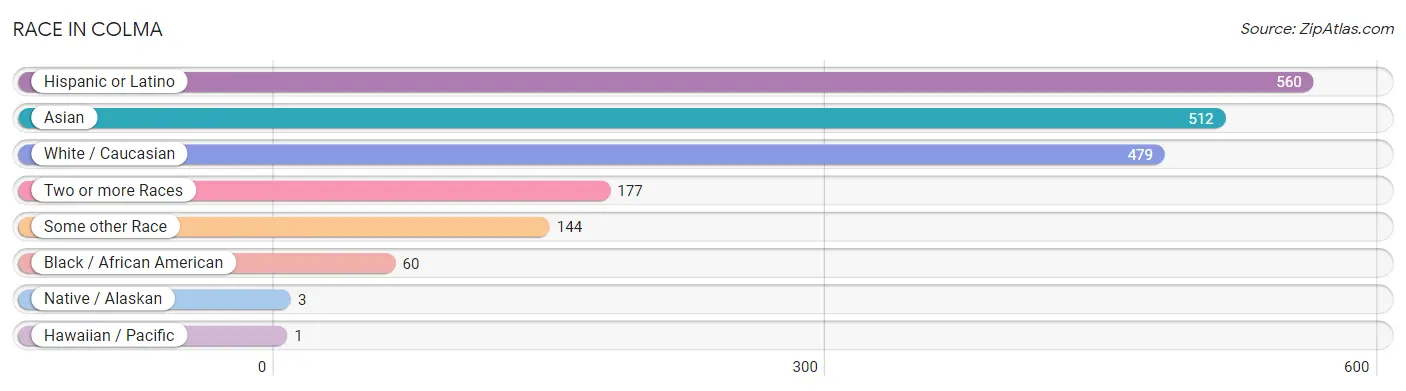
| Race | # Population | % Population |
| Asian | 512 | 37.2% |
| Black / African American | 60 | 4.4% |
| Hawaiian / Pacific | 1 | 0.1% |
| Hispanic or Latino | 560 | 40.7% |
| Native / Alaskan | 3 | 0.2% |
| White / Caucasian | 479 | 34.8% |
| Two or more Races | 177 | 12.9% |
| Some other Race | 144 | 10.5% |
| Total | 1,376 | 100.0% |
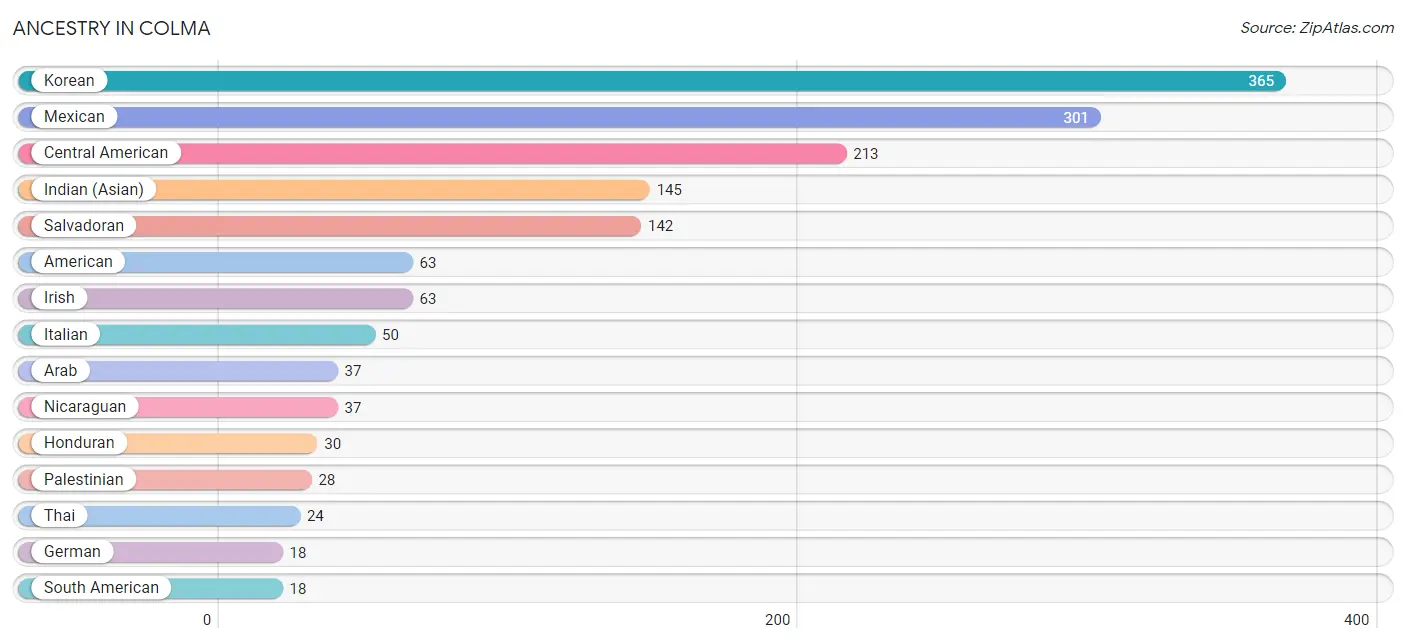
Ancestry in Colma
The most populous ancestries reported in Colma are Korean (365 | 26.5%), Mexican (301 | 21.9%), Central American (213 | 15.5%), Indian (Asian) (145 | 10.5%), and Salvadoran (142 | 10.3%), together accounting for 84.7% of all Colma residents.
| Ancestry | # Population | % Population |
| American | 63 | 4.6% |
| Apache | 3 | 0.2% |
| Arab | 37 | 2.7% |
| British | 3 | 0.2% |
| Canadian | 6 | 0.4% |
| Central American | 213 | 15.5% |
| Chilean | 3 | 0.2% |
| Colombian | 2 | 0.2% |
| Costa Rican | 4 | 0.3% |
| Croatian | 3 | 0.2% |
| Czech | 2 | 0.2% |
| Dutch | 8 | 0.6% |
| Ecuadorian | 10 | 0.7% |
| English | 4 | 0.3% |
| European | 9 | 0.6% |
| French | 6 | 0.4% |
| German | 18 | 1.3% |
| Honduran | 30 | 2.2% |
| Indian (Asian) | 145 | 10.5% |
| Irish | 63 | 4.6% |
| Iroquois | 10 | 0.7% |
| Italian | 50 | 3.6% |
| Korean | 365 | 26.5% |
| Mexican | 301 | 21.9% |
| Native Hawaiian | 16 | 1.2% |
| Nicaraguan | 37 | 2.7% |
| Palestinian | 28 | 2.0% |
| Polish | 9 | 0.6% |
| Portuguese | 8 | 0.6% |
| Puerto Rican | 4 | 0.3% |
| Salvadoran | 142 | 10.3% |
| Samoan | 15 | 1.1% |
| Scandinavian | 3 | 0.2% |
| Scotch-Irish | 6 | 0.4% |
| Scottish | 2 | 0.2% |
| South American | 18 | 1.3% |
| South American Indian | 10 | 0.7% |
| Spaniard | 4 | 0.3% |
| Sri Lankan | 8 | 0.6% |
| Swedish | 3 | 0.2% |
| Thai | 24 | 1.7% | View All 41 Rows |
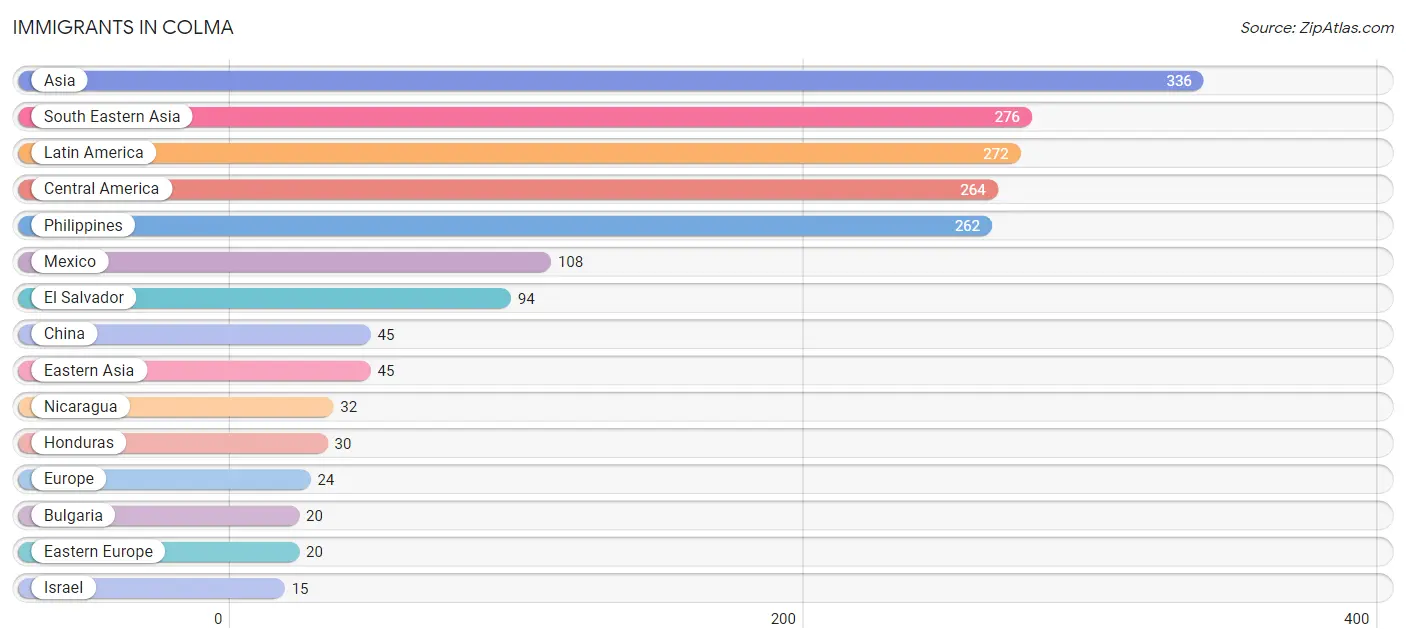
Immigrants in Colma
The most numerous immigrant groups reported in Colma came from Asia (336 | 24.4%), South Eastern Asia (276 | 20.1%), Latin America (272 | 19.8%), Central America (264 | 19.2%), and Philippines (262 | 19.0%), together accounting for 102.5% of all Colma residents.
| Immigration Origin | # Population | % Population |
| Asia | 336 | 24.4% |
| Bulgaria | 20 | 1.5% |
| Canada | 9 | 0.6% |
| Caribbean | 5 | 0.4% |
| Central America | 264 | 19.2% |
| Chile | 3 | 0.2% |
| China | 45 | 3.3% |
| Eastern Asia | 45 | 3.3% |
| Eastern Europe | 20 | 1.5% |
| El Salvador | 94 | 6.8% |
| Europe | 24 | 1.7% |
| Honduras | 30 | 2.2% |
| Hong Kong | 5 | 0.4% |
| Israel | 15 | 1.1% |
| Latin America | 272 | 19.8% |
| Mexico | 108 | 7.9% |
| Nicaragua | 32 | 2.3% |
| Philippines | 262 | 19.0% |
| South America | 3 | 0.2% |
| South Eastern Asia | 276 | 20.1% |
| Southern Europe | 4 | 0.3% |
| Trinidad and Tobago | 5 | 0.4% |
| Vietnam | 6 | 0.4% |
| Western Asia | 15 | 1.1% | View All 24 Rows |
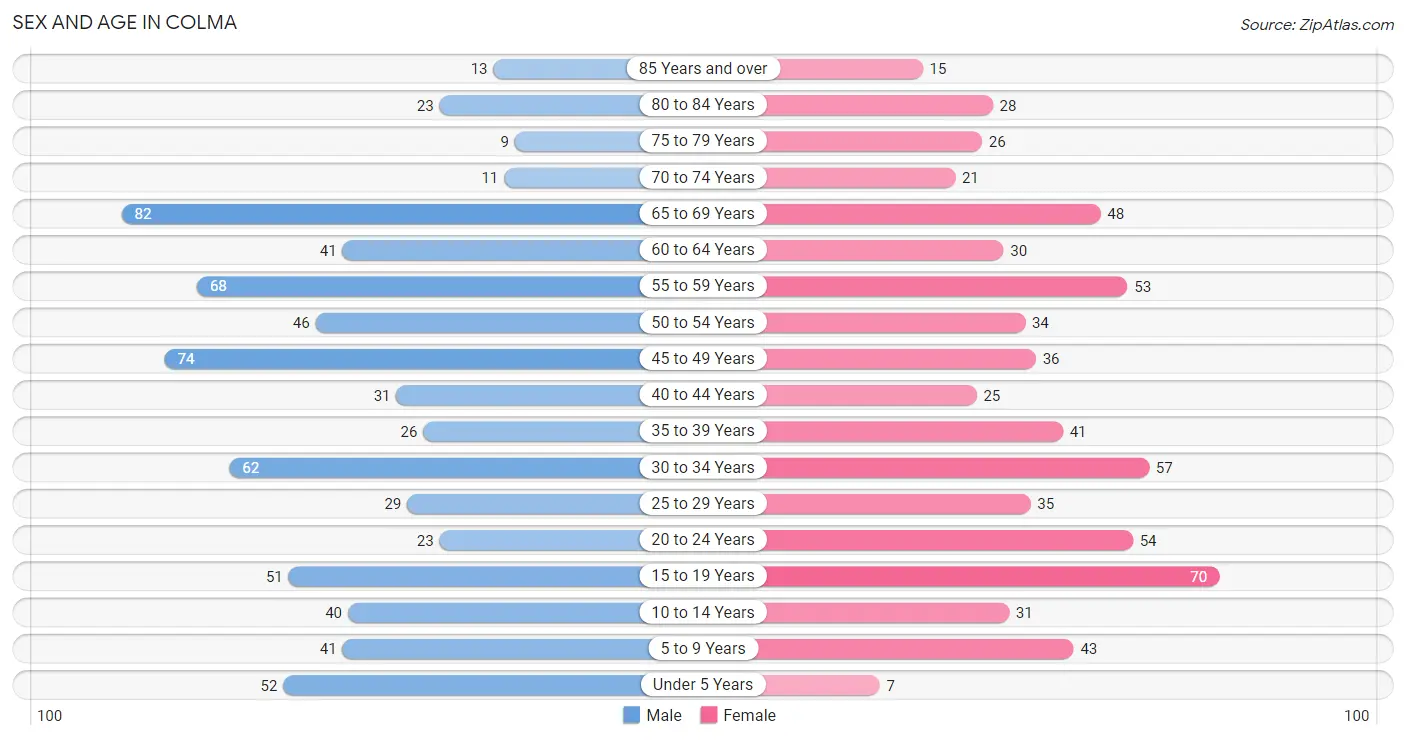
Sex and Age in Colma
Sex and Age in Colma
The most populous age groups in Colma are 65 to 69 Years (82 | 11.4%) for men and 15 to 19 Years (70 | 10.7%) for women.
| Age Bracket | Male | Female |
| Under 5 Years | 52 (7.2%) | 7 (1.1%) |
| 5 to 9 Years | 41 (5.7%) | 43 (6.6%) |
| 10 to 14 Years | 40 (5.5%) | 31 (4.7%) |
| 15 to 19 Years | 51 (7.1%) | 70 (10.7%) |
| 20 to 24 Years | 23 (3.2%) | 54 (8.3%) |
| 25 to 29 Years | 29 (4.0%) | 35 (5.3%) |
| 30 to 34 Years | 62 (8.6%) | 57 (8.7%) |
| 35 to 39 Years | 26 (3.6%) | 41 (6.3%) |
| 40 to 44 Years | 31 (4.3%) | 25 (3.8%) |
| 45 to 49 Years | 74 (10.2%) | 36 (5.5%) |
| 50 to 54 Years | 46 (6.4%) | 34 (5.2%) |
| 55 to 59 Years | 68 (9.4%) | 53 (8.1%) |
| 60 to 64 Years | 41 (5.7%) | 30 (4.6%) |
| 65 to 69 Years | 82 (11.4%) | 48 (7.3%) |
| 70 to 74 Years | 11 (1.5%) | 21 (3.2%) |
| 75 to 79 Years | 9 (1.3%) | 26 (4.0%) |
| 80 to 84 Years | 23 (3.2%) | 28 (4.3%) |
| 85 Years and over | 13 (1.8%) | 15 (2.3%) |
| Total | 722 (100.0%) | 654 (100.0%) |
Families and Households in Colma
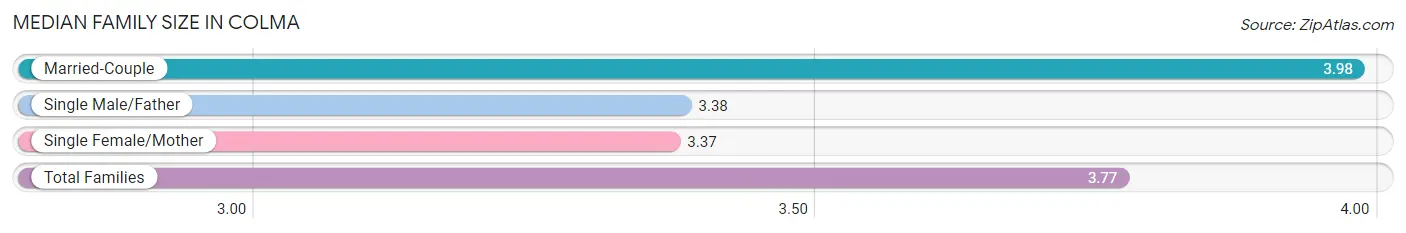
Median Family Size in Colma
The median family size in Colma is 3.77 persons per family, with married-couple families (206 | 65.8%) accounting for the largest median family size of 3.98 persons per family. On the other hand, single female/mother families (78 | 24.9%) represent the smallest median family size with 3.37 persons per family.
| Family Type | # Families | Family Size |
| Married-Couple | 206 (65.8%) | 3.98 |
| Single Male/Father | 29 (9.3%) | 3.38 |
| Single Female/Mother | 78 (24.9%) | 3.37 |
| Total Families | 313 (100.0%) | 3.77 |
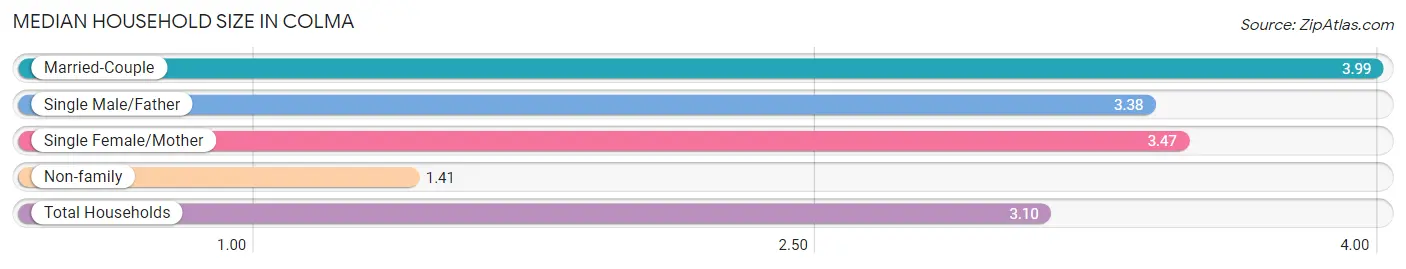
Median Household Size in Colma
The median household size in Colma is 3.10 persons per household, with married-couple households (206 | 46.4%) accounting for the largest median household size of 3.99 persons per household. non-family households (131 | 29.5%) represent the smallest median household size with 1.41 persons per household.
| Household Type | # Households | Household Size |
| Married-Couple | 206 (46.4%) | 3.99 |
| Single Male/Father | 29 (6.5%) | 3.38 |
| Single Female/Mother | 78 (17.6%) | 3.47 |
| Non-family | 131 (29.5%) | 1.41 |
| Total Households | 444 (100.0%) | 3.10 |
Household Size by Marriage Status in Colma
Out of a total of 444 households in Colma, 313 (70.5%) are family households, while 131 (29.5%) are nonfamily households. The most numerous type of family households are 2-person households, comprising 95, and the most common type of nonfamily households are 1-person households, comprising 98.
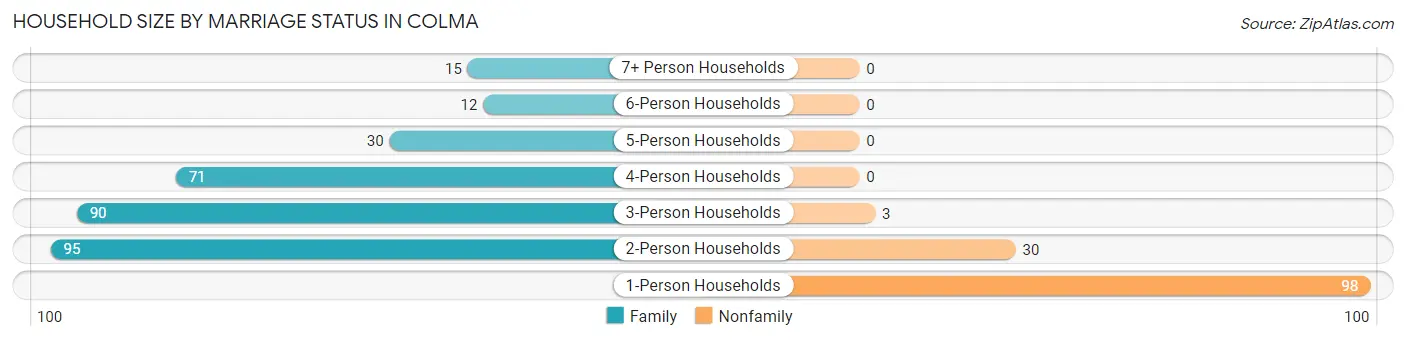
| Household Size | Family Households | Nonfamily Households |
| 1-Person Households | - | 98 (22.1%) |
| 2-Person Households | 95 (21.4%) | 30 (6.8%) |
| 3-Person Households | 90 (20.3%) | 3 (0.7%) |
| 4-Person Households | 71 (16.0%) | 0 (0.0%) |
| 5-Person Households | 30 (6.8%) | 0 (0.0%) |
| 6-Person Households | 12 (2.7%) | 0 (0.0%) |
| 7+ Person Households | 15 (3.4%) | 0 (0.0%) |
| Total | 313 (70.5%) | 131 (29.5%) |
Female Fertility in Colma
Fertility by Age in Colma
Average fertility rate in Colma is 38.0 births per 1,000 women. Women in the age bracket of 20 to 34 years have the highest fertility rate with 55.0 births per 1,000 women. Women in the age bracket of 20 to 34 years acount for 61.5% of all women with births.
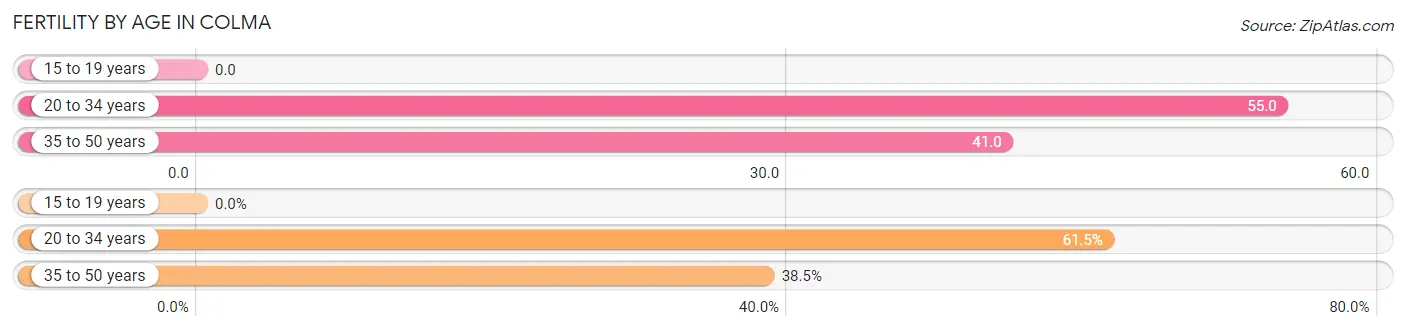
| Age Bracket | Women with Births | Births / 1,000 Women |
| 15 to 19 years | 0 (0.0%) | 0.0 |
| 20 to 34 years | 8 (61.5%) | 55.0 |
| 35 to 50 years | 5 (38.5%) | 41.0 |
| Total | 13 (100.0%) | 38.0 |
Fertility by Age by Marriage Status in Colma
38.5% of women with births (13) in Colma are married. The highest percentage of unmarried women with births falls into 20 to 34 years age bracket with 100.0% of them unmarried at the time of birth, while the lowest percentage of unmarried women with births belong to 35 to 50 years age bracket with 0.0% of them unmarried.
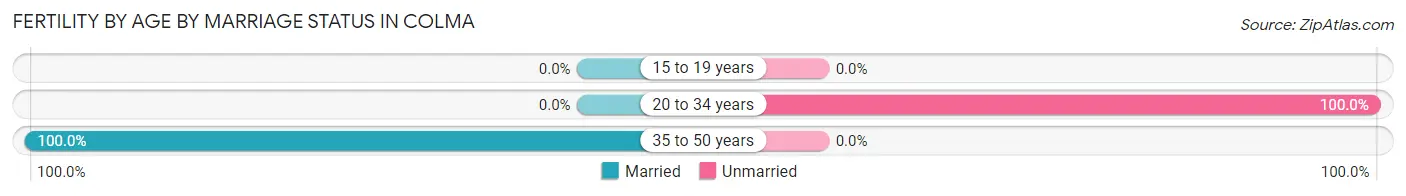
| Age Bracket | Married | Unmarried |
| 15 to 19 years | 0 (0.0%) | 0 (0.0%) |
| 20 to 34 years | 0 (0.0%) | 8 (100.0%) |
| 35 to 50 years | 5 (100.0%) | 0 (0.0%) |
| Total | 5 (38.5%) | 8 (61.5%) |
Fertility by Education in Colma
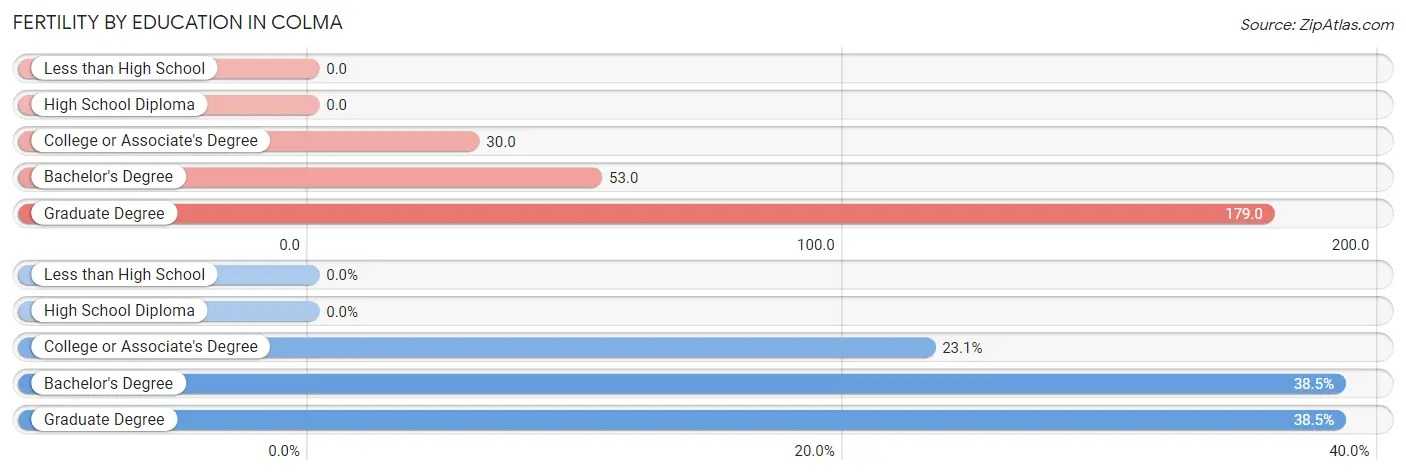
| Educational Attainment | Women with Births | Births / 1,000 Women |
| Less than High School | 0 (0.0%) | 0.0 |
| High School Diploma | 0 (0.0%) | 0.0 |
| College or Associate's Degree | 3 (23.1%) | 30.0 |
| Bachelor's Degree | 5 (38.5%) | 53.0 |
| Graduate Degree | 5 (38.5%) | 179.0 |
| Total | 13 (100.0%) | 38.0 |
Fertility by Education by Marriage Status in Colma
61.5% of women with births in Colma are unmarried. Women with the educational attainment of bachelor's degree are most likely to be married with 100.0% of them married at childbirth, while women with the educational attainment of college or associate's degree are least likely to be married with 100.0% of them unmarried at childbirth.
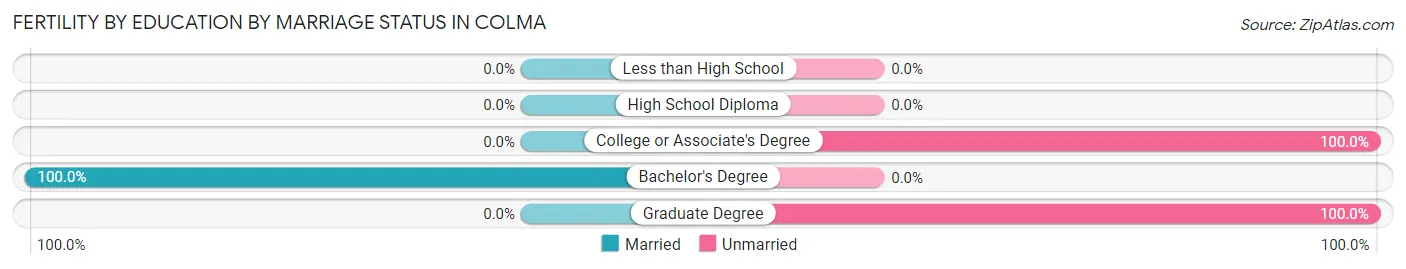
| Educational Attainment | Married | Unmarried |
| Less than High School | 0 (0.0%) | 0 (0.0%) |
| High School Diploma | 0 (0.0%) | 0 (0.0%) |
| College or Associate's Degree | 0 (0.0%) | 3 (100.0%) |
| Bachelor's Degree | 5 (100.0%) | 0 (0.0%) |
| Graduate Degree | 0 (0.0%) | 5 (100.0%) |
| Total | 5 (38.5%) | 8 (61.5%) |
Employment Characteristics in Colma
Employment by Class of Employer in Colma
Among the 694 employed individuals in Colma, private company employees (391 | 56.3%), not-for-profit organizations (90 | 13.0%), and local government employees (59 | 8.5%) make up the most common classes of employment.
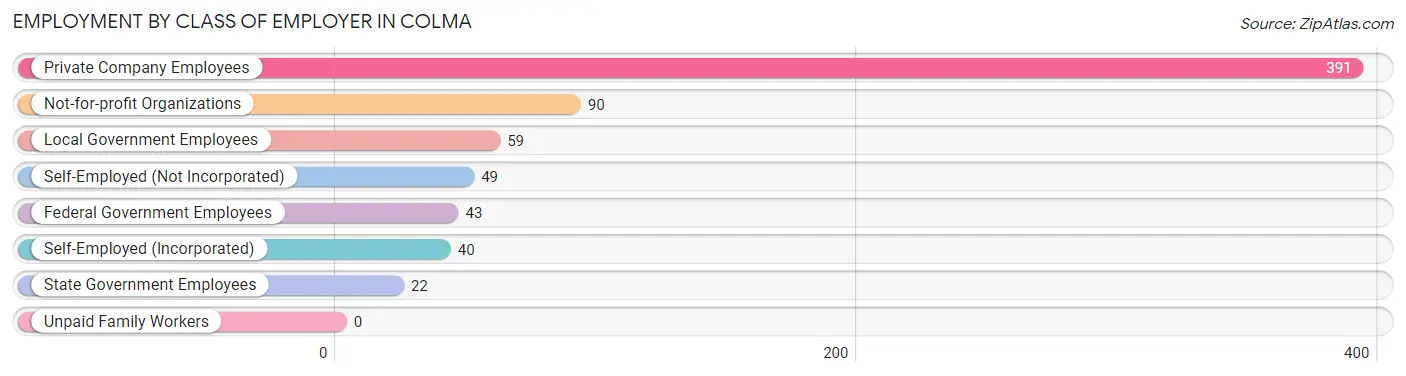
| Employer Class | # Employees | % Employees |
| Private Company Employees | 391 | 56.3% |
| Self-Employed (Incorporated) | 40 | 5.8% |
| Self-Employed (Not Incorporated) | 49 | 7.1% |
| Not-for-profit Organizations | 90 | 13.0% |
| Local Government Employees | 59 | 8.5% |
| State Government Employees | 22 | 3.2% |
| Federal Government Employees | 43 | 6.2% |
| Unpaid Family Workers | 0 | 0.0% |
| Total | 694 | 100.0% |
Employment Status by Age in Colma
According to the labor force statistics for Colma, out of the total population over 16 years of age (1,142), 68.5% or 782 individuals are in the labor force, with 6.9% or 54 of them unemployed. The age group with the highest labor force participation rate is 20 to 24 years, with 100.0% or 77 individuals in the labor force. Within the labor force, the 20 to 24 years age range has the highest percentage of unemployed individuals, with 32.5% or 25 of them being unemployed.
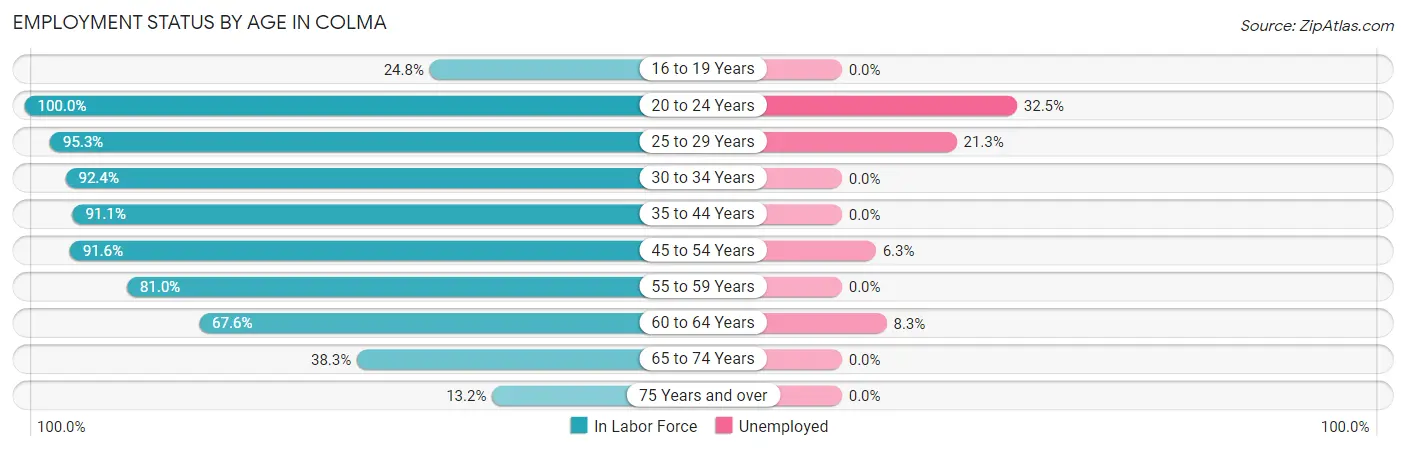
| Age Bracket | In Labor Force | Unemployed |
| 16 to 19 Years | 25 (24.8%) | 0 (0.0%) |
| 20 to 24 Years | 77 (100.0%) | 25 (32.5%) |
| 25 to 29 Years | 61 (95.3%) | 13 (21.3%) |
| 30 to 34 Years | 110 (92.4%) | 0 (0.0%) |
| 35 to 44 Years | 112 (91.1%) | 0 (0.0%) |
| 45 to 54 Years | 174 (91.6%) | 11 (6.3%) |
| 55 to 59 Years | 98 (81.0%) | 0 (0.0%) |
| 60 to 64 Years | 48 (67.6%) | 4 (8.3%) |
| 65 to 74 Years | 62 (38.3%) | 0 (0.0%) |
| 75 Years and over | 15 (13.2%) | 0 (0.0%) |
| Total | 782 (68.5%) | 54 (6.9%) |
Employment Status by Educational Attainment in Colma
According to labor force statistics for Colma, 87.6% of individuals (603) out of the total population between 25 and 64 years of age (688) are in the labor force, with 4.8% or 29 of them being unemployed. The group with the highest labor force participation rate are those with the educational attainment of college / associate degree, with 92.7% or 215 individuals in the labor force. Within the labor force, individuals with high school diploma education have the highest percentage of unemployment, with 37.8% or 35 of them being unemployed.
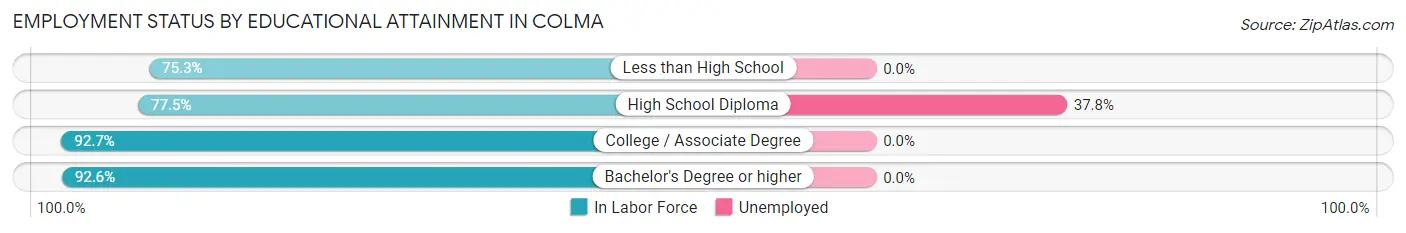
| Educational Attainment | In Labor Force | Unemployed |
| Less than High School | 70 (75.3%) | 0 (0.0%) |
| High School Diploma | 93 (77.5%) | 45 (37.8%) |
| College / Associate Degree | 215 (92.7%) | 0 (0.0%) |
| Bachelor's Degree or higher | 225 (92.6%) | 0 (0.0%) |
| Total | 603 (87.6%) | 33 (4.8%) |
Employment Occupations by Sex in Colma
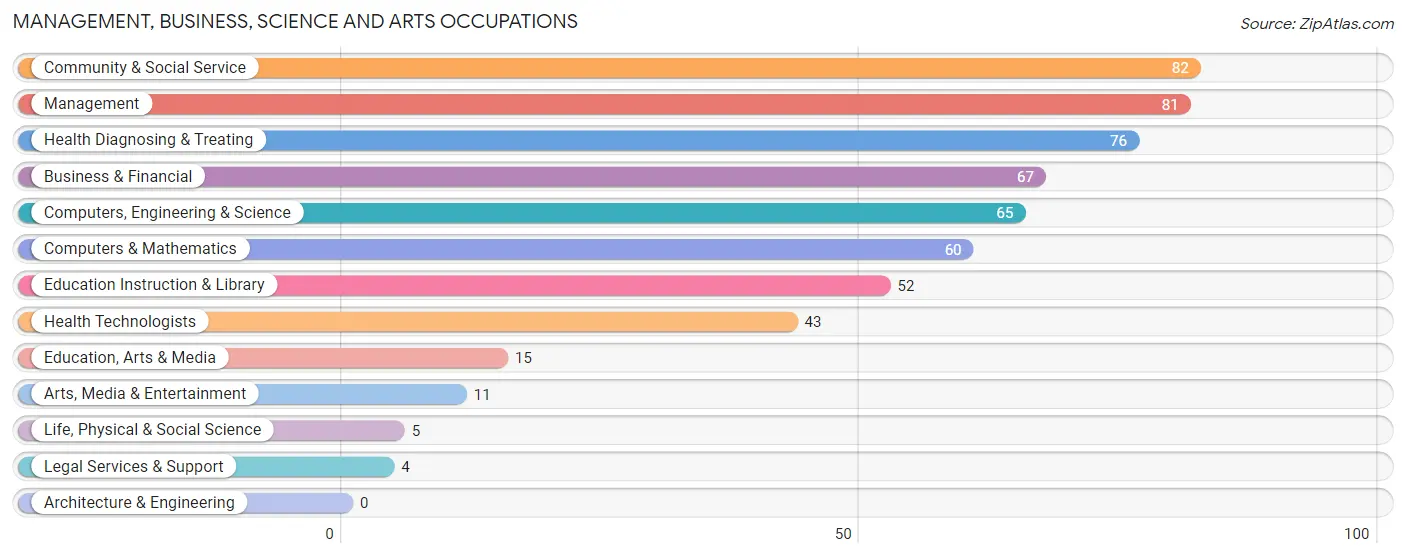
Management, Business, Science and Arts Occupations
The most common Management, Business, Science and Arts occupations in Colma are Community & Social Service (82 | 11.6%), Management (81 | 11.4%), Health Diagnosing & Treating (76 | 10.7%), Business & Financial (67 | 9.4%), and Computers, Engineering & Science (65 | 9.1%).
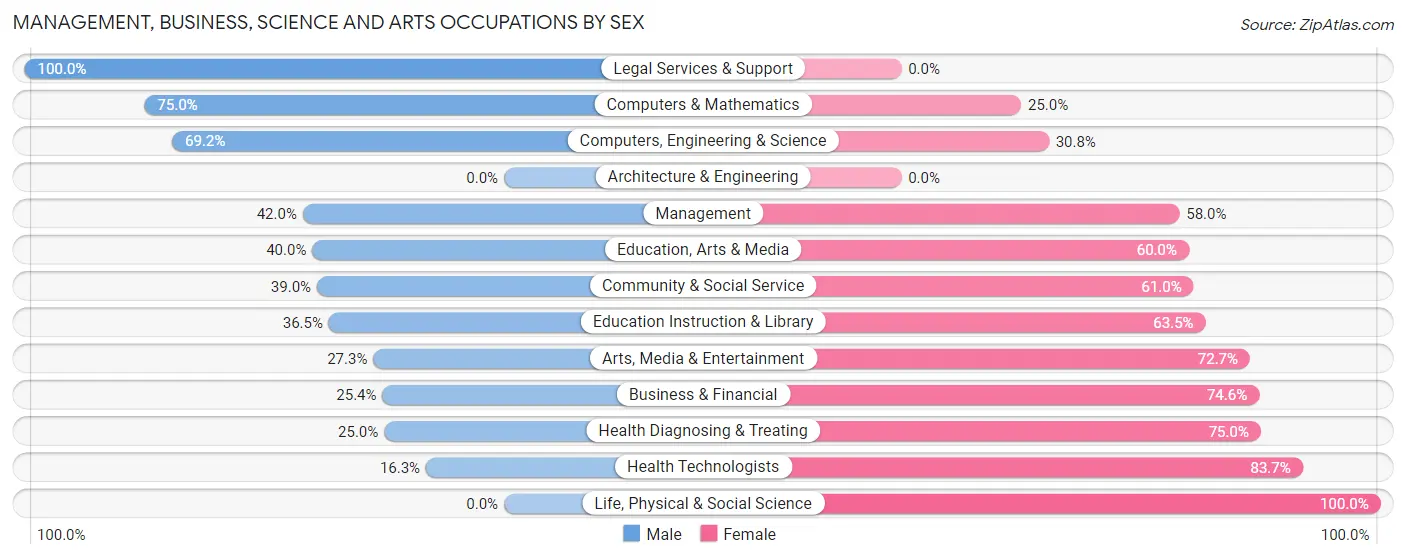
Management, Business, Science and Arts Occupations by Sex
Within the Management, Business, Science and Arts occupations in Colma, the most male-oriented occupations are Legal Services & Support (100.0%), Computers & Mathematics (75.0%), and Computers, Engineering & Science (69.2%), while the most female-oriented occupations are Life, Physical & Social Science (100.0%), Health Technologists (83.7%), and Health Diagnosing & Treating (75.0%).
| Occupation | Male | Female |
| Management | 34 (42.0%) | 47 (58.0%) |
| Business & Financial | 17 (25.4%) | 50 (74.6%) |
| Computers, Engineering & Science | 45 (69.2%) | 20 (30.8%) |
| Computers & Mathematics | 45 (75.0%) | 15 (25.0%) |
| Architecture & Engineering | 0 (0.0%) | 0 (0.0%) |
| Life, Physical & Social Science | 0 (0.0%) | 5 (100.0%) |
| Community & Social Service | 32 (39.0%) | 50 (61.0%) |
| Education, Arts & Media | 6 (40.0%) | 9 (60.0%) |
| Legal Services & Support | 4 (100.0%) | 0 (0.0%) |
| Education Instruction & Library | 19 (36.5%) | 33 (63.5%) |
| Arts, Media & Entertainment | 3 (27.3%) | 8 (72.7%) |
| Health Diagnosing & Treating | 19 (25.0%) | 57 (75.0%) |
| Health Technologists | 7 (16.3%) | 36 (83.7%) |
| Total (Category) | 147 (39.6%) | 224 (60.4%) |
| Total (Overall) | 352 (49.6%) | 358 (50.4%) |
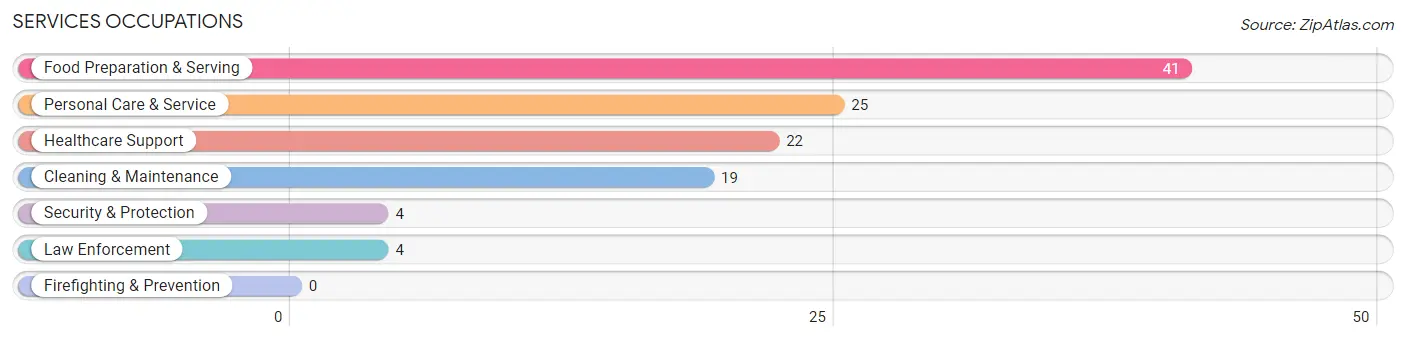
Services Occupations
The most common Services occupations in Colma are Food Preparation & Serving (41 | 5.8%), Personal Care & Service (25 | 3.5%), Healthcare Support (22 | 3.1%), Cleaning & Maintenance (19 | 2.7%), and Security & Protection (4 | 0.6%).
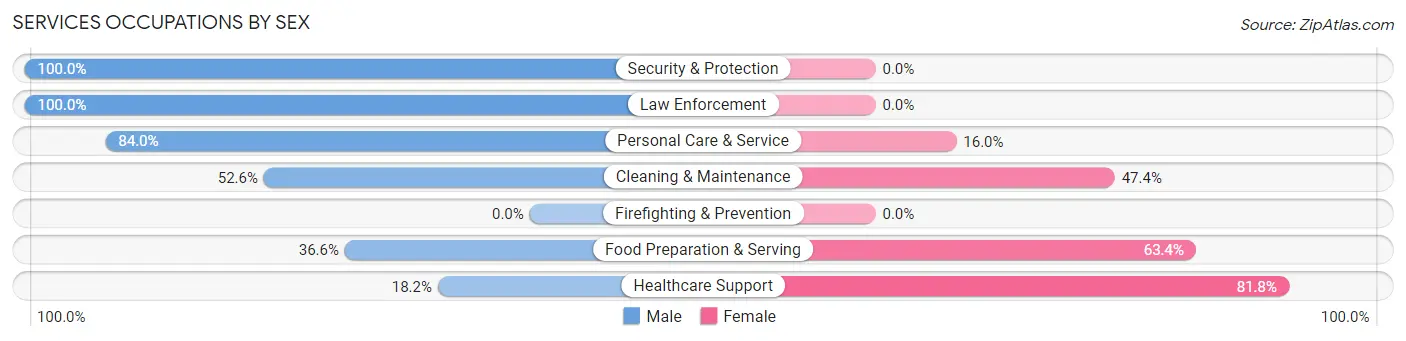
Services Occupations by Sex
Within the Services occupations in Colma, the most male-oriented occupations are Security & Protection (100.0%), Law Enforcement (100.0%), and Personal Care & Service (84.0%), while the most female-oriented occupations are Healthcare Support (81.8%), Food Preparation & Serving (63.4%), and Cleaning & Maintenance (47.4%).
| Occupation | Male | Female |
| Healthcare Support | 4 (18.2%) | 18 (81.8%) |
| Security & Protection | 4 (100.0%) | 0 (0.0%) |
| Firefighting & Prevention | 0 (0.0%) | 0 (0.0%) |
| Law Enforcement | 4 (100.0%) | 0 (0.0%) |
| Food Preparation & Serving | 15 (36.6%) | 26 (63.4%) |
| Cleaning & Maintenance | 10 (52.6%) | 9 (47.4%) |
| Personal Care & Service | 21 (84.0%) | 4 (16.0%) |
| Total (Category) | 54 (48.6%) | 57 (51.3%) |
| Total (Overall) | 352 (49.6%) | 358 (50.4%) |
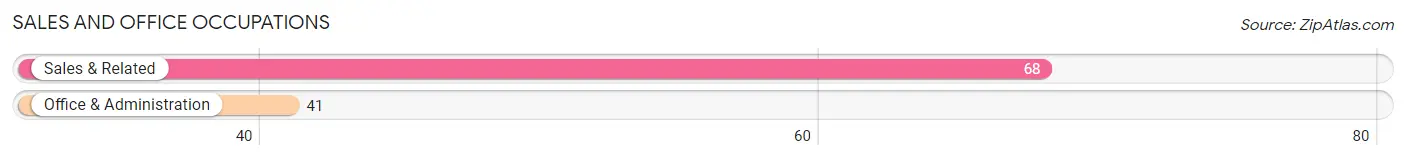
Sales and Office Occupations
The most common Sales and Office occupations in Colma are Sales & Related (68 | 9.6%), and Office & Administration (41 | 5.8%).
Sales and Office Occupations by Sex
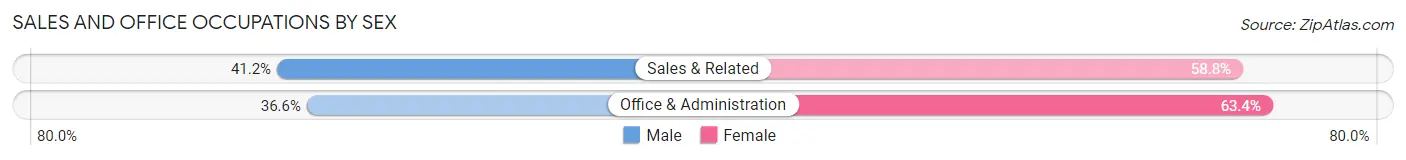
| Occupation | Male | Female |
| Sales & Related | 28 (41.2%) | 40 (58.8%) |
| Office & Administration | 15 (36.6%) | 26 (63.4%) |
| Total (Category) | 43 (39.5%) | 66 (60.6%) |
| Total (Overall) | 352 (49.6%) | 358 (50.4%) |
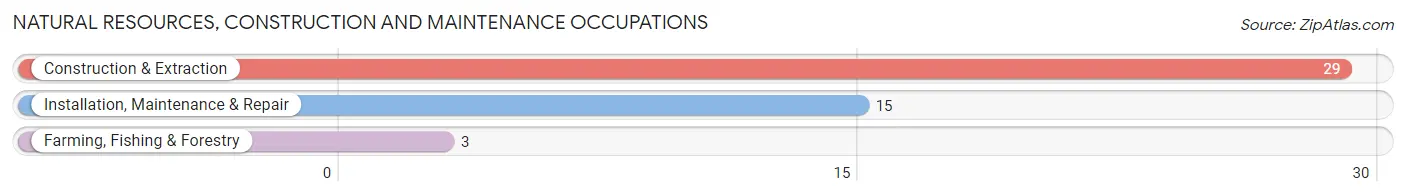
Natural Resources, Construction and Maintenance Occupations
The most common Natural Resources, Construction and Maintenance occupations in Colma are Construction & Extraction (29 | 4.1%), Installation, Maintenance & Repair (15 | 2.1%), and Farming, Fishing & Forestry (3 | 0.4%).
Natural Resources, Construction and Maintenance Occupations by Sex
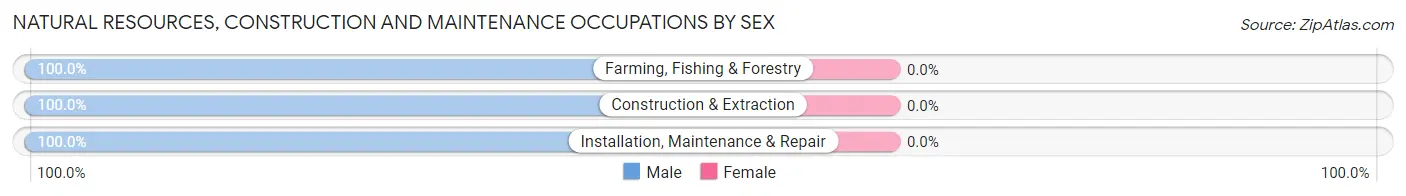
| Occupation | Male | Female |
| Farming, Fishing & Forestry | 3 (100.0%) | 0 (0.0%) |
| Construction & Extraction | 29 (100.0%) | 0 (0.0%) |
| Installation, Maintenance & Repair | 15 (100.0%) | 0 (0.0%) |
| Total (Category) | 47 (100.0%) | 0 (0.0%) |
| Total (Overall) | 352 (49.6%) | 358 (50.4%) |
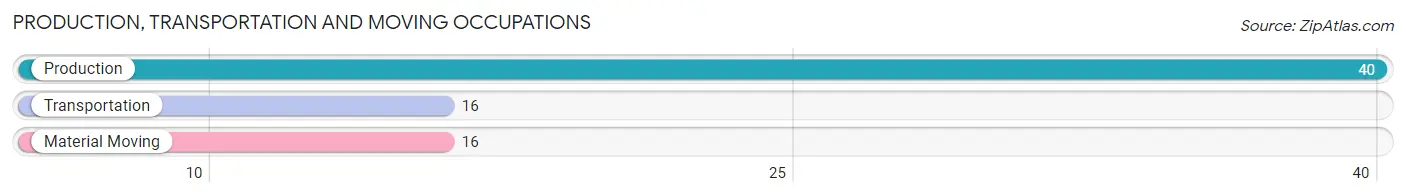
Production, Transportation and Moving Occupations
The most common Production, Transportation and Moving occupations in Colma are Production (40 | 5.6%), Transportation (16 | 2.2%), and Material Moving (16 | 2.2%).
Production, Transportation and Moving Occupations by Sex
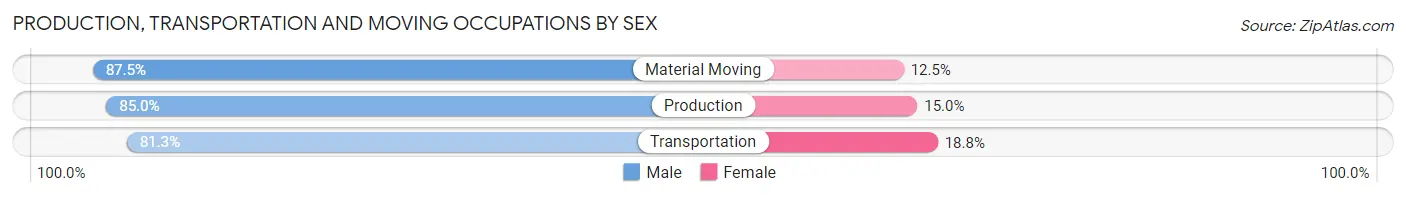
| Occupation | Male | Female |
| Production | 34 (85.0%) | 6 (15.0%) |
| Transportation | 13 (81.2%) | 3 (18.8%) |
| Material Moving | 14 (87.5%) | 2 (12.5%) |
| Total (Category) | 61 (84.7%) | 11 (15.3%) |
| Total (Overall) | 352 (49.6%) | 358 (50.4%) |
Employment Industries by Sex in Colma
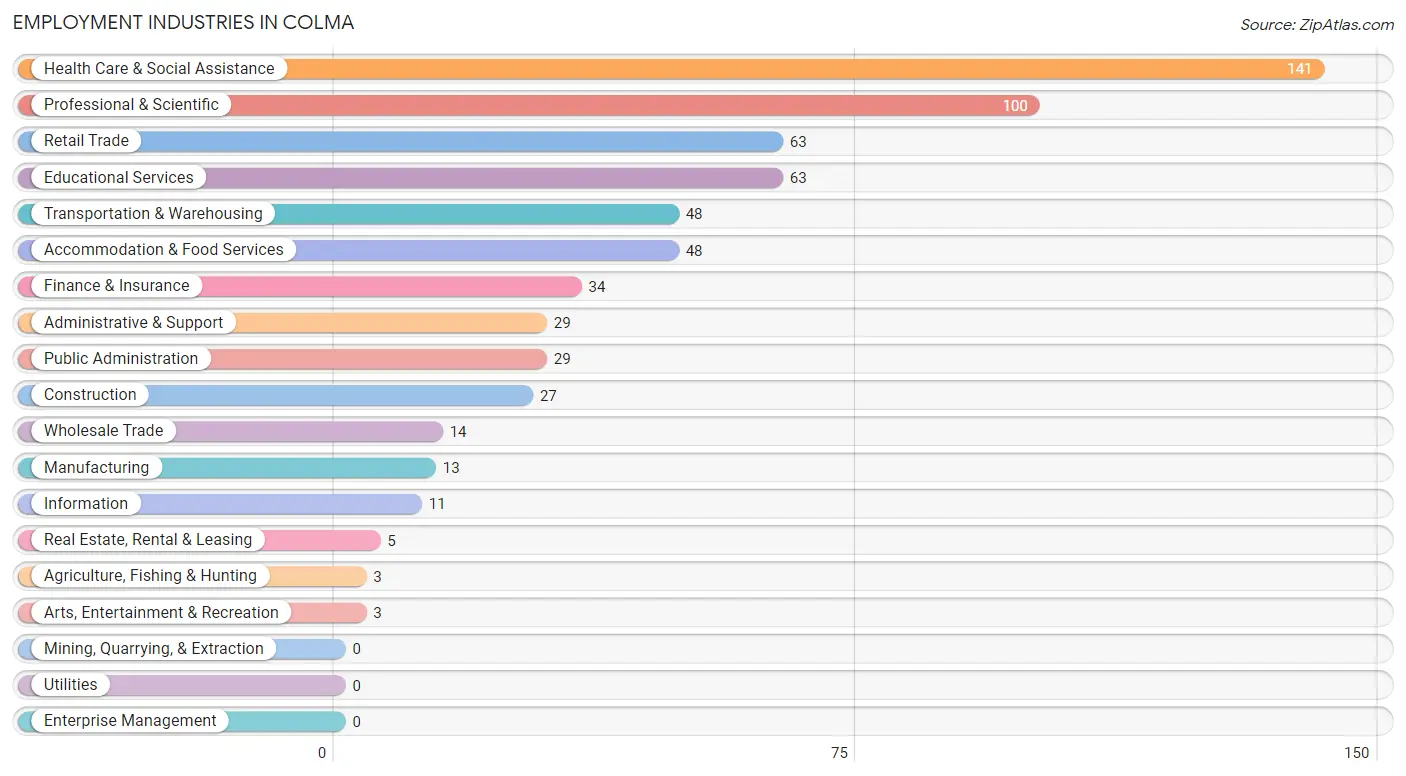
Employment Industries in Colma
The major employment industries in Colma include Health Care & Social Assistance (141 | 19.9%), Professional & Scientific (100 | 14.1%), Retail Trade (63 | 8.9%), Educational Services (63 | 8.9%), and Transportation & Warehousing (48 | 6.8%).
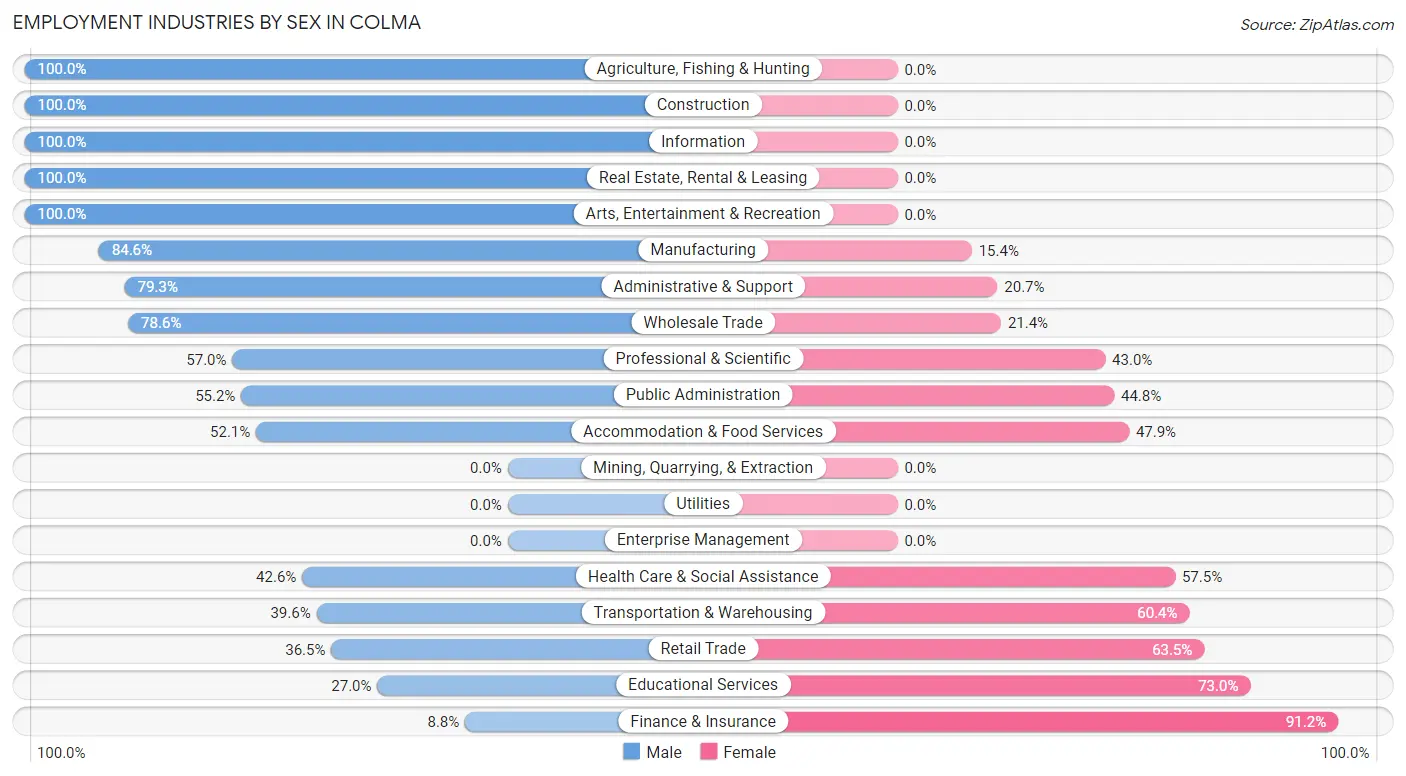
Employment Industries by Sex in Colma
The Colma industries that see more men than women are Agriculture, Fishing & Hunting (100.0%), Construction (100.0%), and Information (100.0%), whereas the industries that tend to have a higher number of women are Finance & Insurance (91.2%), Educational Services (73.0%), and Retail Trade (63.5%).
| Industry | Male | Female |
| Agriculture, Fishing & Hunting | 3 (100.0%) | 0 (0.0%) |
| Mining, Quarrying, & Extraction | 0 (0.0%) | 0 (0.0%) |
| Construction | 27 (100.0%) | 0 (0.0%) |
| Manufacturing | 11 (84.6%) | 2 (15.4%) |
| Wholesale Trade | 11 (78.6%) | 3 (21.4%) |
| Retail Trade | 23 (36.5%) | 40 (63.5%) |
| Transportation & Warehousing | 19 (39.6%) | 29 (60.4%) |
| Utilities | 0 (0.0%) | 0 (0.0%) |
| Information | 11 (100.0%) | 0 (0.0%) |
| Finance & Insurance | 3 (8.8%) | 31 (91.2%) |
| Real Estate, Rental & Leasing | 5 (100.0%) | 0 (0.0%) |
| Professional & Scientific | 57 (57.0%) | 43 (43.0%) |
| Enterprise Management | 0 (0.0%) | 0 (0.0%) |
| Administrative & Support | 23 (79.3%) | 6 (20.7%) |
| Educational Services | 17 (27.0%) | 46 (73.0%) |
| Health Care & Social Assistance | 60 (42.5%) | 81 (57.5%) |
| Arts, Entertainment & Recreation | 3 (100.0%) | 0 (0.0%) |
| Accommodation & Food Services | 25 (52.1%) | 23 (47.9%) |
| Public Administration | 16 (55.2%) | 13 (44.8%) |
| Total | 352 (49.6%) | 358 (50.4%) |
Education in Colma
School Enrollment in Colma
The most common levels of schooling among the 319 students in Colma are high school (121 | 37.9%), elementary school (74 | 23.2%), and middle school (45 | 14.1%).
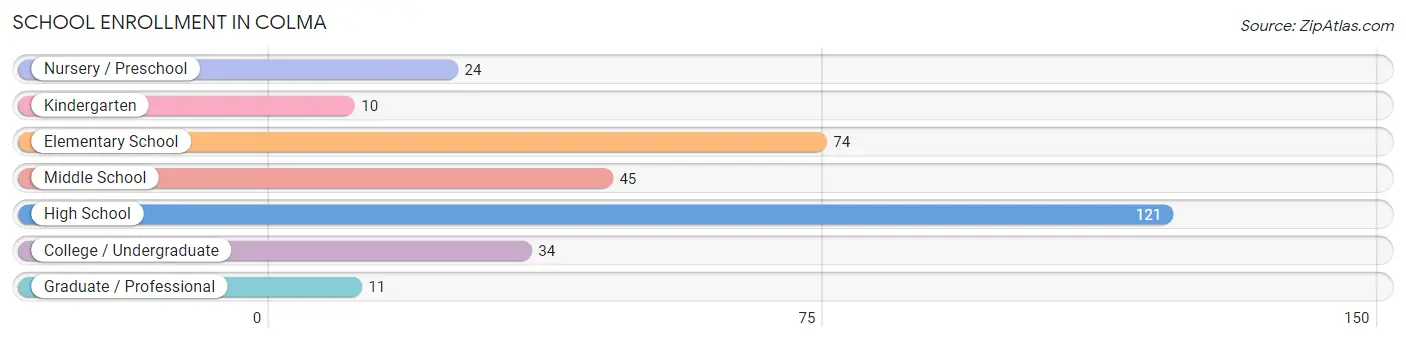
| School Level | # Students | % Students |
| Nursery / Preschool | 24 | 7.5% |
| Kindergarten | 10 | 3.1% |
| Elementary School | 74 | 23.2% |
| Middle School | 45 | 14.1% |
| High School | 121 | 37.9% |
| College / Undergraduate | 34 | 10.7% |
| Graduate / Professional | 11 | 3.5% |
| Total | 319 | 100.0% |
School Enrollment by Age by Funding Source in Colma
Out of a total of 319 students who are enrolled in schools in Colma, 58 (18.2%) attend a private institution, while the remaining 261 (81.8%) are enrolled in public schools. The age group of 3 to 4 year olds has the highest likelihood of being enrolled in private schools, with 7 (41.2% in the age bracket) enrolled. Conversely, the age group of 5 to 9 year old has the lowest likelihood of being enrolled in a private school, with 80 (95.2% in the age bracket) attending a public institution.
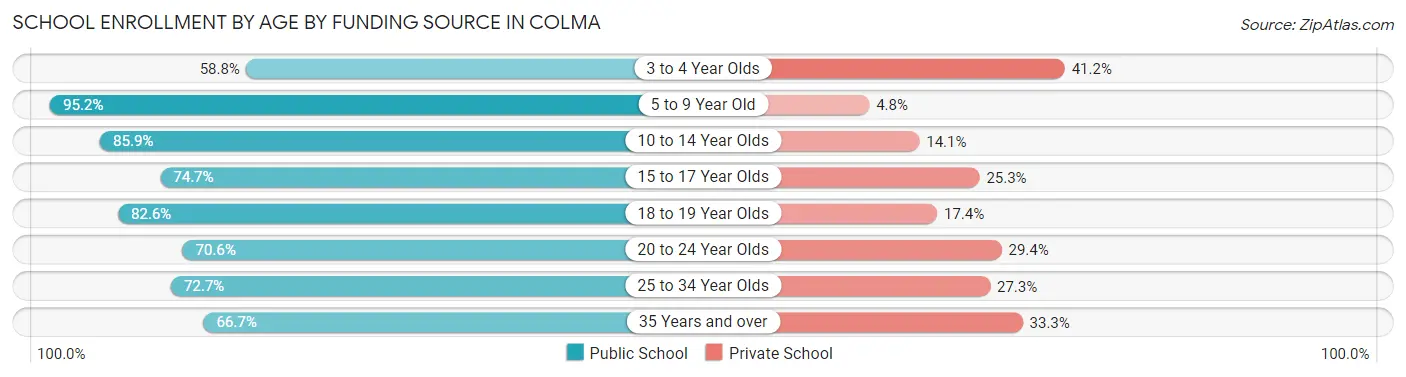
| Age Bracket | Public School | Private School |
| 3 to 4 Year Olds | 10 (58.8%) | 7 (41.2%) |
| 5 to 9 Year Old | 80 (95.2%) | 4 (4.8%) |
| 10 to 14 Year Olds | 61 (85.9%) | 10 (14.1%) |
| 15 to 17 Year Olds | 65 (74.7%) | 22 (25.3%) |
| 18 to 19 Year Olds | 19 (82.6%) | 4 (17.4%) |
| 20 to 24 Year Olds | 12 (70.6%) | 5 (29.4%) |
| 25 to 34 Year Olds | 8 (72.7%) | 3 (27.3%) |
| 35 Years and over | 6 (66.7%) | 3 (33.3%) |
| Total | 261 (81.8%) | 58 (18.2%) |
Educational Attainment by Field of Study in Colma
Business (73 | 21.1%), science & technology (61 | 17.6%), social sciences (56 | 16.2%), bio, nature & agricultural (34 | 9.8%), and liberal arts & history (25 | 7.2%) are the most common fields of study among 346 individuals in Colma who have obtained a bachelor's degree or higher.
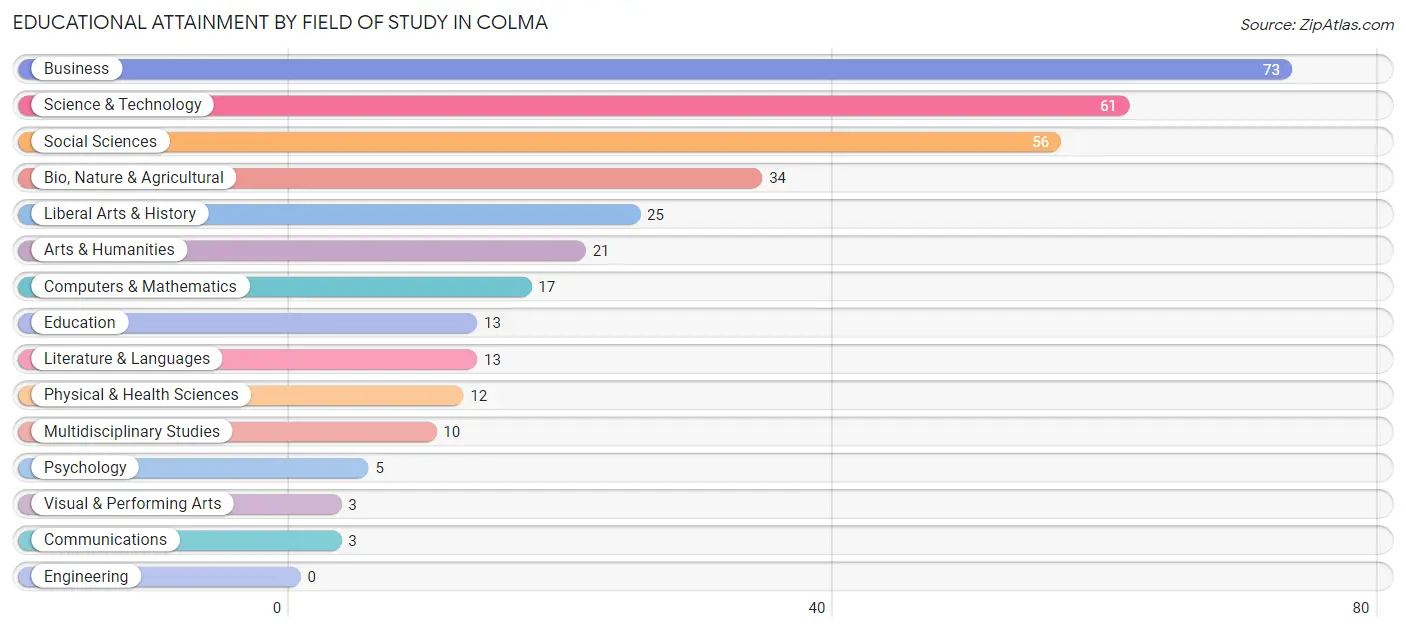
| Field of Study | # Graduates | % Graduates |
| Computers & Mathematics | 17 | 4.9% |
| Bio, Nature & Agricultural | 34 | 9.8% |
| Physical & Health Sciences | 12 | 3.5% |
| Psychology | 5 | 1.5% |
| Social Sciences | 56 | 16.2% |
| Engineering | 0 | 0.0% |
| Multidisciplinary Studies | 10 | 2.9% |
| Science & Technology | 61 | 17.6% |
| Business | 73 | 21.1% |
| Education | 13 | 3.8% |
| Literature & Languages | 13 | 3.8% |
| Liberal Arts & History | 25 | 7.2% |
| Visual & Performing Arts | 3 | 0.9% |
| Communications | 3 | 0.9% |
| Arts & Humanities | 21 | 6.1% |
| Total | 346 | 100.0% |
Transportation & Commute in Colma
Vehicle Availability by Sex in Colma
The most prevalent vehicle ownership categories in Colma are males with 3 vehicles (111, accounting for 32.6%) and females with 3 vehicles (138, making up 31.4%).
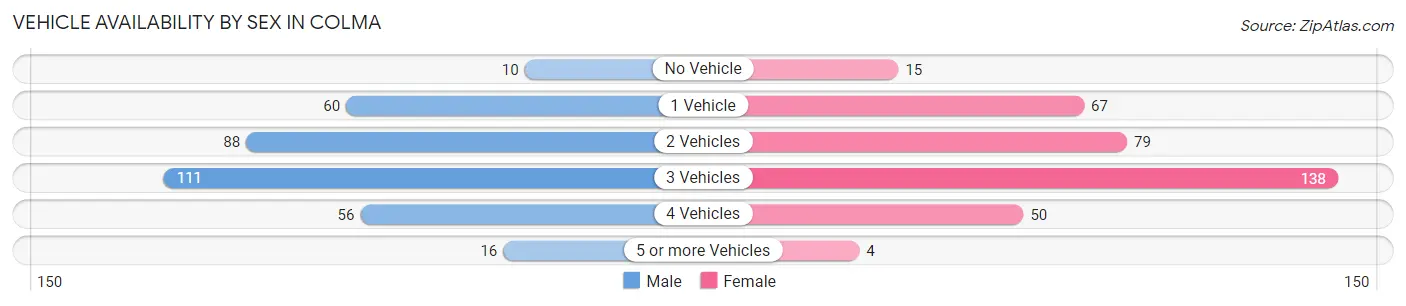
| Vehicles Available | Male | Female |
| No Vehicle | 10 (2.9%) | 15 (4.3%) |
| 1 Vehicle | 60 (17.6%) | 67 (19.0%) |
| 2 Vehicles | 88 (25.8%) | 79 (22.4%) |
| 3 Vehicles | 111 (32.6%) | 138 (39.1%) |
| 4 Vehicles | 56 (16.4%) | 50 (14.2%) |
| 5 or more Vehicles | 16 (4.7%) | 4 (1.1%) |
| Total | 341 (100.0%) | 353 (100.0%) |
Commute Time in Colma
The most frequently occuring commute durations in Colma are 30 to 34 minutes (113 commuters, 20.1%), 20 to 24 minutes (79 commuters, 14.1%), and 60 to 89 minutes (72 commuters, 12.8%).
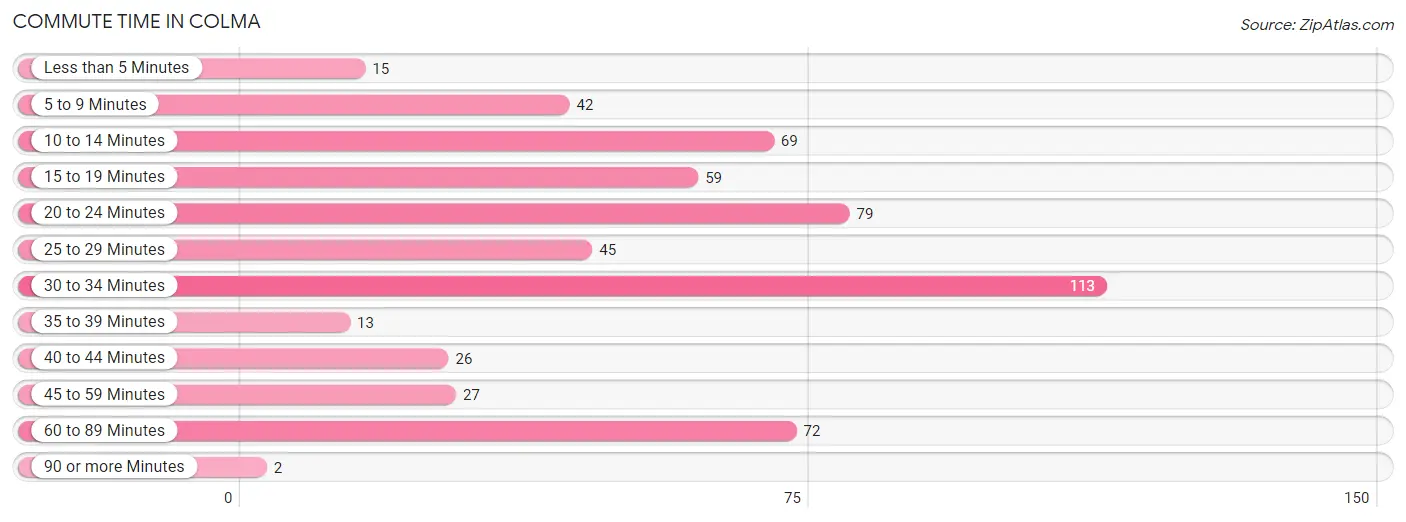
| Commute Time | # Commuters | % Commuters |
| Less than 5 Minutes | 15 | 2.7% |
| 5 to 9 Minutes | 42 | 7.5% |
| 10 to 14 Minutes | 69 | 12.3% |
| 15 to 19 Minutes | 59 | 10.5% |
| 20 to 24 Minutes | 79 | 14.1% |
| 25 to 29 Minutes | 45 | 8.0% |
| 30 to 34 Minutes | 113 | 20.1% |
| 35 to 39 Minutes | 13 | 2.3% |
| 40 to 44 Minutes | 26 | 4.6% |
| 45 to 59 Minutes | 27 | 4.8% |
| 60 to 89 Minutes | 72 | 12.8% |
| 90 or more Minutes | 2 | 0.4% |
Commute Time by Sex in Colma
The most common commute times in Colma are 30 to 34 minutes (53 commuters, 18.3%) for males and 30 to 34 minutes (60 commuters, 22.0%) for females.
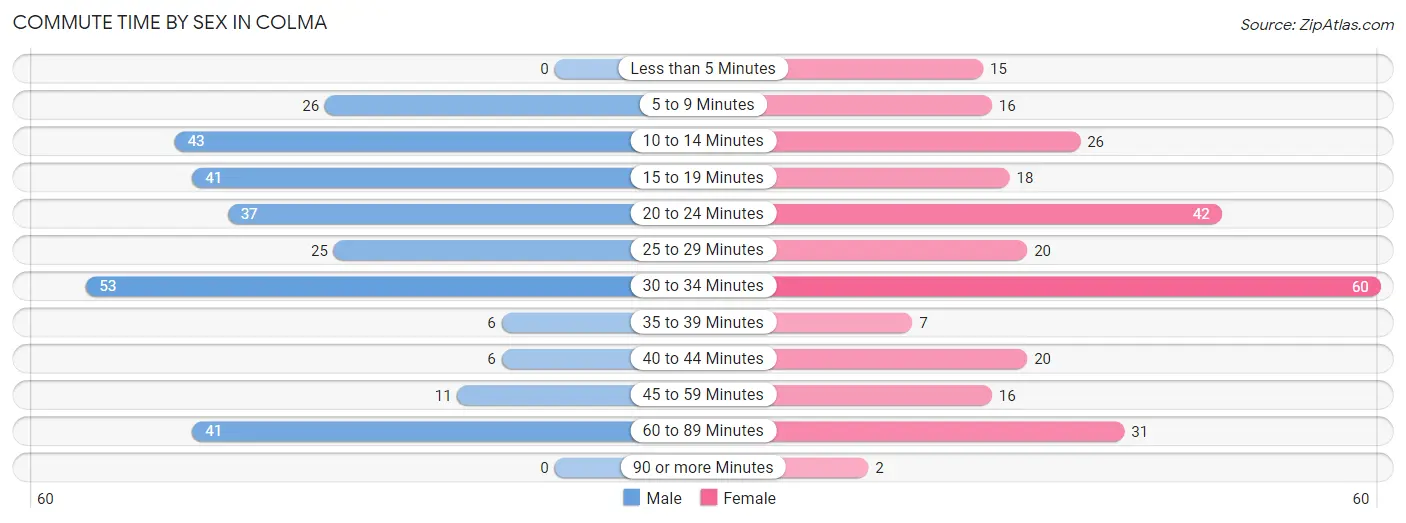
| Commute Time | Male | Female |
| Less than 5 Minutes | 0 (0.0%) | 15 (5.5%) |
| 5 to 9 Minutes | 26 (9.0%) | 16 (5.9%) |
| 10 to 14 Minutes | 43 (14.9%) | 26 (9.5%) |
| 15 to 19 Minutes | 41 (14.2%) | 18 (6.6%) |
| 20 to 24 Minutes | 37 (12.8%) | 42 (15.4%) |
| 25 to 29 Minutes | 25 (8.6%) | 20 (7.3%) |
| 30 to 34 Minutes | 53 (18.3%) | 60 (22.0%) |
| 35 to 39 Minutes | 6 (2.1%) | 7 (2.6%) |
| 40 to 44 Minutes | 6 (2.1%) | 20 (7.3%) |
| 45 to 59 Minutes | 11 (3.8%) | 16 (5.9%) |
| 60 to 89 Minutes | 41 (14.2%) | 31 (11.4%) |
| 90 or more Minutes | 0 (0.0%) | 2 (0.7%) |
Time of Departure to Work by Sex in Colma
The most frequent times of departure to work in Colma are 7:00 AM to 7:29 AM (65, 22.5%) for males and 8:00 AM to 8:29 AM (59, 21.6%) for females.
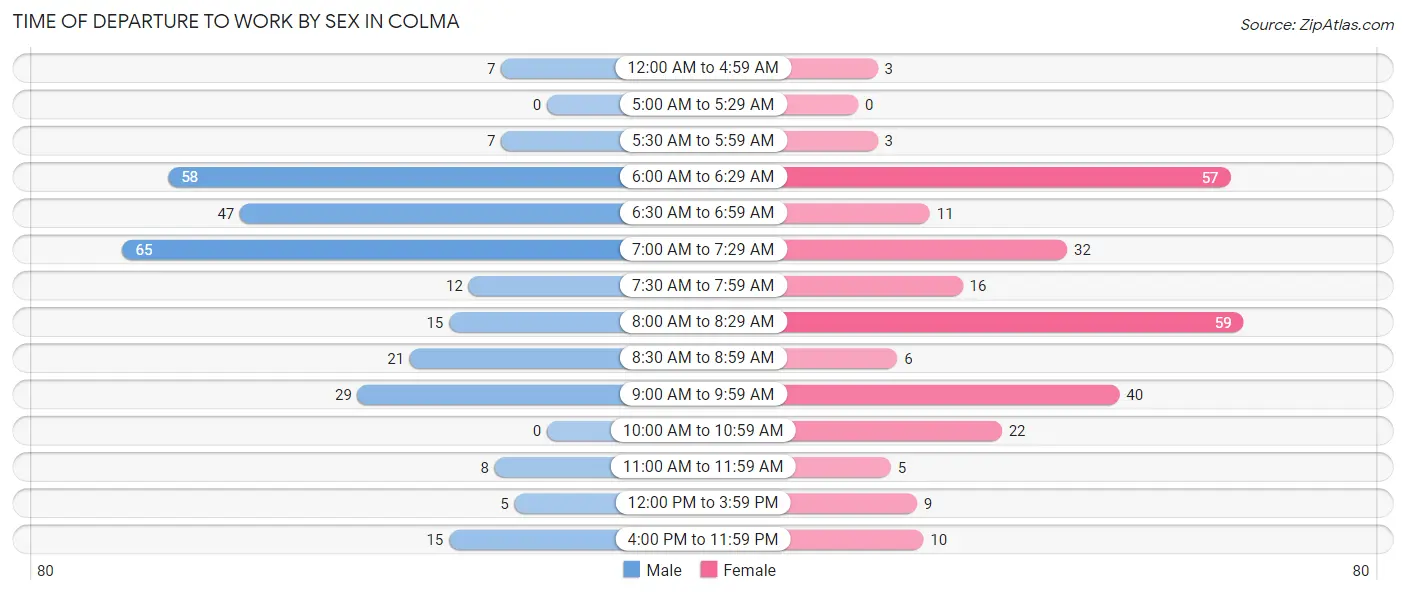
| Time of Departure | Male | Female |
| 12:00 AM to 4:59 AM | 7 (2.4%) | 3 (1.1%) |
| 5:00 AM to 5:29 AM | 0 (0.0%) | 0 (0.0%) |
| 5:30 AM to 5:59 AM | 7 (2.4%) | 3 (1.1%) |
| 6:00 AM to 6:29 AM | 58 (20.1%) | 57 (20.9%) |
| 6:30 AM to 6:59 AM | 47 (16.3%) | 11 (4.0%) |
| 7:00 AM to 7:29 AM | 65 (22.5%) | 32 (11.7%) |
| 7:30 AM to 7:59 AM | 12 (4.2%) | 16 (5.9%) |
| 8:00 AM to 8:29 AM | 15 (5.2%) | 59 (21.6%) |
| 8:30 AM to 8:59 AM | 21 (7.3%) | 6 (2.2%) |
| 9:00 AM to 9:59 AM | 29 (10.0%) | 40 (14.6%) |
| 10:00 AM to 10:59 AM | 0 (0.0%) | 22 (8.1%) |
| 11:00 AM to 11:59 AM | 8 (2.8%) | 5 (1.8%) |
| 12:00 PM to 3:59 PM | 5 (1.7%) | 9 (3.3%) |
| 4:00 PM to 11:59 PM | 15 (5.2%) | 10 (3.7%) |
| Total | 289 (100.0%) | 273 (100.0%) |
Housing Occupancy in Colma
Occupancy by Ownership in Colma
Of the total 444 dwellings in Colma, owner-occupied units account for 235 (52.9%), while renter-occupied units make up 209 (47.1%).
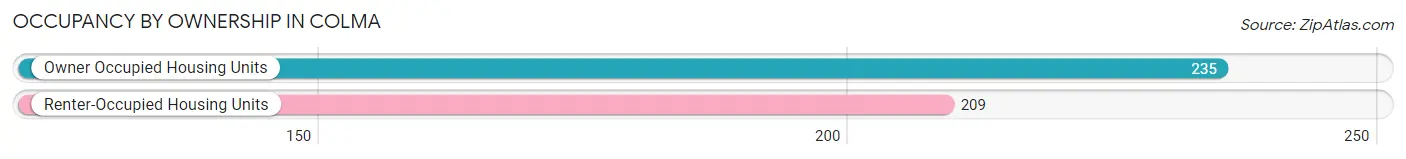
| Occupancy | # Housing Units | % Housing Units |
| Owner Occupied Housing Units | 235 | 52.9% |
| Renter-Occupied Housing Units | 209 | 47.1% |
| Total Occupied Housing Units | 444 | 100.0% |
Occupancy by Household Size in Colma
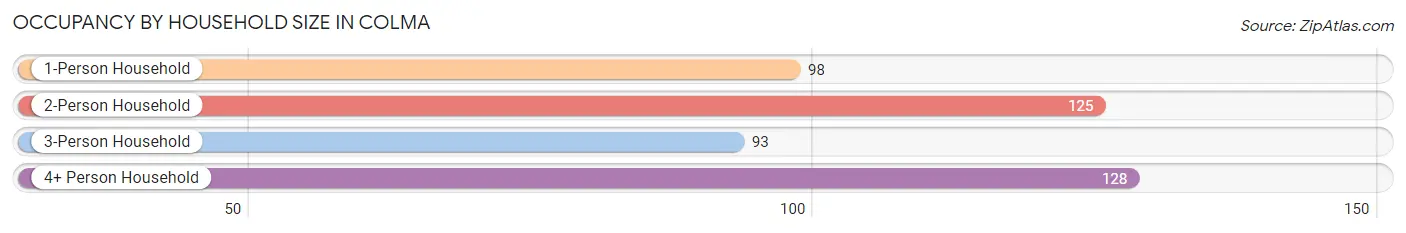
| Household Size | # Housing Units | % Housing Units |
| 1-Person Household | 98 | 22.1% |
| 2-Person Household | 125 | 28.1% |
| 3-Person Household | 93 | 20.9% |
| 4+ Person Household | 128 | 28.8% |
| Total Housing Units | 444 | 100.0% |
Occupancy by Ownership by Household Size in Colma
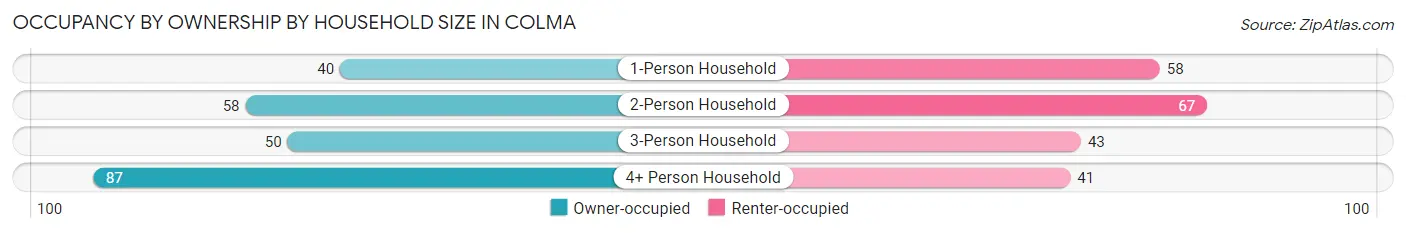
| Household Size | Owner-occupied | Renter-occupied |
| 1-Person Household | 40 (40.8%) | 58 (59.2%) |
| 2-Person Household | 58 (46.4%) | 67 (53.6%) |
| 3-Person Household | 50 (53.8%) | 43 (46.2%) |
| 4+ Person Household | 87 (68.0%) | 41 (32.0%) |
| Total Housing Units | 235 (52.9%) | 209 (47.1%) |
Occupancy by Educational Attainment in Colma
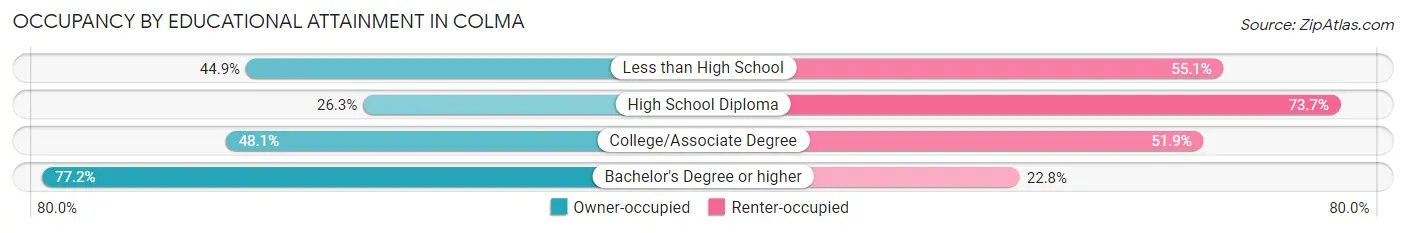
| Household Size | Owner-occupied | Renter-occupied |
| Less than High School | 22 (44.9%) | 27 (55.1%) |
| High School Diploma | 20 (26.3%) | 56 (73.7%) |
| College/Associate Degree | 88 (48.1%) | 95 (51.9%) |
| Bachelor's Degree or higher | 105 (77.2%) | 31 (22.8%) |
Occupancy by Age of Householder in Colma
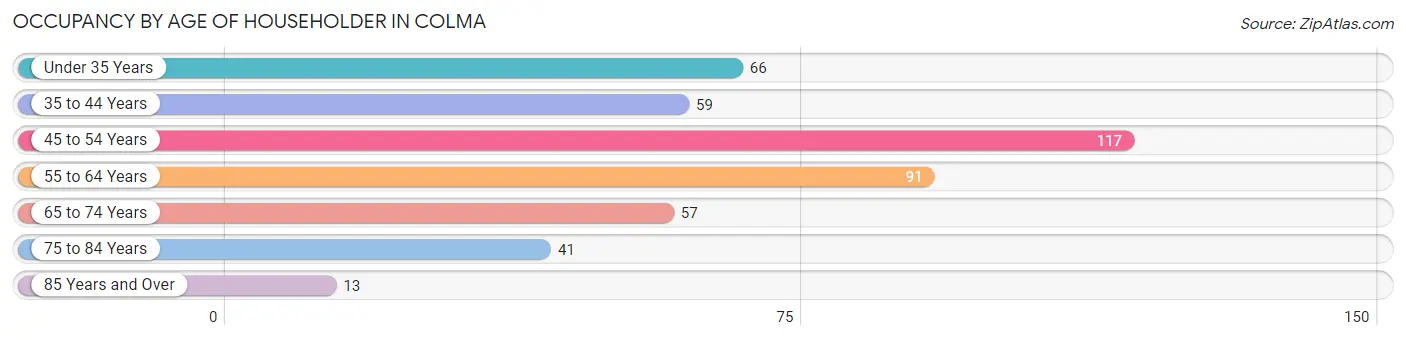
| Age Bracket | # Households | % Households |
| Under 35 Years | 66 | 14.9% |
| 35 to 44 Years | 59 | 13.3% |
| 45 to 54 Years | 117 | 26.4% |
| 55 to 64 Years | 91 | 20.5% |
| 65 to 74 Years | 57 | 12.8% |
| 75 to 84 Years | 41 | 9.2% |
| 85 Years and Over | 13 | 2.9% |
| Total | 444 | 100.0% |
Housing Finances in Colma
Median Income by Occupancy in Colma
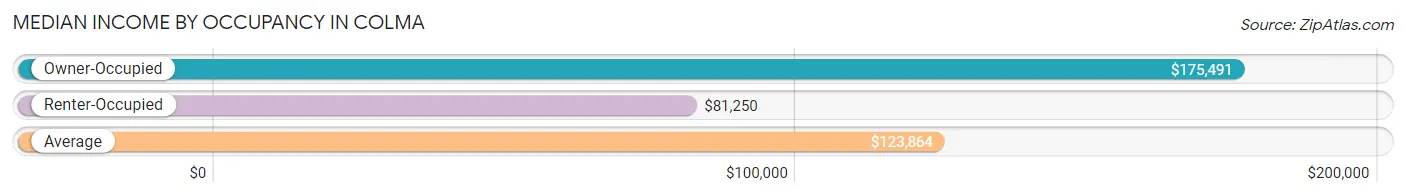
| Occupancy Type | # Households | Median Income |
| Owner-Occupied | 235 (52.9%) | $175,491 |
| Renter-Occupied | 209 (47.1%) | $81,250 |
| Average | 444 (100.0%) | $123,864 |
Occupancy by Householder Income Bracket in Colma
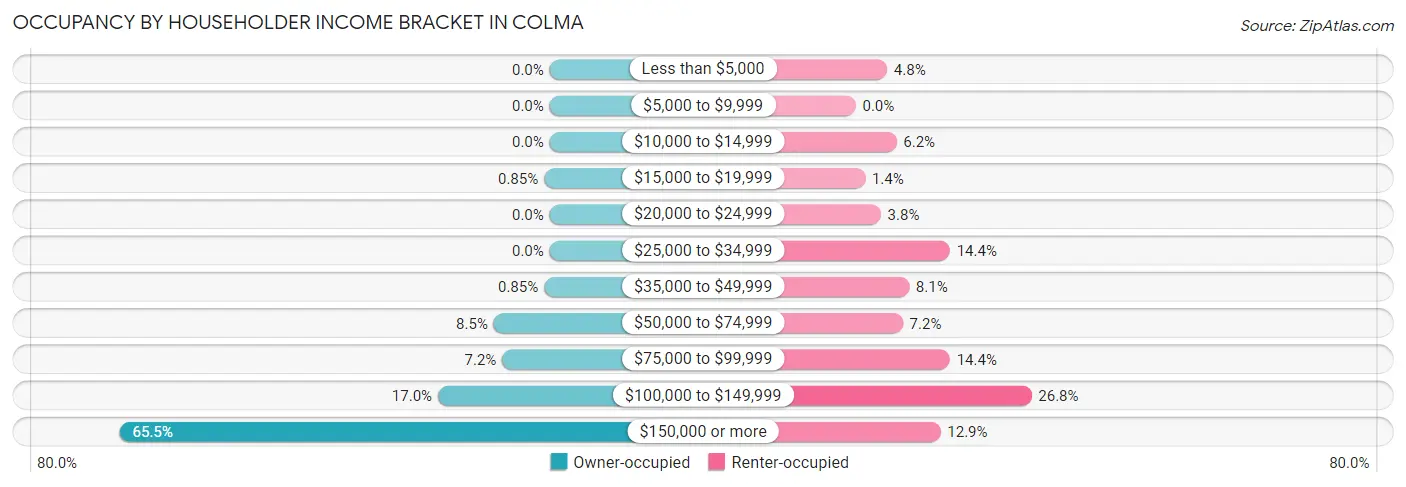
| Income Bracket | Owner-occupied | Renter-occupied |
| Less than $5,000 | 0 (0.0%) | 10 (4.8%) |
| $5,000 to $9,999 | 0 (0.0%) | 0 (0.0%) |
| $10,000 to $14,999 | 0 (0.0%) | 13 (6.2%) |
| $15,000 to $19,999 | 2 (0.9%) | 3 (1.4%) |
| $20,000 to $24,999 | 0 (0.0%) | 8 (3.8%) |
| $25,000 to $34,999 | 0 (0.0%) | 30 (14.3%) |
| $35,000 to $49,999 | 2 (0.9%) | 17 (8.1%) |
| $50,000 to $74,999 | 20 (8.5%) | 15 (7.2%) |
| $75,000 to $99,999 | 17 (7.2%) | 30 (14.3%) |
| $100,000 to $149,999 | 40 (17.0%) | 56 (26.8%) |
| $150,000 or more | 154 (65.5%) | 27 (12.9%) |
| Total | 235 (100.0%) | 209 (100.0%) |
Monthly Housing Cost Tiers in Colma
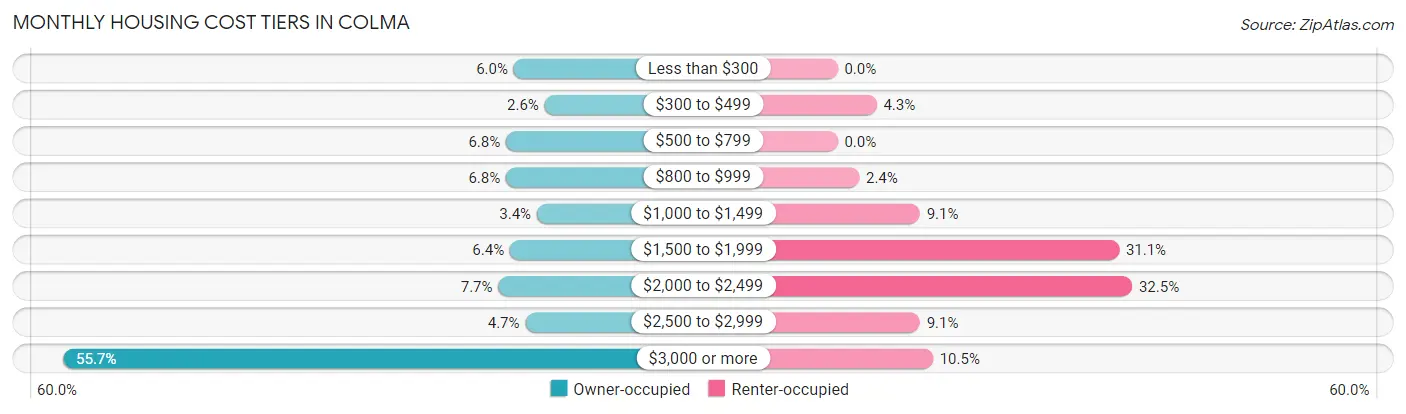
| Monthly Cost | Owner-occupied | Renter-occupied |
| Less than $300 | 14 (6.0%) | 0 (0.0%) |
| $300 to $499 | 6 (2.5%) | 9 (4.3%) |
| $500 to $799 | 16 (6.8%) | 0 (0.0%) |
| $800 to $999 | 16 (6.8%) | 5 (2.4%) |
| $1,000 to $1,499 | 8 (3.4%) | 19 (9.1%) |
| $1,500 to $1,999 | 15 (6.4%) | 65 (31.1%) |
| $2,000 to $2,499 | 18 (7.7%) | 68 (32.5%) |
| $2,500 to $2,999 | 11 (4.7%) | 19 (9.1%) |
| $3,000 or more | 131 (55.7%) | 22 (10.5%) |
| Total | 235 (100.0%) | 209 (100.0%) |
Physical Housing Characteristics in Colma
Housing Structures in Colma
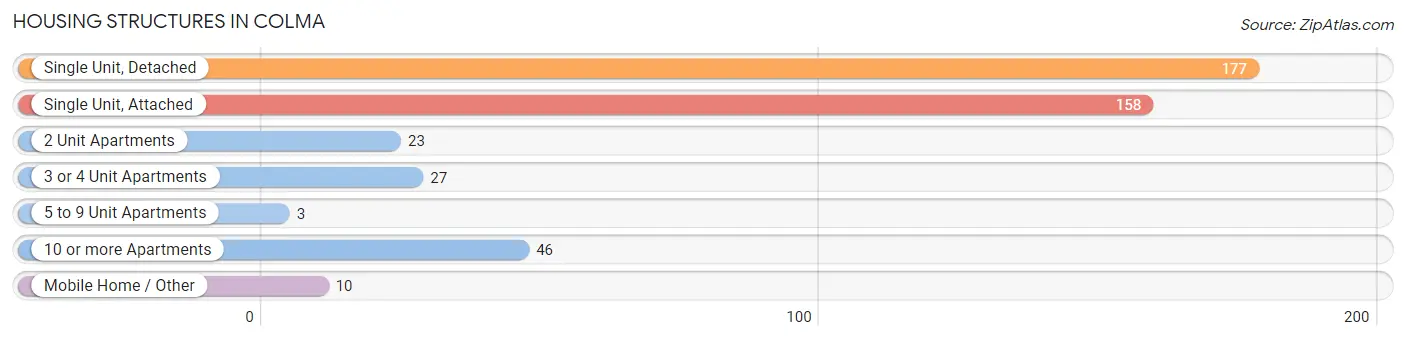
| Structure Type | # Housing Units | % Housing Units |
| Single Unit, Detached | 177 | 39.9% |
| Single Unit, Attached | 158 | 35.6% |
| 2 Unit Apartments | 23 | 5.2% |
| 3 or 4 Unit Apartments | 27 | 6.1% |
| 5 to 9 Unit Apartments | 3 | 0.7% |
| 10 or more Apartments | 46 | 10.4% |
| Mobile Home / Other | 10 | 2.2% |
| Total | 444 | 100.0% |
Housing Structures by Occupancy in Colma
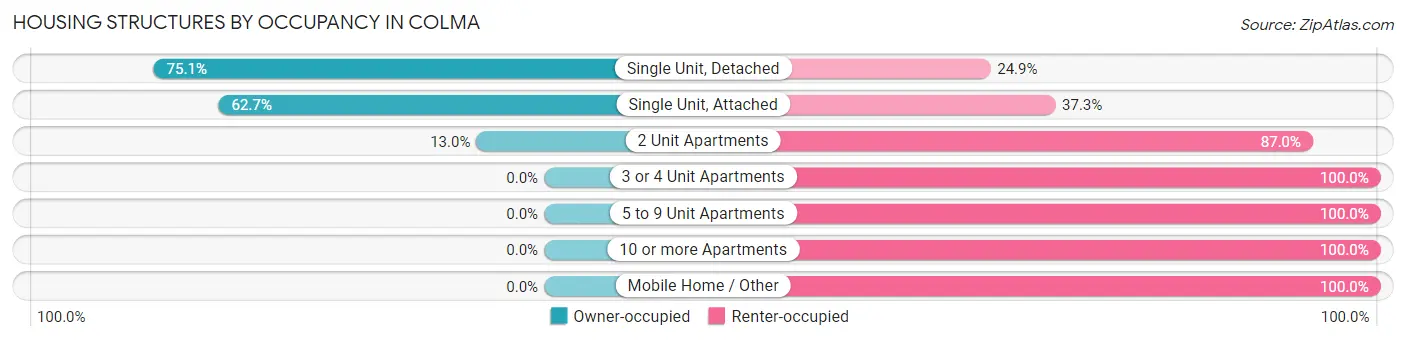
| Structure Type | Owner-occupied | Renter-occupied |
| Single Unit, Detached | 133 (75.1%) | 44 (24.9%) |
| Single Unit, Attached | 99 (62.7%) | 59 (37.3%) |
| 2 Unit Apartments | 3 (13.0%) | 20 (87.0%) |
| 3 or 4 Unit Apartments | 0 (0.0%) | 27 (100.0%) |
| 5 to 9 Unit Apartments | 0 (0.0%) | 3 (100.0%) |
| 10 or more Apartments | 0 (0.0%) | 46 (100.0%) |
| Mobile Home / Other | 0 (0.0%) | 10 (100.0%) |
| Total | 235 (52.9%) | 209 (47.1%) |
Housing Structures by Number of Rooms in Colma
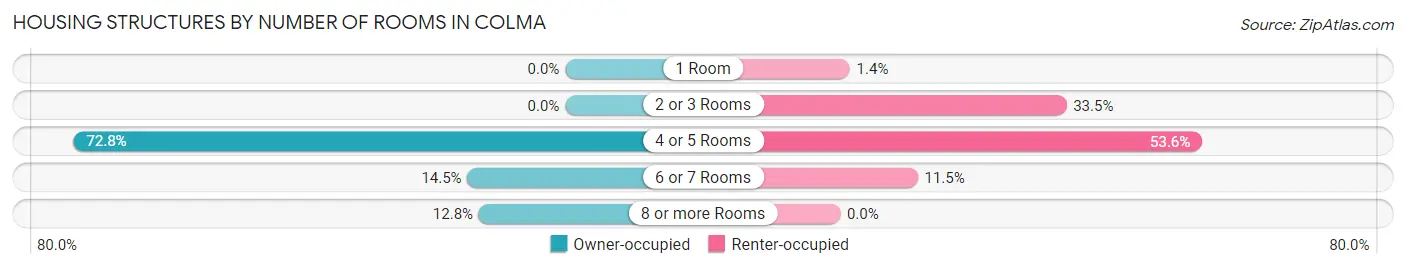
| Number of Rooms | Owner-occupied | Renter-occupied |
| 1 Room | 0 (0.0%) | 3 (1.4%) |
| 2 or 3 Rooms | 0 (0.0%) | 70 (33.5%) |
| 4 or 5 Rooms | 171 (72.8%) | 112 (53.6%) |
| 6 or 7 Rooms | 34 (14.5%) | 24 (11.5%) |
| 8 or more Rooms | 30 (12.8%) | 0 (0.0%) |
| Total | 235 (100.0%) | 209 (100.0%) |
Housing Structure by Heating Type in Colma
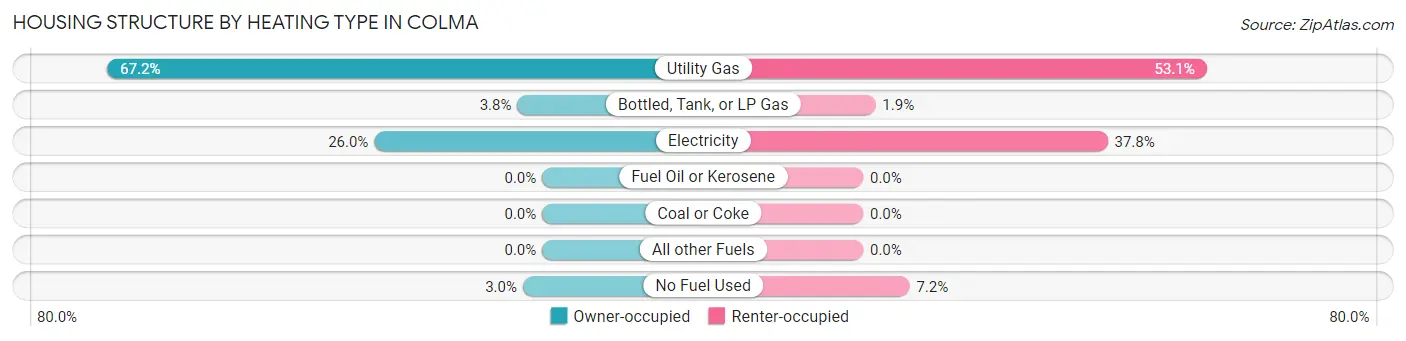
| Heating Type | Owner-occupied | Renter-occupied |
| Utility Gas | 158 (67.2%) | 111 (53.1%) |
| Bottled, Tank, or LP Gas | 9 (3.8%) | 4 (1.9%) |
| Electricity | 61 (26.0%) | 79 (37.8%) |
| Fuel Oil or Kerosene | 0 (0.0%) | 0 (0.0%) |
| Coal or Coke | 0 (0.0%) | 0 (0.0%) |
| All other Fuels | 0 (0.0%) | 0 (0.0%) |
| No Fuel Used | 7 (3.0%) | 15 (7.2%) |
| Total | 235 (100.0%) | 209 (100.0%) |
Household Vehicle Usage in Colma
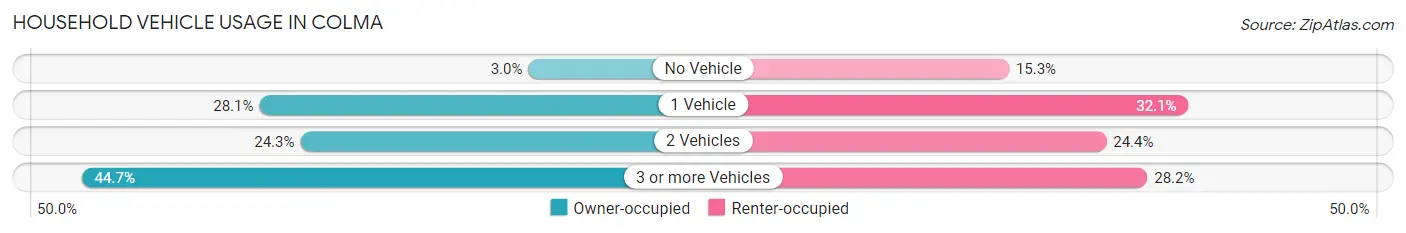
| Vehicles per Household | Owner-occupied | Renter-occupied |
| No Vehicle | 7 (3.0%) | 32 (15.3%) |
| 1 Vehicle | 66 (28.1%) | 67 (32.1%) |
| 2 Vehicles | 57 (24.3%) | 51 (24.4%) |
| 3 or more Vehicles | 105 (44.7%) | 59 (28.2%) |
| Total | 235 (100.0%) | 209 (100.0%) |
Real Estate & Mortgages in Colma
Real Estate and Mortgage Overview in Colma
| Characteristic | Without Mortgage | With Mortgage |
| Housing Units | 73 | 162 |
| Median Property Value | $974,000 | $1,004,100 |
| Median Household Income | $156,563 | $110 |
| Monthly Housing Costs | $825 | $131 |
| Real Estate Taxes | - | - |
Property Value by Mortgage Status in Colma
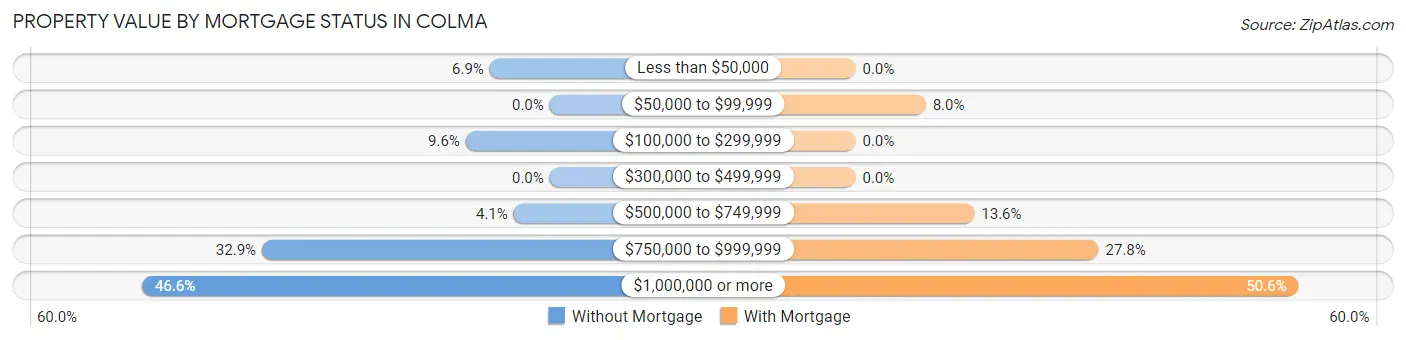
| Property Value | Without Mortgage | With Mortgage |
| Less than $50,000 | 5 (6.9%) | 0 (0.0%) |
| $50,000 to $99,999 | 0 (0.0%) | 13 (8.0%) |
| $100,000 to $299,999 | 7 (9.6%) | 0 (0.0%) |
| $300,000 to $499,999 | 0 (0.0%) | 0 (0.0%) |
| $500,000 to $749,999 | 3 (4.1%) | 22 (13.6%) |
| $750,000 to $999,999 | 24 (32.9%) | 45 (27.8%) |
| $1,000,000 or more | 34 (46.6%) | 82 (50.6%) |
| Total | 73 (100.0%) | 162 (100.0%) |
Household Income by Mortgage Status in Colma
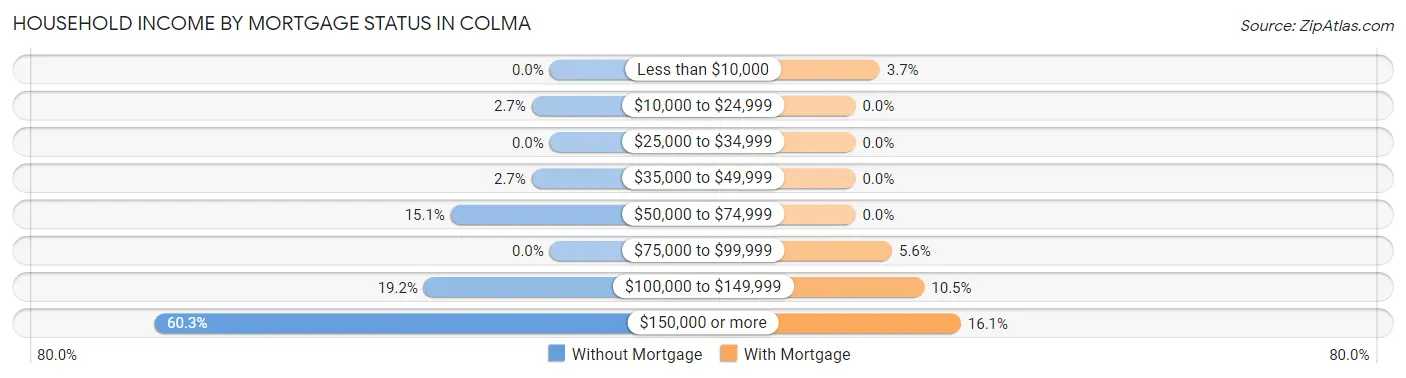
| Household Income | Without Mortgage | With Mortgage |
| Less than $10,000 | 0 (0.0%) | 6 (3.7%) |
| $10,000 to $24,999 | 2 (2.7%) | 0 (0.0%) |
| $25,000 to $34,999 | 0 (0.0%) | 0 (0.0%) |
| $35,000 to $49,999 | 2 (2.7%) | 0 (0.0%) |
| $50,000 to $74,999 | 11 (15.1%) | 0 (0.0%) |
| $75,000 to $99,999 | 0 (0.0%) | 9 (5.6%) |
| $100,000 to $149,999 | 14 (19.2%) | 17 (10.5%) |
| $150,000 or more | 44 (60.3%) | 26 (16.1%) |
| Total | 73 (100.0%) | 162 (100.0%) |
Property Value to Household Income Ratio in Colma
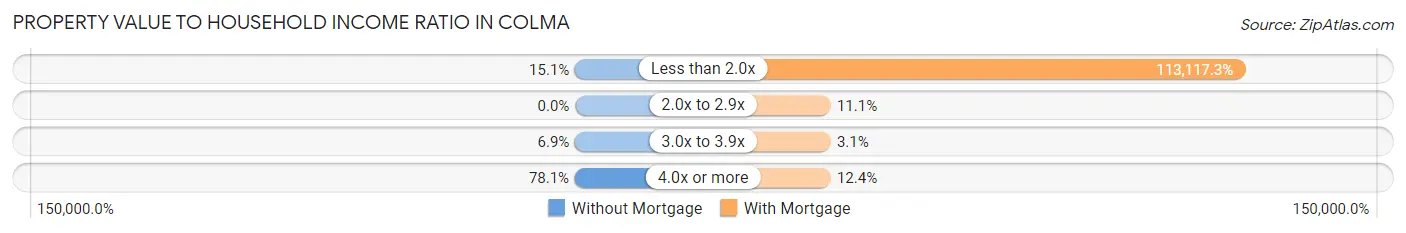
| Value-to-Income Ratio | Without Mortgage | With Mortgage |
| Less than 2.0x | 11 (15.1%) | 183,250 (113,117.3%) |
| 2.0x to 2.9x | 0 (0.0%) | 18 (11.1%) |
| 3.0x to 3.9x | 5 (6.9%) | 5 (3.1%) |
| 4.0x or more | 57 (78.1%) | 20 (12.3%) |
| Total | 73 (100.0%) | 162 (100.0%) |
Real Estate Taxes by Mortgage Status in Colma
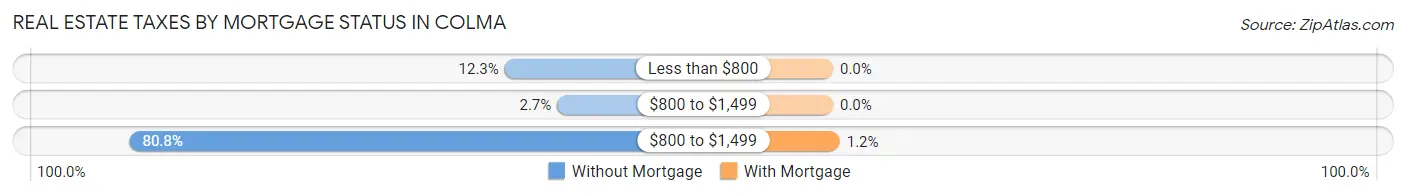
| Property Taxes | Without Mortgage | With Mortgage |
| Less than $800 | 9 (12.3%) | 0 (0.0%) |
| $800 to $1,499 | 2 (2.7%) | 0 (0.0%) |
| $800 to $1,499 | 59 (80.8%) | 2 (1.2%) |
| Total | 73 (100.0%) | 162 (100.0%) |
Health & Disability in Colma
Health Insurance Coverage by Age in Colma
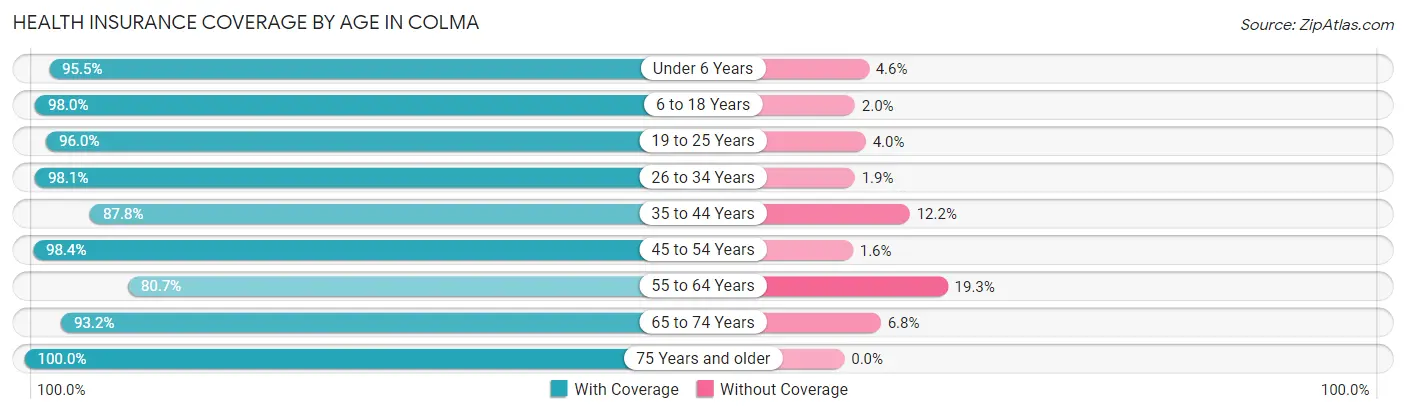
| Age Bracket | With Coverage | Without Coverage |
| Under 6 Years | 63 (95.5%) | 3 (4.5%) |
| 6 to 18 Years | 250 (98.0%) | 5 (2.0%) |
| 19 to 25 Years | 96 (96.0%) | 4 (4.0%) |
| 26 to 34 Years | 152 (98.1%) | 3 (1.9%) |
| 35 to 44 Years | 108 (87.8%) | 15 (12.2%) |
| 45 to 54 Years | 187 (98.4%) | 3 (1.6%) |
| 55 to 64 Years | 155 (80.7%) | 37 (19.3%) |
| 65 to 74 Years | 151 (93.2%) | 11 (6.8%) |
| 75 Years and older | 114 (100.0%) | 0 (0.0%) |
| Total | 1,276 (94.0%) | 81 (6.0%) |
Health Insurance Coverage by Citizenship Status in Colma
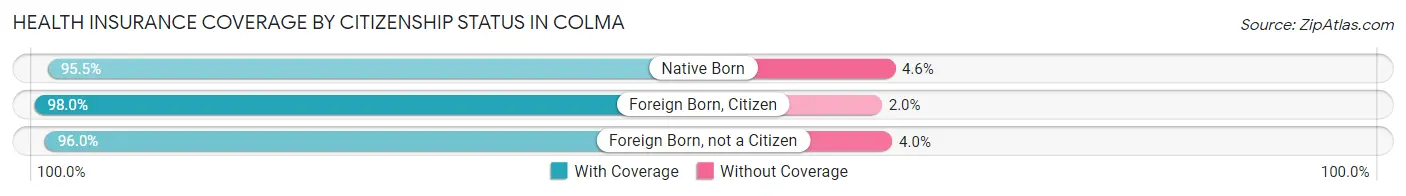
| Citizenship Status | With Coverage | Without Coverage |
| Native Born | 63 (95.5%) | 3 (4.5%) |
| Foreign Born, Citizen | 250 (98.0%) | 5 (2.0%) |
| Foreign Born, not a Citizen | 96 (96.0%) | 4 (4.0%) |
Health Insurance Coverage by Household Income in Colma
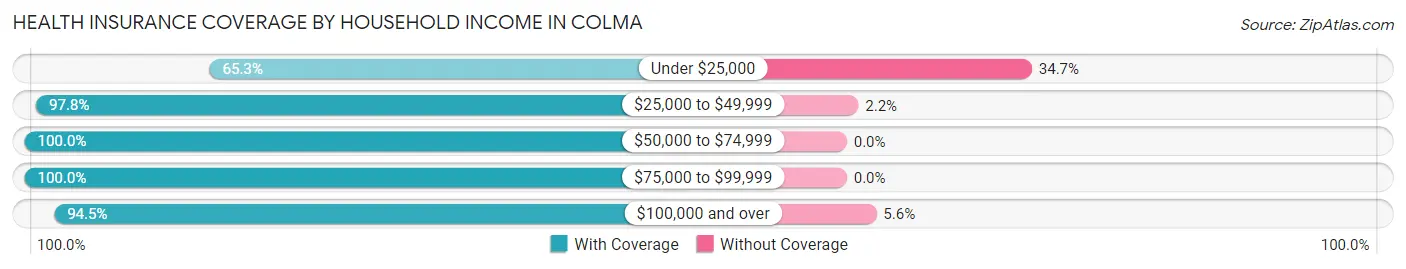
| Household Income | With Coverage | Without Coverage |
| Under $25,000 | 49 (65.3%) | 26 (34.7%) |
| $25,000 to $49,999 | 136 (97.8%) | 3 (2.2%) |
| $50,000 to $74,999 | 61 (100.0%) | 0 (0.0%) |
| $75,000 to $99,999 | 144 (100.0%) | 0 (0.0%) |
| $100,000 and over | 885 (94.5%) | 52 (5.6%) |
Public vs Private Health Insurance Coverage by Age in Colma
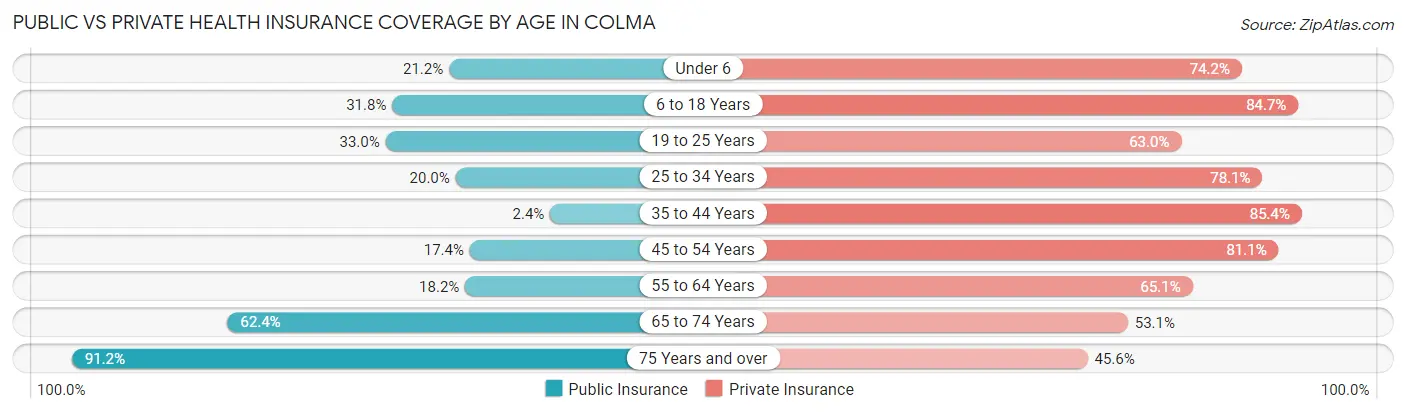
| Age Bracket | Public Insurance | Private Insurance |
| Under 6 | 14 (21.2%) | 49 (74.2%) |
| 6 to 18 Years | 81 (31.8%) | 216 (84.7%) |
| 19 to 25 Years | 33 (33.0%) | 63 (63.0%) |
| 25 to 34 Years | 31 (20.0%) | 121 (78.1%) |
| 35 to 44 Years | 3 (2.4%) | 105 (85.4%) |
| 45 to 54 Years | 33 (17.4%) | 154 (81.0%) |
| 55 to 64 Years | 35 (18.2%) | 125 (65.1%) |
| 65 to 74 Years | 101 (62.4%) | 86 (53.1%) |
| 75 Years and over | 104 (91.2%) | 52 (45.6%) |
| Total | 435 (32.1%) | 971 (71.6%) |
Disability Status by Sex by Age in Colma
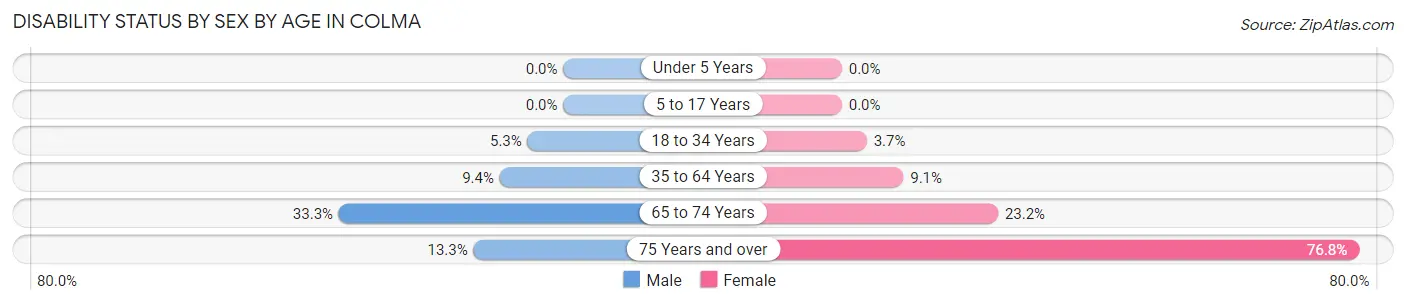
| Age Bracket | Male | Female |
| Under 5 Years | 0 (0.0%) | 0 (0.0%) |
| 5 to 17 Years | 0 (0.0%) | 0 (0.0%) |
| 18 to 34 Years | 6 (5.3%) | 6 (3.7%) |
| 35 to 64 Years | 27 (9.4%) | 20 (9.1%) |
| 65 to 74 Years | 31 (33.3%) | 16 (23.2%) |
| 75 Years and over | 6 (13.3%) | 53 (76.8%) |
Disability Class by Sex by Age in Colma
Disability Class: Hearing Difficulty
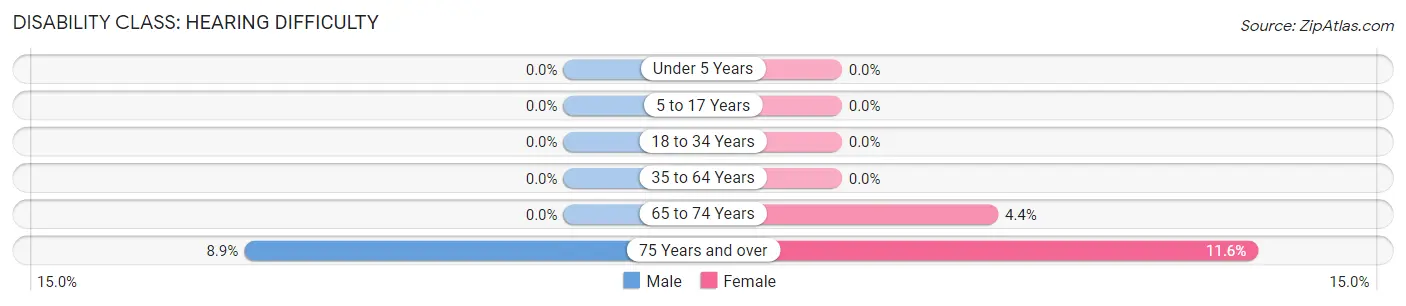
| Age Bracket | Male | Female |
| Under 5 Years | 0 (0.0%) | 0 (0.0%) |
| 5 to 17 Years | 0 (0.0%) | 0 (0.0%) |
| 18 to 34 Years | 0 (0.0%) | 0 (0.0%) |
| 35 to 64 Years | 0 (0.0%) | 0 (0.0%) |
| 65 to 74 Years | 0 (0.0%) | 3 (4.3%) |
| 75 Years and over | 4 (8.9%) | 8 (11.6%) |
Disability Class: Vision Difficulty
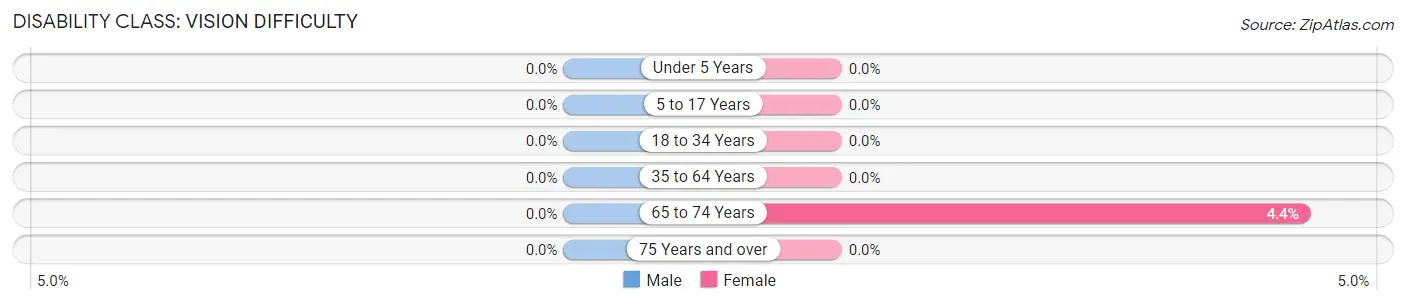
| Age Bracket | Male | Female |
| Under 5 Years | 0 (0.0%) | 0 (0.0%) |
| 5 to 17 Years | 0 (0.0%) | 0 (0.0%) |
| 18 to 34 Years | 0 (0.0%) | 0 (0.0%) |
| 35 to 64 Years | 0 (0.0%) | 0 (0.0%) |
| 65 to 74 Years | 0 (0.0%) | 3 (4.3%) |
| 75 Years and over | 0 (0.0%) | 0 (0.0%) |
Disability Class: Cognitive Difficulty
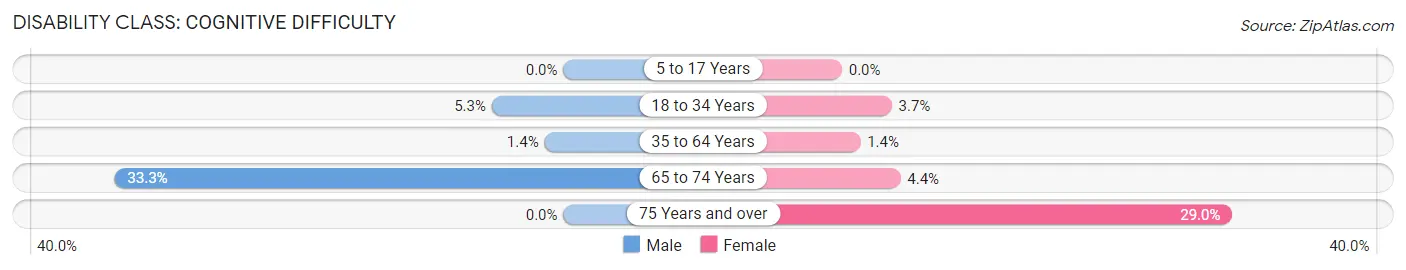
| Age Bracket | Male | Female |
| 5 to 17 Years | 0 (0.0%) | 0 (0.0%) |
| 18 to 34 Years | 6 (5.3%) | 6 (3.7%) |
| 35 to 64 Years | 4 (1.4%) | 3 (1.4%) |
| 65 to 74 Years | 31 (33.3%) | 3 (4.3%) |
| 75 Years and over | 0 (0.0%) | 20 (29.0%) |
Disability Class: Ambulatory Difficulty
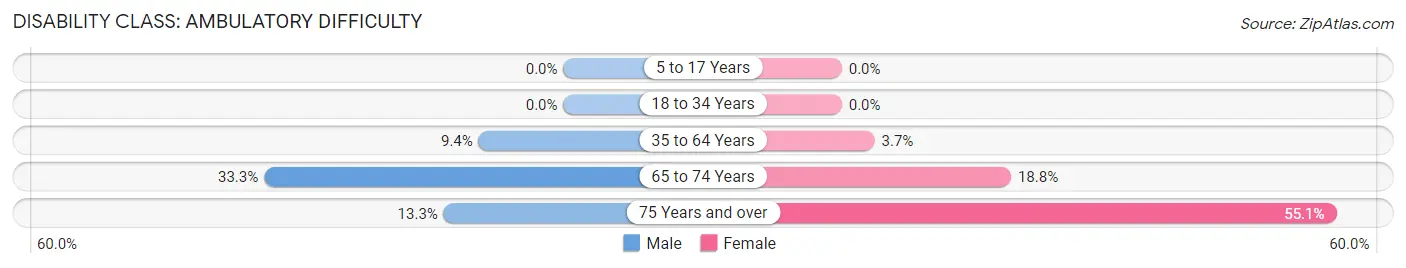
| Age Bracket | Male | Female |
| 5 to 17 Years | 0 (0.0%) | 0 (0.0%) |
| 18 to 34 Years | 0 (0.0%) | 0 (0.0%) |
| 35 to 64 Years | 27 (9.4%) | 8 (3.6%) |
| 65 to 74 Years | 31 (33.3%) | 13 (18.8%) |
| 75 Years and over | 6 (13.3%) | 38 (55.1%) |
Disability Class: Self-Care Difficulty
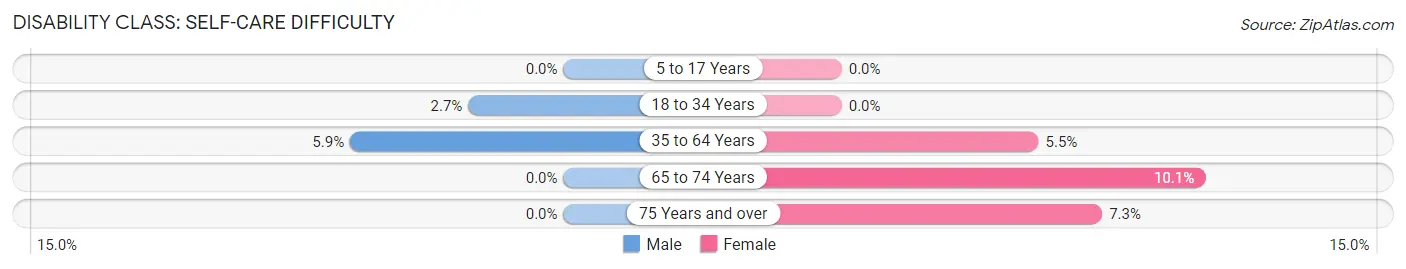
| Age Bracket | Male | Female |
| 5 to 17 Years | 0 (0.0%) | 0 (0.0%) |
| 18 to 34 Years | 3 (2.6%) | 0 (0.0%) |
| 35 to 64 Years | 17 (5.9%) | 12 (5.5%) |
| 65 to 74 Years | 0 (0.0%) | 7 (10.1%) |
| 75 Years and over | 0 (0.0%) | 5 (7.2%) |
Technology Access in Colma
Computing Device Access in Colma
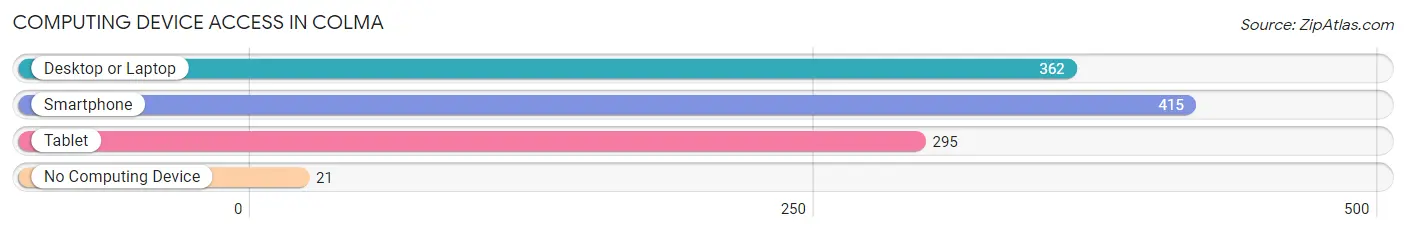
| Device Type | # Households | % Households |
| Desktop or Laptop | 362 | 81.5% |
| Smartphone | 415 | 93.5% |
| Tablet | 295 | 66.4% |
| No Computing Device | 21 | 4.7% |
| Total | 444 | 100.0% |
Internet Access in Colma
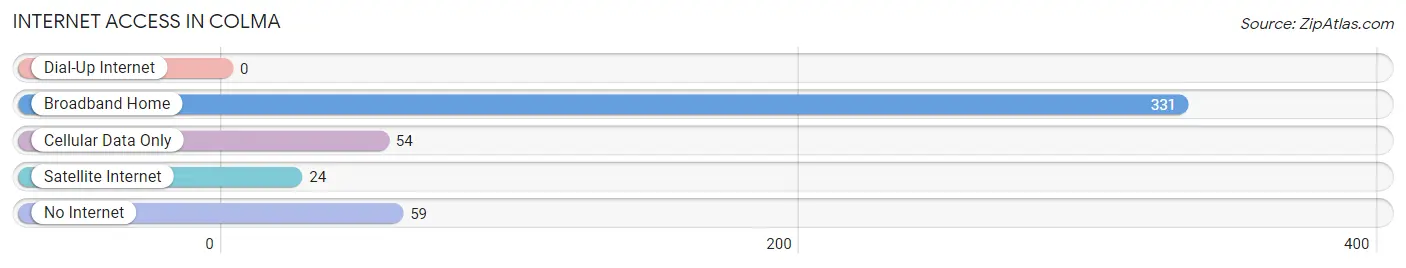
| Internet Type | # Households | % Households |
| Dial-Up Internet | 0 | 0.0% |
| Broadband Home | 331 | 74.6% |
| Cellular Data Only | 54 | 12.2% |
| Satellite Internet | 24 | 5.4% |
| No Internet | 59 | 13.3% |
| Total | 444 | 100.0% |
Colma Summary
Colma, California is a small town located in San Mateo County, just south of San Francisco. It is a unique town in that it is the only incorporated city in the United States that is completely devoted to cemeteries. It is home to 17 cemeteries, including the famous Cypress Lawn Memorial Park, which is the final resting place of many famous people, including Joe DiMaggio, Levi Strauss, and Lillie Hitchcock Coit.
Geography
Colma is located in the San Francisco Bay Area, just south of San Francisco. It is bordered by Daly City to the north, Brisbane to the east, and Pacifica to the south. The town covers an area of 1.5 square miles, with a population of 1,792 as of the 2010 census. The town is situated on a plateau, with an elevation of about 200 feet above sea level. The climate is mild, with temperatures ranging from the mid-50s to the mid-70s throughout the year.
Economy
Colma’s economy is largely based on the cemetery industry. The town is home to 17 cemeteries, which employ a large number of people. In addition, the town is home to a number of businesses that serve the cemetery industry, such as funeral homes, florists, and monument makers. The town also has a number of retail stores, restaurants, and other businesses that serve the local community.
Demographics
As of the 2010 census, Colma had a population of 1,792. The racial makeup of the town was 64.3% White, 0.7% African American, 0.3% Native American, 11.2% Asian, 0.2% Pacific Islander, and 22.5% from other races. The median household income was $50,945, and the median family income was $60,945. The per capita income was $25,945.
Colma is a unique town with a rich history and a vibrant economy. It is home to 17 cemeteries, which employ a large number of people and provide a variety of services to the local community. The town has a diverse population, with a median household income of $50,945 and a median family income of $60,945. Colma is a great place to live, work, and visit, and it is sure to remain a popular destination for many years to come.
Common Questions
What is Per Capita Income in Colma?
Per Capita income in Colma is $49,696.
What is the Median Family Income in Colma?
Median Family Income in Colma is $134,861.
What is the Median Household income in Colma?
Median Household Income in Colma is $123,864.
What is Income or Wage Gap in Colma?
Income or Wage Gap in Colma is 22.5%.
Women in Colma earn 77.5 cents for every dollar earned by a man.
What is Inequality or Gini Index in Colma?
Inequality or Gini Index in Colma is 0.40.
What is the Total Population of Colma?
Total Population of Colma is 1,376.
What is the Total Male Population of Colma?
Total Male Population of Colma is 722.
What is the Total Female Population of Colma?
Total Female Population of Colma is 654.
What is the Ratio of Males per 100 Females in Colma?
There are 110.40 Males per 100 Females in Colma.
What is the Ratio of Females per 100 Males in Colma?
There are 90.58 Females per 100 Males in Colma.
What is the Median Population Age in Colma?
Median Population Age in Colma is 42.4 Years.
What is the Average Family Size in Colma
Average Family Size in Colma is 3.8 People.
What is the Average Household Size in Colma
Average Household Size in Colma is 3.1 People.
How Large is the Labor Force in Colma?
There are 782 People in the Labor Forcein in Colma.
What is the Percentage of People in the Labor Force in Colma?
68.5% of People are in the Labor Force in Colma.
What is the Unemployment Rate in Colma?
Unemployment Rate in Colma is 6.9%.