Cities with the Highest Percentage of Population Employed in Computer & Mathematics in Michigan
RELATED REPORTS & OPTIONS
Computer & Mathematics
Michigan
Compare Cities
Map of Cities with the Highest Percentage of Population Employed in Computer & Mathematics in Michigan
0.0%
30.0%
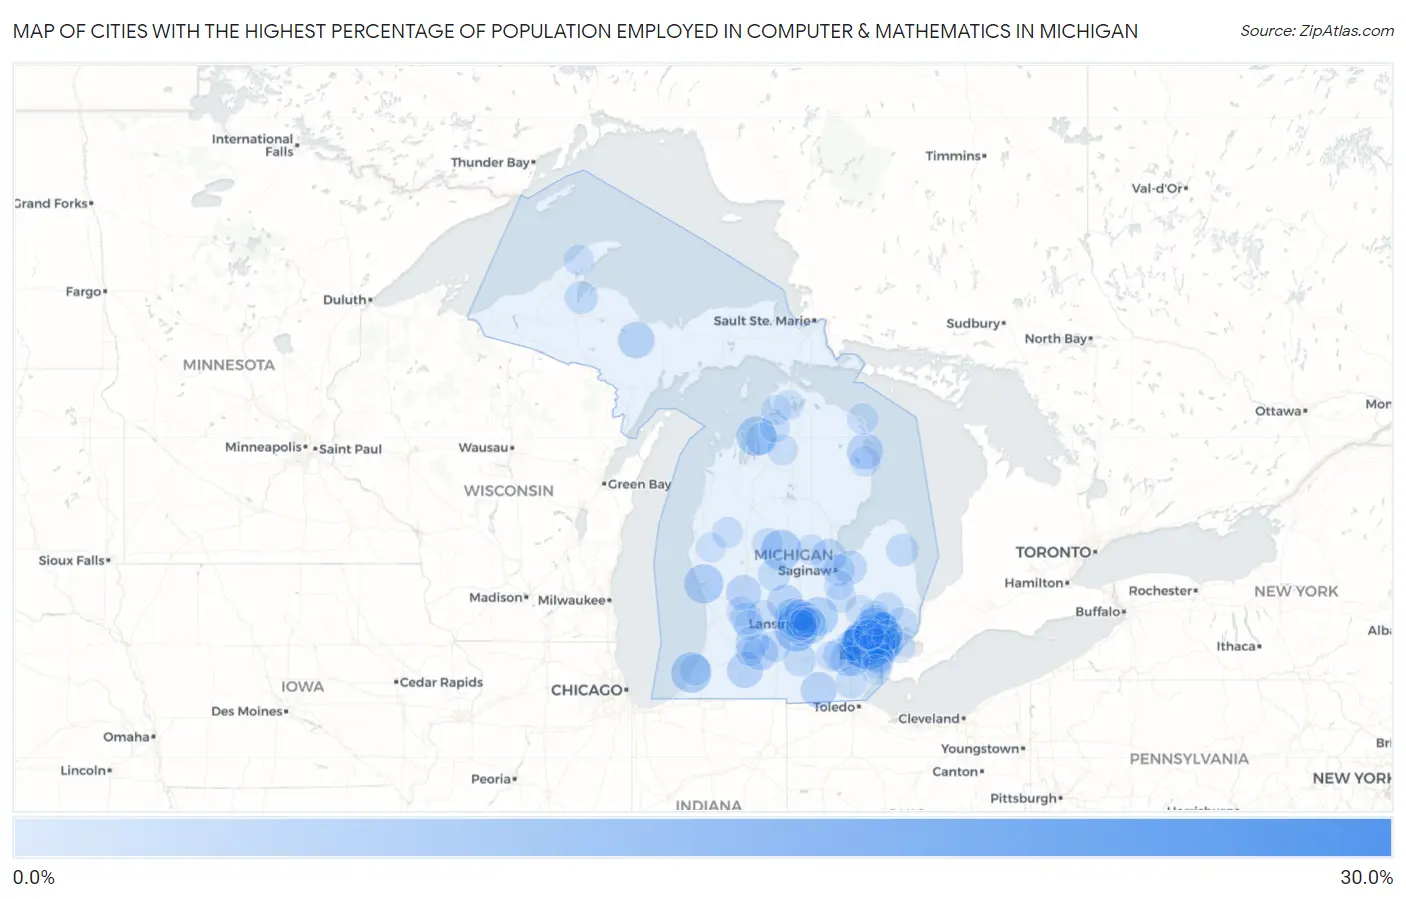
Cities with the Highest Percentage of Population Employed in Computer & Mathematics in Michigan
| City | % Employed | vs State | vs National | |
| 1. | Bergland | 25.5% | 2.9%(+22.6)#1 | 3.5%(+22.0)#98 |
| 2. | Winn | 14.8% | 2.9%(+11.8)#2 | 3.5%(+11.2)#327 |
| 3. | Farmington | 13.4% | 2.9%(+10.5)#3 | 3.5%(+9.86)#401 |
| 4. | Dimondale | 10.1% | 2.9%(+7.21)#4 | 3.5%(+6.61)#712 |
| 5. | Troy | 9.6% | 2.9%(+6.69)#5 | 3.5%(+6.09)#810 |
| 6. | Northville | 9.4% | 2.9%(+6.52)#6 | 3.5%(+5.92)#847 |
| 7. | Auburn Hills | 9.1% | 2.9%(+6.21)#7 | 3.5%(+5.61)#912 |
| 8. | Beal City | 9.0% | 2.9%(+6.11)#8 | 3.5%(+5.51)#936 |
| 9. | Pleasant Ridge | 8.9% | 2.9%(+5.98)#9 | 3.5%(+5.38)#956 |
| 10. | Novi | 8.9% | 2.9%(+5.93)#10 | 3.5%(+5.33)#967 |
| 11. | St Joseph | 8.8% | 2.9%(+5.90)#11 | 3.5%(+5.31)#971 |
| 12. | Eastport | 8.5% | 2.9%(+5.57)#12 | 3.5%(+4.97)#1,061 |
| 13. | North Muskegon | 8.3% | 2.9%(+5.39)#13 | 3.5%(+4.79)#1,115 |
| 14. | Waverly | 8.2% | 2.9%(+5.25)#14 | 3.5%(+4.65)#1,156 |
| 15. | Perry | 8.1% | 2.9%(+5.13)#15 | 3.5%(+4.54)#1,194 |
| 16. | Lathrup Village | 8.0% | 2.9%(+5.09)#16 | 3.5%(+4.49)#1,207 |
| 17. | Farmington Hills | 7.9% | 2.9%(+4.95)#17 | 3.5%(+4.36)#1,272 |
| 18. | Wacousta | 7.8% | 2.9%(+4.85)#18 | 3.5%(+4.25)#1,308 |
| 19. | Hurontown | 7.6% | 2.9%(+4.64)#19 | 3.5%(+4.04)#1,382 |
| 20. | Clawson | 7.4% | 2.9%(+4.49)#20 | 3.5%(+3.90)#1,432 |
| 21. | Mass | 7.1% | 2.9%(+4.22)#21 | 3.5%(+3.62)#1,535 |
| 22. | Gwinn | 7.1% | 2.9%(+4.20)#22 | 3.5%(+3.60)#1,547 |
| 23. | Ossineke | 6.8% | 2.9%(+3.92)#23 | 3.5%(+3.32)#1,677 |
| 24. | Vicksburg | 6.8% | 2.9%(+3.83)#24 | 3.5%(+3.23)#1,730 |
| 25. | Clayton | 6.7% | 2.9%(+3.82)#25 | 3.5%(+3.22)#1,737 |
| 26. | Level Park Oak Park | 6.7% | 2.9%(+3.79)#26 | 3.5%(+3.19)#1,750 |
| 27. | Pewamo | 6.7% | 2.9%(+3.74)#27 | 3.5%(+3.14)#1,773 |
| 28. | Rockford | 6.5% | 2.9%(+3.53)#28 | 3.5%(+2.93)#1,890 |
| 29. | Okemos | 6.4% | 2.9%(+3.51)#29 | 3.5%(+2.91)#1,901 |
| 30. | Rochester Hills | 6.4% | 2.9%(+3.50)#30 | 3.5%(+2.90)#1,907 |
| 31. | Shaftsburg | 6.4% | 2.9%(+3.49)#31 | 3.5%(+2.89)#1,910 |
| 32. | Sylvan Lake | 6.4% | 2.9%(+3.43)#32 | 3.5%(+2.83)#1,936 |
| 33. | Auburn | 6.2% | 2.9%(+3.29)#33 | 3.5%(+2.70)#2,013 |
| 34. | Plymouth | 6.2% | 2.9%(+3.28)#34 | 3.5%(+2.68)#2,024 |
| 35. | Ann Arbor | 6.2% | 2.9%(+3.23)#35 | 3.5%(+2.63)#2,069 |
| 36. | Ferndale | 6.1% | 2.9%(+3.19)#36 | 3.5%(+2.59)#2,094 |
| 37. | Chassell | 6.0% | 2.9%(+3.10)#37 | 3.5%(+2.50)#2,152 |
| 38. | Wolverine Lake | 5.9% | 2.9%(+3.02)#38 | 3.5%(+2.42)#2,212 |
| 39. | Reese | 5.8% | 2.9%(+2.92)#39 | 3.5%(+2.32)#2,283 |
| 40. | Dexter | 5.7% | 2.9%(+2.82)#40 | 3.5%(+2.22)#2,361 |
| 41. | Delton | 5.7% | 2.9%(+2.78)#41 | 3.5%(+2.18)#2,392 |
| 42. | Berkley | 5.4% | 2.9%(+2.50)#42 | 3.5%(+1.90)#2,641 |
| 43. | Zeba | 5.4% | 2.9%(+2.43)#43 | 3.5%(+1.83)#2,721 |
| 44. | New Haven | 5.3% | 2.9%(+2.38)#44 | 3.5%(+1.78)#2,771 |
| 45. | Parma | 5.3% | 2.9%(+2.36)#45 | 3.5%(+1.76)#2,795 |
| 46. | Madison Heights | 5.2% | 2.9%(+2.31)#46 | 3.5%(+1.71)#2,824 |
| 47. | Minden City | 5.2% | 2.9%(+2.28)#47 | 3.5%(+1.68)#2,851 |
| 48. | Holt | 5.1% | 2.9%(+2.20)#48 | 3.5%(+1.60)#2,951 |
| 49. | Beverly Hills | 5.1% | 2.9%(+2.17)#49 | 3.5%(+1.57)#2,975 |
| 50. | Almont | 5.1% | 2.9%(+2.14)#50 | 3.5%(+1.54)#3,007 |
| 51. | Oak Park | 5.1% | 2.9%(+2.14)#51 | 3.5%(+1.54)#3,014 |
| 52. | Caledonia | 5.0% | 2.9%(+2.05)#52 | 3.5%(+1.45)#3,122 |
| 53. | Royal Oak | 4.9% | 2.9%(+2.02)#53 | 3.5%(+1.42)#3,146 |
| 54. | Mcbride | 4.9% | 2.9%(+2.01)#54 | 3.5%(+1.41)#3,160 |
| 55. | Central Lake | 4.9% | 2.9%(+1.95)#55 | 3.5%(+1.35)#3,230 |
| 56. | Buena Vista | 4.8% | 2.9%(+1.91)#56 | 3.5%(+1.31)#3,283 |
| 57. | Dundee | 4.8% | 2.9%(+1.88)#57 | 3.5%(+1.28)#3,314 |
| 58. | Wixom | 4.8% | 2.9%(+1.86)#58 | 3.5%(+1.26)#3,347 |
| 59. | Livonia | 4.7% | 2.9%(+1.79)#59 | 3.5%(+1.19)#3,420 |
| 60. | Center Line | 4.7% | 2.9%(+1.78)#60 | 3.5%(+1.18)#3,440 |
| 61. | South Lyon | 4.7% | 2.9%(+1.78)#61 | 3.5%(+1.18)#3,442 |
| 62. | Dewitt | 4.7% | 2.9%(+1.75)#62 | 3.5%(+1.15)#3,480 |
| 63. | Dearborn | 4.6% | 2.9%(+1.71)#63 | 3.5%(+1.11)#3,532 |
| 64. | Barryton | 4.5% | 2.9%(+1.62)#64 | 3.5%(+1.02)#3,622 |
| 65. | Bellevue | 4.5% | 2.9%(+1.60)#65 | 3.5%(+1.00)#3,650 |
| 66. | Bath | 4.5% | 2.9%(+1.59)#66 | 3.5%(+0.994)#3,660 |
| 67. | Benton Heights | 4.5% | 2.9%(+1.58)#67 | 3.5%(+0.982)#3,669 |
| 68. | Presque Isle Harbor | 4.4% | 2.9%(+1.48)#68 | 3.5%(+0.881)#3,809 |
| 69. | Baldwin | 4.4% | 2.9%(+1.47)#69 | 3.5%(+0.875)#3,821 |
| 70. | Village Of Grosse Pointe Shores | 4.4% | 2.9%(+1.44)#70 | 3.5%(+0.843)#3,868 |
| 71. | Oxford | 4.4% | 2.9%(+1.44)#71 | 3.5%(+0.842)#3,869 |
| 72. | Sanford | 4.4% | 2.9%(+1.43)#72 | 3.5%(+0.834)#3,883 |
| 73. | Haslett | 4.3% | 2.9%(+1.42)#73 | 3.5%(+0.822)#3,906 |
| 74. | Melvindale | 4.3% | 2.9%(+1.42)#74 | 3.5%(+0.819)#3,909 |
| 75. | Rochester | 4.3% | 2.9%(+1.41)#75 | 3.5%(+0.809)#3,923 |
| 76. | Keego Harbor | 4.3% | 2.9%(+1.37)#76 | 3.5%(+0.773)#3,988 |
| 77. | East Lansing | 4.3% | 2.9%(+1.37)#77 | 3.5%(+0.771)#3,991 |
| 78. | Lost Lake Woods | 4.3% | 2.9%(+1.36)#78 | 3.5%(+0.761)#3,998 |
| 79. | Clarksville | 4.2% | 2.9%(+1.31)#79 | 3.5%(+0.708)#4,073 |
| 80. | Southfield | 4.2% | 2.9%(+1.30)#80 | 3.5%(+0.706)#4,077 |
| 81. | Lansing | 4.2% | 2.9%(+1.30)#81 | 3.5%(+0.705)#4,078 |
| 82. | Lakes Of The North | 4.2% | 2.9%(+1.26)#82 | 3.5%(+0.663)#4,147 |
| 83. | Calumet | 4.1% | 2.9%(+1.22)#83 | 3.5%(+0.625)#4,228 |
| 84. | Sterling Heights | 4.1% | 2.9%(+1.16)#84 | 3.5%(+0.562)#4,332 |
| 85. | Flushing | 4.1% | 2.9%(+1.16)#85 | 3.5%(+0.559)#4,336 |
| 86. | Southgate | 4.1% | 2.9%(+1.15)#86 | 3.5%(+0.549)#4,357 |
| 87. | Woodhaven | 4.1% | 2.9%(+1.13)#87 | 3.5%(+0.529)#4,382 |
| 88. | Ypsilanti | 4.0% | 2.9%(+1.10)#88 | 3.5%(+0.505)#4,409 |
| 89. | Richland | 4.0% | 2.9%(+1.10)#89 | 3.5%(+0.497)#4,418 |
| 90. | Lake Orion | 4.0% | 2.9%(+1.09)#90 | 3.5%(+0.490)#4,429 |
| 91. | Harbor Springs | 4.0% | 2.9%(+1.08)#91 | 3.5%(+0.485)#4,435 |
| 92. | Walkerville | 4.0% | 2.9%(+1.07)#92 | 3.5%(+0.475)#4,460 |
| 93. | Kentwood | 4.0% | 2.9%(+1.07)#93 | 3.5%(+0.475)#4,468 |
| 94. | Boyne City | 4.0% | 2.9%(+1.06)#94 | 3.5%(+0.463)#4,481 |
| 95. | Orchard Lake Village | 4.0% | 2.9%(+1.06)#95 | 3.5%(+0.461)#4,483 |
| 96. | Burt | 4.0% | 2.9%(+1.05)#96 | 3.5%(+0.448)#4,511 |
| 97. | Middleville | 4.0% | 2.9%(+1.04)#97 | 3.5%(+0.442)#4,527 |
| 98. | Goodrich | 3.9% | 2.9%(+1.01)#98 | 3.5%(+0.414)#4,571 |
| 99. | Brutus | 3.9% | 2.9%(+1.01)#99 | 3.5%(+0.412)#4,577 |
| 100. | Chelsea | 3.9% | 2.9%(+1.00)#100 | 3.5%(+0.402)#4,585 |
Common Questions
What are the Top 10 Cities with the Highest Percentage of Population Employed in Computer & Mathematics in Michigan?
Top 10 Cities with the Highest Percentage of Population Employed in Computer & Mathematics in Michigan are:
#1
13.4%
#2
10.1%
#3
9.6%
#4
9.4%
#5
9.1%
#6
9.0%
#7
8.9%
#8
8.9%
#9
8.8%
#10
8.5%
What city has the Highest Percentage of Population Employed in Computer & Mathematics in Michigan?
Farmington has the Highest Percentage of Population Employed in Computer & Mathematics in Michigan with 13.4%.
What is the Percentage of Population Employed in Computer & Mathematics in the State of Michigan?
Percentage of Population Employed in Computer & Mathematics in Michigan is 2.9%.
What is the Percentage of Population Employed in Computer & Mathematics in the United States?
Percentage of Population Employed in Computer & Mathematics in the United States is 3.5%.