Cities with the Highest Percentage of Population Employed in Computer & Mathematics in the United States
RELATED REPORTS & OPTIONS
Computer & Mathematics
United States
Compare Cities
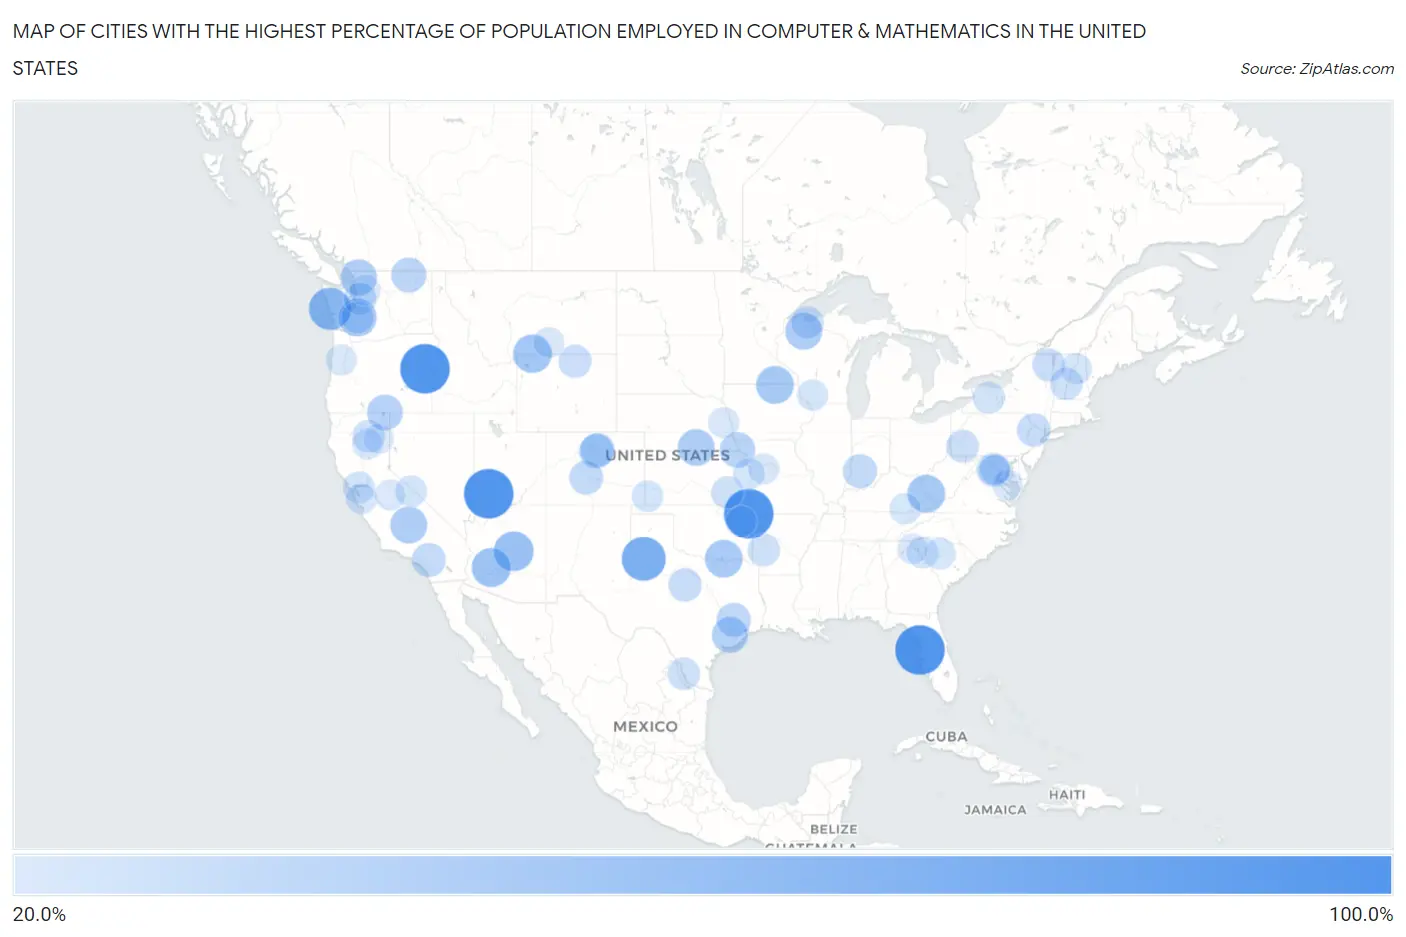
Map of Cities with the Highest Percentage of Population Employed in Computer & Mathematics in the United States
0.0%
100.0%
Cities with the Highest Percentage of Population Employed in Computer & Mathematics in the United States
| City | % Employed | vs State | vs National | |
| 1. | Aripeka | 100.0% | 2.9%(+97.1)#1 | 3.5%(+96.5)#1 |
| 2. | Browntown | 100.0% | 2.4%(+97.6)#1 | 3.5%(+96.5)#2 |
| 3. | Red Banks | 100.0% | 1.3%(+98.7)#1 | 3.5%(+96.5)#3 |
| 4. | White Water | 100.0% | 2.3%(+97.7)#1 | 3.5%(+96.5)#4 |
| 5. | Sandusky | 100.0% | 2.4%(+97.6)#1 | 3.5%(+96.5)#5 |
| 6. | Cedar Highlands | 100.0% | 4.5%(+95.5)#1 | 3.5%(+96.5)#6 |
| 7. | Brogan | 100.0% | 3.5%(+96.5)#1 | 3.5%(+96.5)#7 |
| 8. | Spade | 77.4% | 3.4%(+74.0)#1 | 3.5%(+73.9)#8 |
| 9. | Moclips | 70.5% | 6.1%(+64.5)#1 | 3.5%(+67.0)#9 |
| 10. | Whispering Pines | 60.9% | 3.6%(+57.3)#1 | 3.5%(+57.3)#10 |
| 11. | Wintersburg | 58.6% | 3.6%(+55.0)#2 | 3.5%(+55.0)#11 |
| 12. | Furley | 57.1% | 3.0%(+54.2)#1 | 3.5%(+53.6)#12 |
| 13. | Silver Gate | 56.9% | 2.2%(+54.7)#1 | 3.5%(+53.3)#13 |
| 14. | Huntington Center | 54.8% | 2.8%(+52.1)#1 | 3.5%(+51.3)#14 |
| 15. | Alder | 54.5% | 6.1%(+48.5)#2 | 3.5%(+51.0)#15 |
| 16. | Belfry | 53.3% | 2.2%(+51.2)#1 | 3.5%(+49.8)#16 |
| 17. | Toeterville | 53.3% | 2.7%(+50.6)#1 | 3.5%(+49.8)#17 |
| 18. | Platter | 52.9% | 2.3%(+50.6)#2 | 3.5%(+49.4)#18 |
| 19. | Magnolia Beach | 51.2% | 3.4%(+47.8)#2 | 3.5%(+47.7)#19 |
| 20. | Chimney Point | 51.1% | 3.4%(+47.7)#1 | 3.5%(+47.6)#20 |
| 21. | Clam Lake | 50.0% | 3.0%(+47.0)#1 | 3.5%(+46.5)#21 |
| 22. | California Hot Springs | 50.0% | 4.1%(+45.9)#1 | 3.5%(+46.5)#22 |
| 23. | Cowles | 50.0% | 3.2%(+46.8)#1 | 3.5%(+46.5)#23 |
| 24. | Acme | 47.8% | 6.1%(+41.7)#3 | 3.5%(+44.3)#24 |
| 25. | Hungerford | 46.6% | 3.4%(+43.1)#3 | 3.5%(+43.0)#25 |
| 26. | North Bay | 45.8% | 3.1%(+42.6)#1 | 3.5%(+42.2)#26 |
| 27. | New Pine Creek | 45.7% | 3.5%(+42.3)#2 | 3.5%(+42.2)#27 |
| 28. | Canyon Creek | 45.5% | 2.2%(+43.3)#2 | 3.5%(+41.9)#28 |
| 29. | Benton | 45.2% | 1.3%(+43.9)#2 | 3.5%(+41.6)#29 |
| 30. | Preston | 44.4% | 3.2%(+41.3)#2 | 3.5%(+40.9)#30 |
| 31. | Topstone | 43.1% | 3.4%(+39.7)#2 | 3.5%(+39.6)#31 |
| 32. | Malo | 42.9% | 6.1%(+36.8)#4 | 3.5%(+39.3)#32 |
| 33. | Centerton | 41.3% | 2.4%(+38.9)#2 | 3.5%(+37.8)#33 |
| 34. | Todd Mission | 40.7% | 3.4%(+37.3)#4 | 3.5%(+37.2)#34 |
| 35. | Bonanza Mountain Estates | 40.6% | 4.8%(+35.8)#1 | 3.5%(+37.1)#35 |
| 36. | Loudoun Valley Estates | 39.5% | 6.2%(+33.2)#1 | 3.5%(+35.9)#36 |
| 37. | Tall Timber | 39.4% | 4.8%(+34.7)#2 | 3.5%(+35.9)#37 |
| 38. | Crane | 39.4% | 2.4%(+37.0)#3 | 3.5%(+35.9)#38 |
| 39. | March Arb | 38.8% | 4.1%(+34.7)#2 | 3.5%(+35.2)#39 |
| 40. | Maysville | 38.6% | 4.8%(+33.9)#3 | 3.5%(+35.1)#40 |
| 41. | Nixon | 37.8% | 2.6%(+35.3)#1 | 3.5%(+34.3)#41 |
| 42. | Petroleum | 37.5% | 2.4%(+35.1)#4 | 3.5%(+34.0)#42 |
| 43. | Culp | 37.0% | 3.3%(+33.8)#1 | 3.5%(+33.5)#43 |
| 44. | Ross Corner | 36.8% | 4.5%(+32.3)#1 | 3.5%(+33.3)#44 |
| 45. | Putnam | 36.4% | 3.4%(+32.9)#5 | 3.5%(+32.8)#45 |
| 46. | Andersonville | 36.0% | 2.4%(+33.6)#5 | 3.5%(+32.5)#46 |
| 47. | Aldie | 35.7% | 6.2%(+29.5)#2 | 3.5%(+32.2)#47 |
| 48. | Stones Landing | 35.6% | 4.1%(+31.5)#3 | 3.5%(+32.1)#48 |
| 49. | Big Horn | 35.4% | 1.4%(+34.0)#1 | 3.5%(+31.9)#49 |
| 50. | Fort Fetter | 35.0% | 3.3%(+31.7)#2 | 3.5%(+31.5)#50 |
| 51. | Forsgate | 34.9% | 4.5%(+30.4)#2 | 3.5%(+31.4)#51 |
| 52. | Au Sable Forks | 34.7% | 3.1%(+31.6)#2 | 3.5%(+31.2)#52 |
| 53. | Goose Creek | 34.6% | 6.2%(+28.4)#3 | 3.5%(+31.1)#53 |
| 54. | Yukon | 34.4% | 3.3%(+31.1)#3 | 3.5%(+30.9)#54 |
| 55. | Redmond | 34.1% | 6.1%(+28.1)#5 | 3.5%(+30.6)#55 |
| 56. | Franks Field | 34.1% | 3.0%(+31.1)#2 | 3.5%(+30.6)#56 |
| 57. | Hartland | 33.3% | 2.8%(+30.5)#2 | 3.5%(+29.8)#57 |
| 58. | Black Springs | 33.3% | 2.2%(+31.2)#1 | 3.5%(+29.8)#58 |
| 59. | Hat Creek | 33.3% | 4.1%(+29.2)#4 | 3.5%(+29.8)#59 |
| 60. | Climax | 33.3% | 3.0%(+30.4)#2 | 3.5%(+29.8)#60 |
| 61. | Las Palmas | 33.3% | 3.4%(+29.9)#6 | 3.5%(+29.8)#61 |
| 62. | La Grande | 32.6% | 6.1%(+26.5)#6 | 3.5%(+29.1)#62 |
| 63. | Wadsworth | 31.5% | 3.1%(+28.4)#3 | 3.5%(+28.0)#63 |
| 64. | Oldwick | 31.4% | 4.5%(+26.9)#3 | 3.5%(+27.9)#64 |
| 65. | Alhambra Valley | 31.3% | 4.1%(+27.2)#5 | 3.5%(+27.8)#65 |
| 66. | Benton | 30.8% | 4.1%(+26.7)#6 | 3.5%(+27.2)#66 |
| 67. | Antreville | 30.3% | 2.4%(+27.8)#2 | 3.5%(+26.7)#67 |
| 68. | Manter | 30.0% | 3.0%(+27.0)#3 | 3.5%(+26.5)#68 |
| 69. | Curryville | 30.0% | 3.3%(+26.7)#4 | 3.5%(+26.5)#69 |
| 70. | Fort Wingate | 29.9% | 2.4%(+27.4)#1 | 3.5%(+26.3)#70 |
| 71. | Marietta | 29.6% | 2.4%(+27.2)#6 | 3.5%(+26.0)#71 |
| 72. | Bucyrus | 29.5% | 3.0%(+26.6)#4 | 3.5%(+26.0)#72 |
| 73. | Peak | 29.4% | 2.4%(+27.0)#3 | 3.5%(+25.9)#73 |
| 74. | Lawtonka Acres | 28.9% | 2.3%(+26.6)#3 | 3.5%(+25.4)#74 |
| 75. | Bethlehem | 28.8% | 4.1%(+24.8)#1 | 3.5%(+25.3)#75 |
| 76. | Edmund | 28.6% | 3.0%(+25.6)#3 | 3.5%(+25.0)#76 |
| 77. | Flat Lick | 28.5% | 2.2%(+26.3)#2 | 3.5%(+24.9)#77 |
| 78. | Sunnyvale | 28.3% | 4.1%(+24.2)#7 | 3.5%(+24.8)#78 |
| 79. | Bear Valley Cdp Alpine County | 28.3% | 4.1%(+24.2)#8 | 3.5%(+24.7)#79 |
| 80. | Kings Valley | 28.2% | 3.5%(+24.8)#3 | 3.5%(+24.7)#80 |
| 81. | Verlot | 28.0% | 6.1%(+21.9)#7 | 3.5%(+24.5)#81 |
| 82. | Brandy Station | 28.0% | 6.2%(+21.8)#4 | 3.5%(+24.5)#82 |
| 83. | Nickerson | 27.9% | 3.2%(+24.8)#3 | 3.5%(+24.4)#83 |
| 84. | Moorefield | 27.9% | 6.2%(+21.7)#5 | 3.5%(+24.4)#84 |
| 85. | Williams Canyon | 27.8% | 4.1%(+23.7)#9 | 3.5%(+24.3)#85 |
| 86. | Murphy | 27.7% | 2.3%(+25.3)#4 | 3.5%(+24.1)#86 |
| 87. | Aullville | 27.5% | 3.2%(+24.3)#1 | 3.5%(+23.9)#87 |
| 88. | Silesia | 27.3% | 2.2%(+25.1)#3 | 3.5%(+23.7)#88 |
| 89. | Mineral | 27.1% | 4.1%(+23.0)#10 | 3.5%(+23.6)#89 |
| 90. | Midpines | 27.0% | 4.1%(+22.9)#11 | 3.5%(+23.5)#90 |
| 91. | Brambleton | 26.9% | 6.2%(+20.6)#6 | 3.5%(+23.3)#91 |
| 92. | Navy | 26.9% | 6.2%(+20.6)#7 | 3.5%(+23.3)#92 |
| 93. | Sully Square | 26.5% | 6.2%(+20.2)#8 | 3.5%(+22.9)#93 |
| 94. | Wilton Center | 26.4% | 3.6%(+22.8)#1 | 3.5%(+22.9)#94 |
| 95. | Avalon | 26.1% | 3.7%(+22.4)#1 | 3.5%(+22.6)#95 |
| 96. | Tall Timbers | 25.9% | 6.1%(+19.8)#1 | 3.5%(+22.4)#96 |
| 97. | Floris | 25.5% | 6.2%(+19.3)#9 | 3.5%(+22.0)#97 |
| 98. | Bergland | 25.5% | 2.9%(+22.6)#1 | 3.5%(+22.0)#98 |
| 99. | Spaulding | 25.5% | 4.1%(+21.4)#12 | 3.5%(+21.9)#99 |
| 100. | Monroe Manor | 25.3% | 4.5%(+20.7)#4 | 3.5%(+21.7)#100 |
Common Questions
What are the Top 10 Cities with the Highest Percentage of Population Employed in Computer & Mathematics in the United States?
Top 10 Cities with the Highest Percentage of Population Employed in Computer & Mathematics in the United States are:
#1
100.0%
#2
100.0%
#3
100.0%
#4
100.0%
#5
77.4%
#6
70.5%
#7
60.9%
#8
58.6%
#9
56.9%
#10
54.5%
What city has the Highest Percentage of Population Employed in Computer & Mathematics in the United States?
Aripeka has the Highest Percentage of Population Employed in Computer & Mathematics in the United States with 100.0%.
What is the Percentage of Population Employed in Computer & Mathematics in the United States?
Percentage of Population Employed in Computer & Mathematics in the United States is 3.5%.