Cities with the Highest Percentage of Population Employed in Computer & Mathematics in Minnesota
RELATED REPORTS & OPTIONS
Computer & Mathematics
Minnesota
Compare Cities
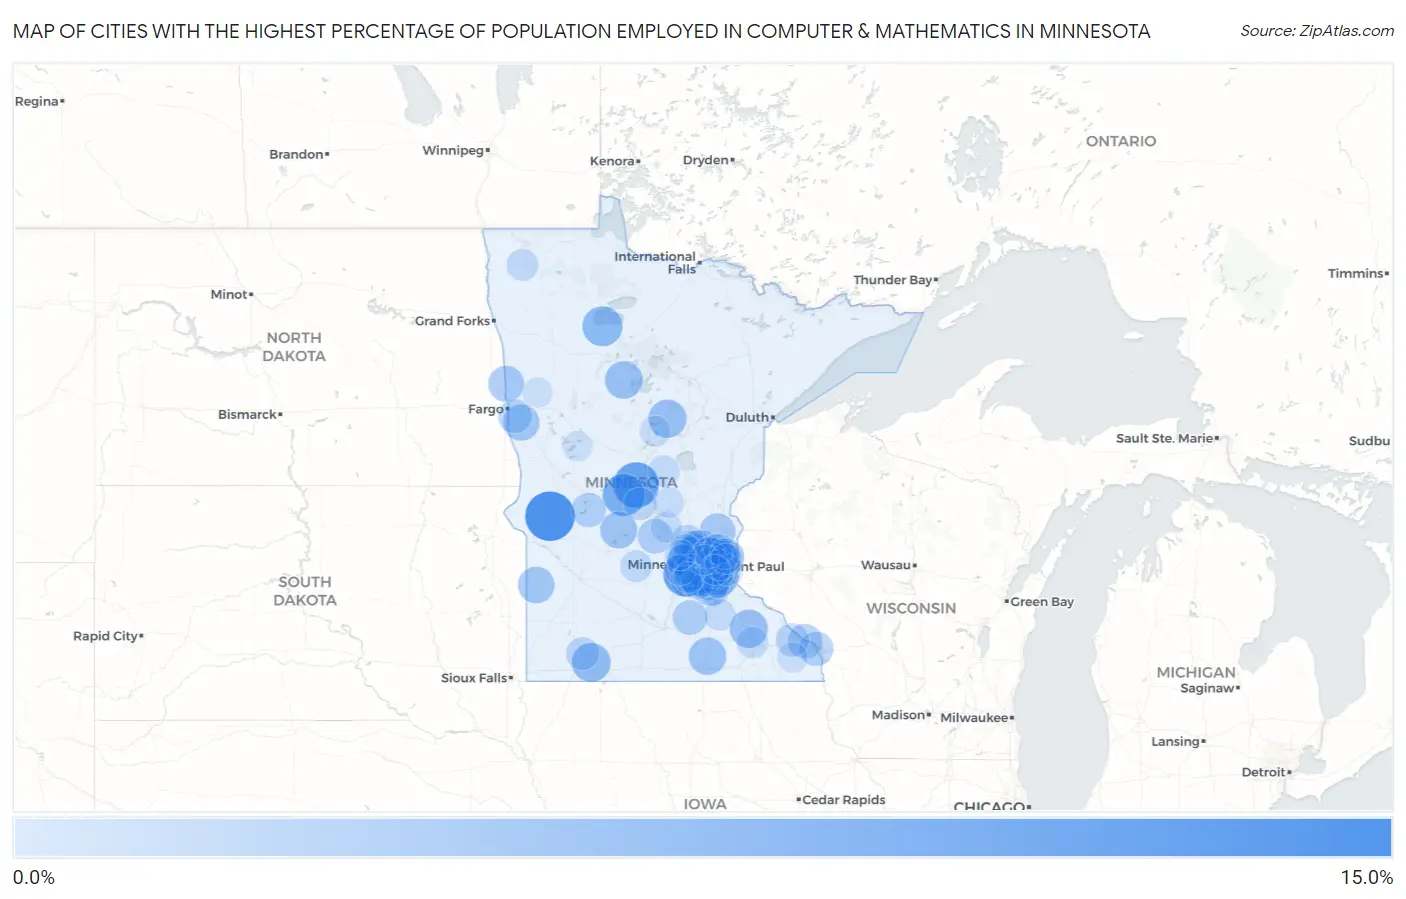
Map of Cities with the Highest Percentage of Population Employed in Computer & Mathematics in Minnesota
0.0%
15.0%
Cities with the Highest Percentage of Population Employed in Computer & Mathematics in Minnesota
| City | % Employed | vs State | vs National | |
| 1. | Alberta | 12.9% | 3.9%(+8.98)#1 | 3.5%(+9.33)#440 |
| 2. | Victoria | 11.3% | 3.9%(+7.44)#2 | 3.5%(+7.79)#556 |
| 3. | Flensburg | 11.0% | 3.9%(+7.14)#3 | 3.5%(+7.48)#590 |
| 4. | Grey Eagle | 9.7% | 3.9%(+5.78)#4 | 3.5%(+6.13)#800 |
| 5. | Eden Prairie | 8.9% | 3.9%(+5.01)#5 | 3.5%(+5.36)#963 |
| 6. | Little Rock | 8.7% | 3.9%(+4.84)#6 | 3.5%(+5.18)#1,004 |
| 7. | Little Canada | 8.3% | 3.9%(+4.48)#7 | 3.5%(+4.82)#1,101 |
| 8. | Okabena | 8.2% | 3.9%(+4.36)#8 | 3.5%(+4.71)#1,136 |
| 9. | Minnetonka | 8.1% | 3.9%(+4.19)#9 | 3.5%(+4.54)#1,196 |
| 10. | Inver Grove Heights | 8.0% | 3.9%(+4.09)#10 | 3.5%(+4.44)#1,238 |
| 11. | Eagan | 8.0% | 3.9%(+4.08)#11 | 3.5%(+4.43)#1,243 |
| 12. | Mahtomedi | 7.9% | 3.9%(+4.06)#12 | 3.5%(+4.40)#1,251 |
| 13. | Plymouth | 7.9% | 3.9%(+4.04)#13 | 3.5%(+4.39)#1,257 |
| 14. | Emily | 7.9% | 3.9%(+4.03)#14 | 3.5%(+4.38)#1,261 |
| 15. | Oronoco | 7.9% | 3.9%(+4.00)#15 | 3.5%(+4.35)#1,274 |
| 16. | Laporte | 7.7% | 3.9%(+3.82)#16 | 3.5%(+4.17)#1,340 |
| 17. | Vadnais Heights | 7.6% | 3.9%(+3.76)#17 | 3.5%(+4.11)#1,355 |
| 18. | Maple Grove | 7.6% | 3.9%(+3.75)#18 | 3.5%(+4.10)#1,360 |
| 19. | Geneva | 7.6% | 3.9%(+3.71)#19 | 3.5%(+4.06)#1,373 |
| 20. | Regal | 7.4% | 3.9%(+3.54)#20 | 3.5%(+3.88)#1,435 |
| 21. | Wayzata | 7.3% | 3.9%(+3.38)#21 | 3.5%(+3.73)#1,493 |
| 22. | Canby | 7.2% | 3.9%(+3.37)#22 | 3.5%(+3.72)#1,495 |
| 23. | Richfield | 7.2% | 3.9%(+3.28)#23 | 3.5%(+3.63)#1,529 |
| 24. | Baker | 7.1% | 3.9%(+3.27)#24 | 3.5%(+3.62)#1,538 |
| 25. | Apple Valley | 7.1% | 3.9%(+3.23)#25 | 3.5%(+3.58)#1,556 |
| 26. | Perley | 7.0% | 3.9%(+3.15)#26 | 3.5%(+3.49)#1,591 |
| 27. | St Louis Park | 7.0% | 3.9%(+3.10)#27 | 3.5%(+3.45)#1,609 |
| 28. | Martin Lake | 6.9% | 3.9%(+3.00)#28 | 3.5%(+3.34)#1,669 |
| 29. | Arden Hills | 6.8% | 3.9%(+2.98)#29 | 3.5%(+3.33)#1,675 |
| 30. | Edina | 6.8% | 3.9%(+2.97)#30 | 3.5%(+3.32)#1,683 |
| 31. | Roseville | 6.8% | 3.9%(+2.95)#31 | 3.5%(+3.30)#1,695 |
| 32. | Champlin | 6.7% | 3.9%(+2.85)#32 | 3.5%(+3.20)#1,749 |
| 33. | Maple Plain | 6.6% | 3.9%(+2.77)#33 | 3.5%(+3.12)#1,791 |
| 34. | Golden Valley | 6.6% | 3.9%(+2.74)#34 | 3.5%(+3.08)#1,807 |
| 35. | Shoreview | 6.6% | 3.9%(+2.68)#35 | 3.5%(+3.03)#1,840 |
| 36. | Fairhaven | 6.5% | 3.9%(+2.60)#36 | 3.5%(+2.95)#1,882 |
| 37. | Kilkenny | 6.5% | 3.9%(+2.58)#37 | 3.5%(+2.93)#1,896 |
| 38. | Hopkins | 6.4% | 3.9%(+2.50)#38 | 3.5%(+2.85)#1,926 |
| 39. | Mounds View | 6.4% | 3.9%(+2.48)#39 | 3.5%(+2.83)#1,939 |
| 40. | Homer | 6.3% | 3.9%(+2.48)#40 | 3.5%(+2.82)#1,946 |
| 41. | Dakota | 6.3% | 3.9%(+2.46)#41 | 3.5%(+2.80)#1,953 |
| 42. | Glenwood | 6.3% | 3.9%(+2.44)#42 | 3.5%(+2.79)#1,961 |
| 43. | Lakeville | 6.3% | 3.9%(+2.38)#43 | 3.5%(+2.73)#1,988 |
| 44. | Circle Pines | 6.1% | 3.9%(+2.26)#44 | 3.5%(+2.60)#2,084 |
| 45. | Bloomington | 6.1% | 3.9%(+2.23)#45 | 3.5%(+2.58)#2,097 |
| 46. | Sabin | 6.1% | 3.9%(+2.22)#46 | 3.5%(+2.57)#2,106 |
| 47. | Corcoran | 6.0% | 3.9%(+2.15)#47 | 3.5%(+2.50)#2,153 |
| 48. | Mendota Heights | 6.0% | 3.9%(+2.14)#48 | 3.5%(+2.49)#2,159 |
| 49. | Lauderdale | 6.0% | 3.9%(+2.09)#49 | 3.5%(+2.44)#2,197 |
| 50. | Stockton | 5.9% | 3.9%(+1.99)#50 | 3.5%(+2.34)#2,269 |
| 51. | Willernie | 5.9% | 3.9%(+1.98)#51 | 3.5%(+2.33)#2,277 |
| 52. | Otsego | 5.7% | 3.9%(+1.87)#52 | 3.5%(+2.22)#2,362 |
| 53. | Mendota | 5.7% | 3.9%(+1.84)#53 | 3.5%(+2.19)#2,380 |
| 54. | Dundee | 5.7% | 3.9%(+1.84)#54 | 3.5%(+2.19)#2,382 |
| 55. | Minneapolis | 5.7% | 3.9%(+1.79)#55 | 3.5%(+2.14)#2,435 |
| 56. | Burnsville | 5.6% | 3.9%(+1.78)#56 | 3.5%(+2.13)#2,445 |
| 57. | Mound | 5.6% | 3.9%(+1.77)#57 | 3.5%(+2.11)#2,452 |
| 58. | St Anthony City Hennepin And Ramsey Counties | 5.6% | 3.9%(+1.76)#58 | 3.5%(+2.11)#2,455 |
| 59. | West St Paul | 5.6% | 3.9%(+1.75)#59 | 3.5%(+2.10)#2,465 |
| 60. | Holdingford | 5.6% | 3.9%(+1.71)#60 | 3.5%(+2.06)#2,502 |
| 61. | Marion | 5.5% | 3.9%(+1.59)#61 | 3.5%(+1.94)#2,603 |
| 62. | Rogers | 5.4% | 3.9%(+1.48)#62 | 3.5%(+1.83)#2,724 |
| 63. | Dayton | 5.4% | 3.9%(+1.48)#63 | 3.5%(+1.83)#2,727 |
| 64. | Sunfish Lake | 5.3% | 3.9%(+1.47)#64 | 3.5%(+1.82)#2,731 |
| 65. | Chanhassen | 5.3% | 3.9%(+1.43)#65 | 3.5%(+1.78)#2,770 |
| 66. | Crystal | 5.3% | 3.9%(+1.42)#66 | 3.5%(+1.76)#2,784 |
| 67. | Shorewood | 5.3% | 3.9%(+1.41)#67 | 3.5%(+1.76)#2,788 |
| 68. | Karlstad | 5.3% | 3.9%(+1.41)#68 | 3.5%(+1.76)#2,796 |
| 69. | Cedar Mills | 5.3% | 3.9%(+1.39)#69 | 3.5%(+1.74)#2,808 |
| 70. | Savage | 5.2% | 3.9%(+1.37)#70 | 3.5%(+1.71)#2,821 |
| 71. | Hanover | 5.2% | 3.9%(+1.36)#71 | 3.5%(+1.70)#2,829 |
| 72. | Rochester | 5.2% | 3.9%(+1.31)#72 | 3.5%(+1.65)#2,885 |
| 73. | Harding | 5.2% | 3.9%(+1.30)#73 | 3.5%(+1.65)#2,891 |
| 74. | Falcon Heights | 5.2% | 3.9%(+1.28)#74 | 3.5%(+1.63)#2,912 |
| 75. | Independence | 5.1% | 3.9%(+1.27)#75 | 3.5%(+1.62)#2,925 |
| 76. | Shakopee | 5.1% | 3.9%(+1.25)#76 | 3.5%(+1.60)#2,948 |
| 77. | Farmington | 5.1% | 3.9%(+1.24)#77 | 3.5%(+1.58)#2,962 |
| 78. | New Brighton | 5.1% | 3.9%(+1.22)#78 | 3.5%(+1.56)#2,983 |
| 79. | Carver | 5.1% | 3.9%(+1.18)#79 | 3.5%(+1.53)#3,024 |
| 80. | Clear Lake | 5.0% | 3.9%(+1.18)#80 | 3.5%(+1.52)#3,033 |
| 81. | Nerstrand | 5.0% | 3.9%(+1.17)#81 | 3.5%(+1.52)#3,040 |
| 82. | Rosemount | 5.0% | 3.9%(+1.13)#82 | 3.5%(+1.48)#3,083 |
| 83. | Prior Lake | 5.0% | 3.9%(+1.13)#83 | 3.5%(+1.48)#3,084 |
| 84. | Pickwick | 4.9% | 3.9%(+1.05)#84 | 3.5%(+1.39)#3,181 |
| 85. | Woodbury | 4.9% | 3.9%(+1.03)#85 | 3.5%(+1.38)#3,198 |
| 86. | Breezy Point | 4.9% | 3.9%(+1.01)#86 | 3.5%(+1.36)#3,221 |
| 87. | Gilman | 4.8% | 3.9%(+0.967)#87 | 3.5%(+1.31)#3,279 |
| 88. | Spring Lake Park | 4.8% | 3.9%(+0.934)#88 | 3.5%(+1.28)#3,319 |
| 89. | St Bonifacius | 4.8% | 3.9%(+0.898)#89 | 3.5%(+1.25)#3,357 |
| 90. | Robbinsdale | 4.7% | 3.9%(+0.863)#90 | 3.5%(+1.21)#3,396 |
| 91. | Chaska | 4.7% | 3.9%(+0.837)#91 | 3.5%(+1.18)#3,430 |
| 92. | Rockford | 4.7% | 3.9%(+0.832)#92 | 3.5%(+1.18)#3,438 |
| 93. | Maplewood | 4.7% | 3.9%(+0.827)#93 | 3.5%(+1.17)#3,443 |
| 94. | Lino Lakes | 4.7% | 3.9%(+0.803)#94 | 3.5%(+1.15)#3,474 |
| 95. | Rushford Village | 4.7% | 3.9%(+0.791)#95 | 3.5%(+1.14)#3,493 |
| 96. | Dellwood | 4.6% | 3.9%(+0.767)#96 | 3.5%(+1.11)#3,520 |
| 97. | Ottertail | 4.6% | 3.9%(+0.743)#97 | 3.5%(+1.09)#3,549 |
| 98. | Ulen | 4.6% | 3.9%(+0.708)#98 | 3.5%(+1.06)#3,584 |
| 99. | Lilydale | 4.6% | 3.9%(+0.696)#99 | 3.5%(+1.04)#3,598 |
| 100. | Pine Springs | 4.6% | 3.9%(+0.696)#100 | 3.5%(+1.04)#3,600 |
Common Questions
What are the Top 10 Cities with the Highest Percentage of Population Employed in Computer & Mathematics in Minnesota?
Top 10 Cities with the Highest Percentage of Population Employed in Computer & Mathematics in Minnesota are:
#1
12.9%
#2
11.3%
#3
11.0%
#4
9.7%
#5
8.9%
#6
8.7%
#7
8.3%
#8
8.2%
#9
8.1%
#10
8.0%
What city has the Highest Percentage of Population Employed in Computer & Mathematics in Minnesota?
Alberta has the Highest Percentage of Population Employed in Computer & Mathematics in Minnesota with 12.9%.
What is the Percentage of Population Employed in Computer & Mathematics in the State of Minnesota?
Percentage of Population Employed in Computer & Mathematics in Minnesota is 3.9%.
What is the Percentage of Population Employed in Computer & Mathematics in the United States?
Percentage of Population Employed in Computer & Mathematics in the United States is 3.5%.