Vine Hill, CA Map & Demographics
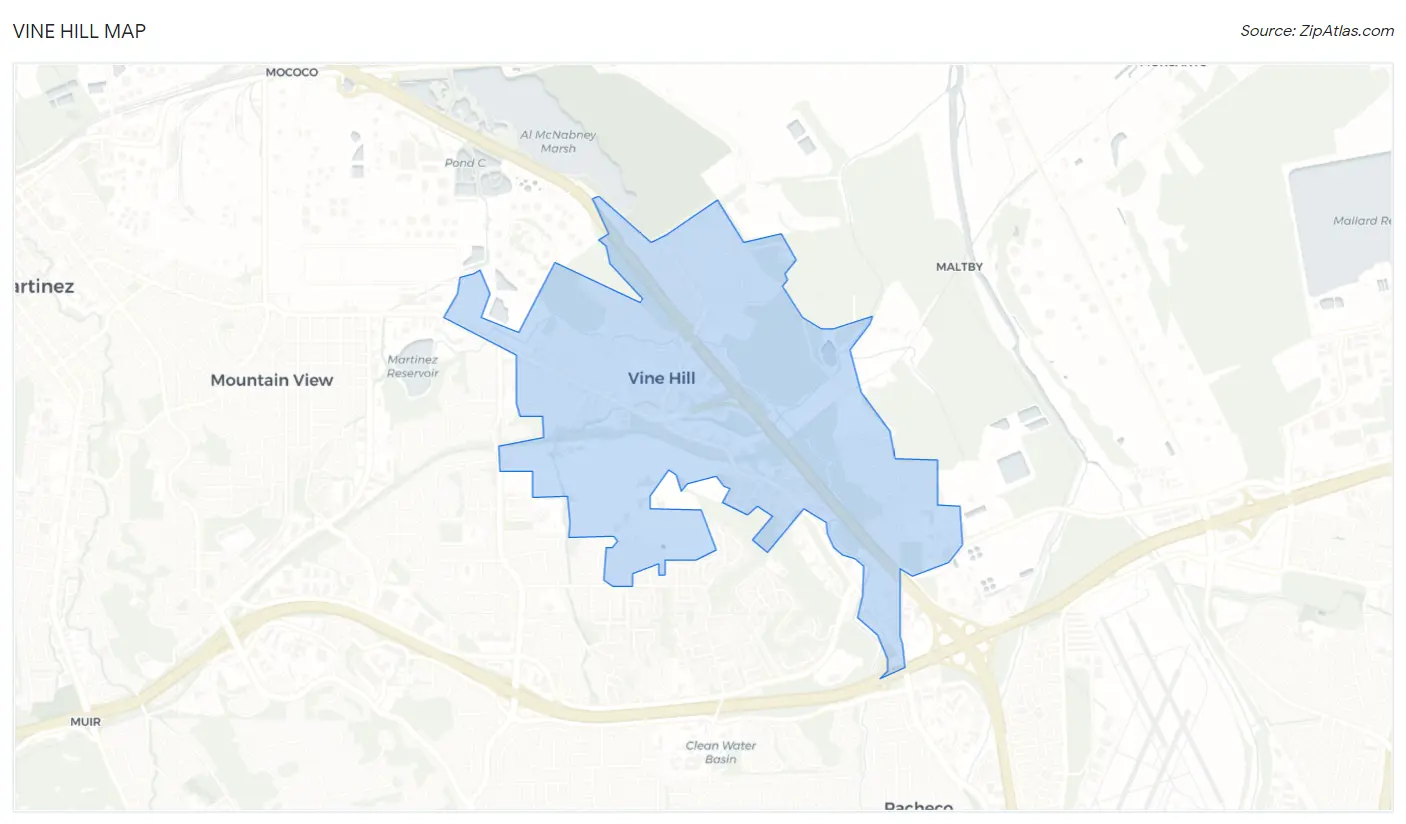
Vine Hill Map
Vine Hill Overview
$53,807
PER CAPITA INCOME
$150,278
AVG FAMILY INCOME
$123,523
AVG HOUSEHOLD INCOME
30.8%
WAGE / INCOME GAP [ % ]
69.2¢/ $1
WAGE / INCOME GAP [ $ ]
0.38
INEQUALITY / GINI INDEX
3,217
TOTAL POPULATION
1,684
MALE POPULATION
1,533
FEMALE POPULATION
109.85
MALES / 100 FEMALES
91.03
FEMALES / 100 MALES
37.9
MEDIAN AGE
3.4
AVG FAMILY SIZE
2.7
AVG HOUSEHOLD SIZE
1,728
LABOR FORCE [ PEOPLE ]
67.9%
PERCENT IN LABOR FORCE
7.5%
UNEMPLOYMENT RATE
Income in Vine Hill
Income Overview in Vine Hill
Per Capita Income in Vine Hill is $53,807, while median incomes of families and households are $150,278 and $123,523 respectively.
| Characteristic | Number | Measure |
| Per Capita Income | 3,217 | $53,807 |
| Median Family Income | 750 | $150,278 |
| Mean Family Income | 750 | $166,523 |
| Median Household Income | 1,187 | $123,523 |
| Mean Household Income | 1,187 | $142,327 |
| Income Deficit | 750 | $0 |
| Wage / Income Gap (%) | 3,217 | 30.76% |
| Wage / Income Gap ($) | 3,217 | 69.24¢ per $1 |
| Gini / Inequality Index | 3,217 | 0.38 |
Earnings by Sex in Vine Hill
Average Earnings in Vine Hill are $77,874, $83,333 for men and $57,702 for women, a difference of 30.8%.
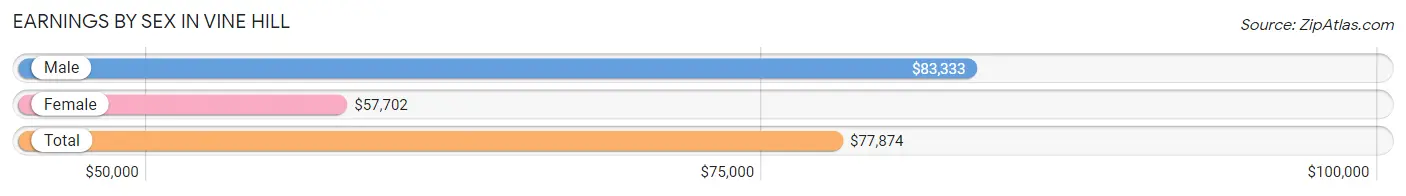
| Sex | Number | Average Earnings |
| Male | 1,062 (59.3%) | $83,333 |
| Female | 729 (40.7%) | $57,702 |
| Total | 1,791 (100.0%) | $77,874 |
Earnings by Sex by Income Bracket in Vine Hill
The most common earnings brackets in Vine Hill are $100,000+ for men (447 | 42.1%) and $100,000+ for women (193 | 26.5%).
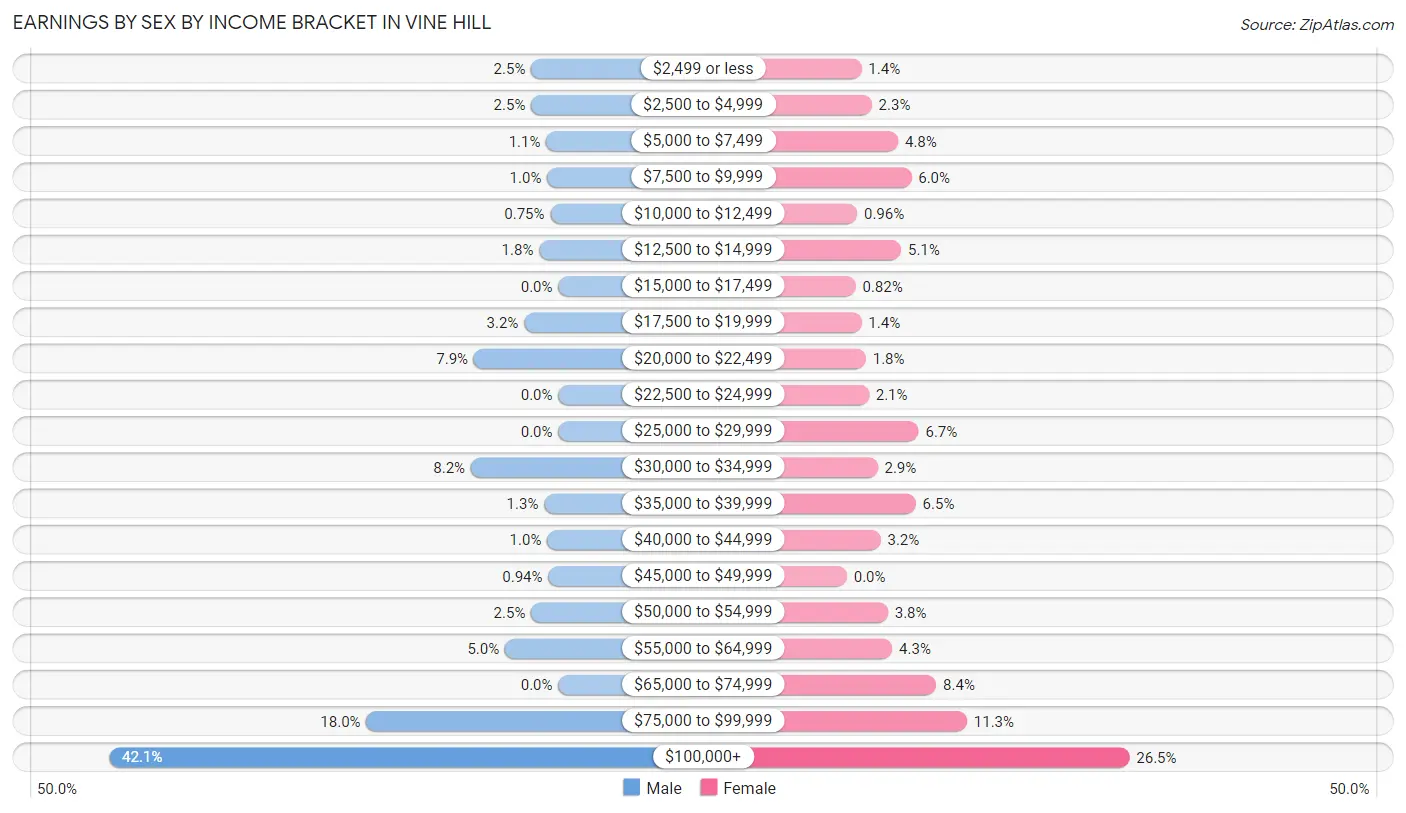
| Income | Male | Female |
| $2,499 or less | 27 (2.5%) | 10 (1.4%) |
| $2,500 to $4,999 | 27 (2.5%) | 17 (2.3%) |
| $5,000 to $7,499 | 12 (1.1%) | 35 (4.8%) |
| $7,500 to $9,999 | 11 (1.0%) | 44 (6.0%) |
| $10,000 to $12,499 | 8 (0.7%) | 7 (1.0%) |
| $12,500 to $14,999 | 19 (1.8%) | 37 (5.1%) |
| $15,000 to $17,499 | 0 (0.0%) | 6 (0.8%) |
| $17,500 to $19,999 | 34 (3.2%) | 10 (1.4%) |
| $20,000 to $22,499 | 84 (7.9%) | 13 (1.8%) |
| $22,500 to $24,999 | 0 (0.0%) | 15 (2.1%) |
| $25,000 to $29,999 | 0 (0.0%) | 49 (6.7%) |
| $30,000 to $34,999 | 87 (8.2%) | 21 (2.9%) |
| $35,000 to $39,999 | 14 (1.3%) | 47 (6.5%) |
| $40,000 to $44,999 | 11 (1.0%) | 23 (3.2%) |
| $45,000 to $49,999 | 10 (0.9%) | 0 (0.0%) |
| $50,000 to $54,999 | 27 (2.5%) | 28 (3.8%) |
| $55,000 to $64,999 | 53 (5.0%) | 31 (4.3%) |
| $65,000 to $74,999 | 0 (0.0%) | 61 (8.4%) |
| $75,000 to $99,999 | 191 (18.0%) | 82 (11.3%) |
| $100,000+ | 447 (42.1%) | 193 (26.5%) |
| Total | 1,062 (100.0%) | 729 (100.0%) |
Earnings by Sex by Educational Attainment in Vine Hill
Average earnings in Vine Hill are $87,500 for men and $65,798 for women, a difference of 24.8%. Men with an educational attainment of graduate degree enjoy the highest average annual earnings of $165,114, while those with college or associate's degree education earn the least with $62,969. Women with an educational attainment of bachelor's degree earn the most with the average annual earnings of $67,260, while those with high school diploma education have the smallest earnings of $14,257.
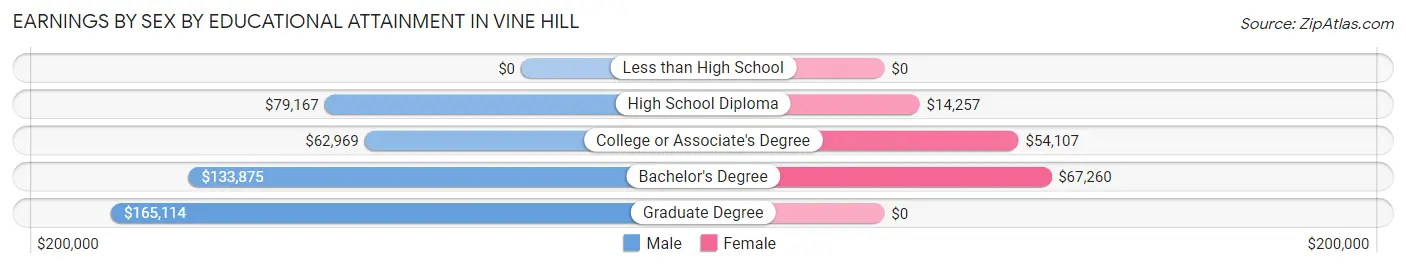
| Educational Attainment | Male Income | Female Income |
| Less than High School | - | - |
| High School Diploma | $79,167 | $14,257 |
| College or Associate's Degree | $62,969 | $54,107 |
| Bachelor's Degree | $133,875 | $67,260 |
| Graduate Degree | $165,114 | $0 |
| Total | $87,500 | $65,798 |
Family Income in Vine Hill
Family Income Brackets in Vine Hill
According to the Vine Hill family income data, there are 263 families falling into the $200,000+ income range, which is the most common income bracket and makes up 35.1% of all families.
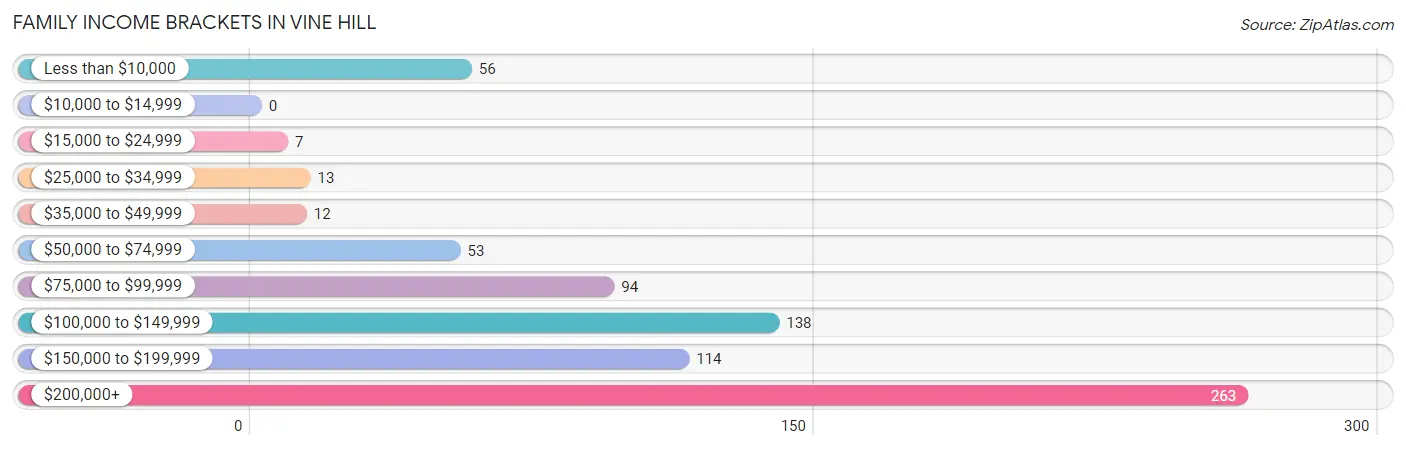
| Income Bracket | # Families | % Families |
| Less than $10,000 | 56 | 7.5% |
| $10,000 to $14,999 | 0 | 0.0% |
| $15,000 to $24,999 | 7 | 0.9% |
| $25,000 to $34,999 | 13 | 1.7% |
| $35,000 to $49,999 | 12 | 1.6% |
| $50,000 to $74,999 | 53 | 7.1% |
| $75,000 to $99,999 | 94 | 12.5% |
| $100,000 to $149,999 | 138 | 18.4% |
| $150,000 to $199,999 | 114 | 15.2% |
| $200,000+ | 263 | 35.1% |
Family Income by Famaliy Size in Vine Hill
4-person families (173 | 23.1%) account for the highest median family income in Vine Hill with $186,125 per family, while 2-person families (286 | 38.1%) have the highest median income of $78,125 per family member.
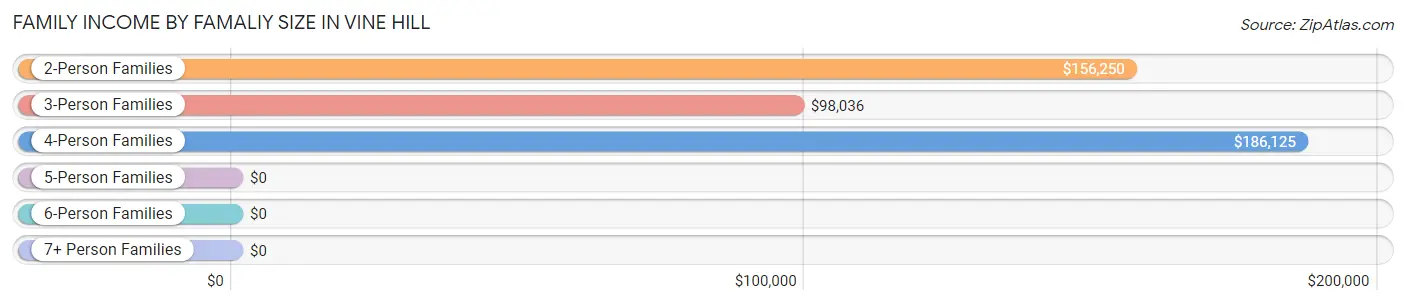
| Income Bracket | # Families | Median Income |
| 2-Person Families | 286 (38.1%) | $156,250 |
| 3-Person Families | 207 (27.6%) | $98,036 |
| 4-Person Families | 173 (23.1%) | $186,125 |
| 5-Person Families | 15 (2.0%) | $0 |
| 6-Person Families | 34 (4.5%) | $0 |
| 7+ Person Families | 35 (4.7%) | $0 |
| Total | 750 (100.0%) | $150,278 |
Family Income by Number of Earners in Vine Hill

| Number of Earners | # Families | Median Income |
| No Earners | 81 (10.8%) | $0 |
| 1 Earner | 152 (20.3%) | $86,324 |
| 2 Earners | 429 (57.2%) | $215,170 |
| 3+ Earners | 88 (11.7%) | $185,250 |
| Total | 750 (100.0%) | $150,278 |
Household Income in Vine Hill
Household Income Brackets in Vine Hill
With 288 households falling in the category, the $200,000+ income range is the most frequent in Vine Hill, accounting for 24.3% of all households. In contrast, only 8 households (0.7%) fall into the $10,000 to $14,999 income bracket, making it the least populous group.
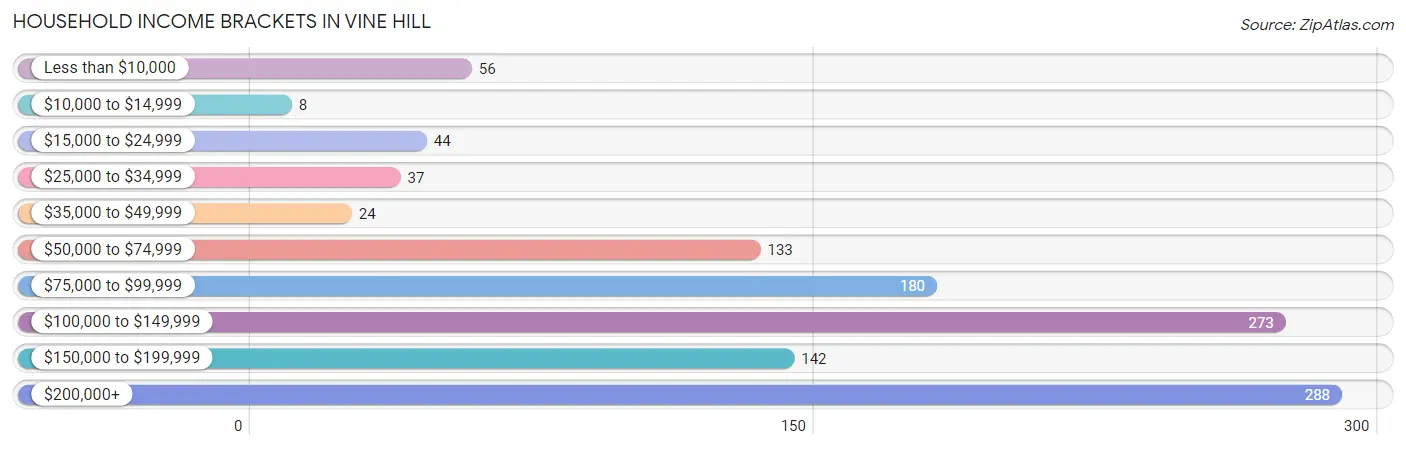
| Income Bracket | # Households | % Households |
| Less than $10,000 | 56 | 4.7% |
| $10,000 to $14,999 | 8 | 0.7% |
| $15,000 to $24,999 | 44 | 3.7% |
| $25,000 to $34,999 | 37 | 3.1% |
| $35,000 to $49,999 | 24 | 2.0% |
| $50,000 to $74,999 | 133 | 11.2% |
| $75,000 to $99,999 | 180 | 15.2% |
| $100,000 to $149,999 | 273 | 23.0% |
| $150,000 to $199,999 | 142 | 12.0% |
| $200,000+ | 288 | 24.3% |
Household Income by Householder Age in Vine Hill
The median household income in Vine Hill is $123,523, with the highest median household income of $203,750 found in the 25 to 44 years age bracket for the primary householder. A total of 345 households (29.1%) fall into this category.
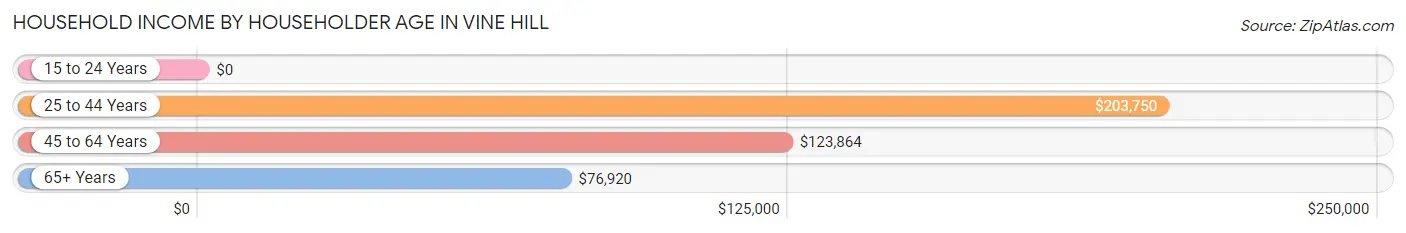
| Income Bracket | # Households | Median Income |
| 15 to 24 Years | 0 (0.0%) | $0 |
| 25 to 44 Years | 345 (29.1%) | $203,750 |
| 45 to 64 Years | 606 (51.0%) | $123,864 |
| 65+ Years | 236 (19.9%) | $76,920 |
| Total | 1,187 (100.0%) | $123,523 |
Poverty in Vine Hill
Income Below Poverty by Sex and Age in Vine Hill
With 5.5% poverty level for males and 13.8% for females among the residents of Vine Hill, under 5 year old males and 18 to 24 year old females are the most vulnerable to poverty, with 46 males (63.0%) and 50 females (41.7%) in their respective age groups living below the poverty level.
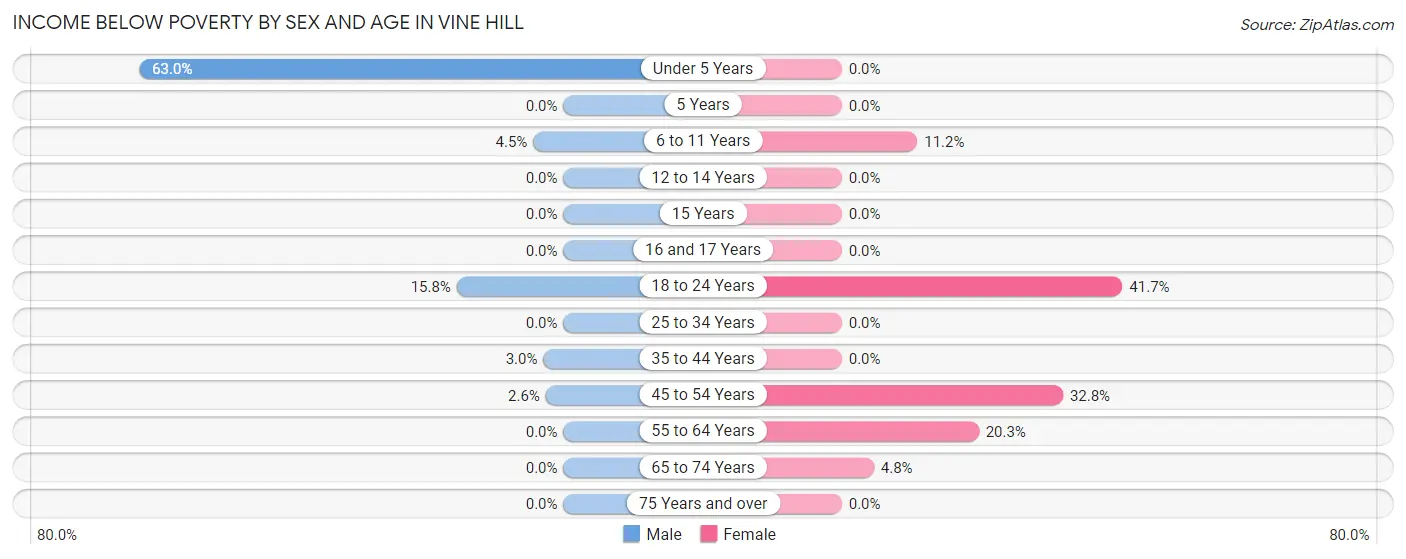
| Age Bracket | Male | Female |
| Under 5 Years | 46 (63.0%) | 0 (0.0%) |
| 5 Years | 0 (0.0%) | 0 (0.0%) |
| 6 to 11 Years | 12 (4.5%) | 12 (11.2%) |
| 12 to 14 Years | 0 (0.0%) | 0 (0.0%) |
| 15 Years | 0 (0.0%) | 0 (0.0%) |
| 16 and 17 Years | 0 (0.0%) | 0 (0.0%) |
| 18 to 24 Years | 16 (15.8%) | 50 (41.7%) |
| 25 to 34 Years | 0 (0.0%) | 0 (0.0%) |
| 35 to 44 Years | 11 (3.0%) | 0 (0.0%) |
| 45 to 54 Years | 8 (2.6%) | 110 (32.8%) |
| 55 to 64 Years | 0 (0.0%) | 37 (20.3%) |
| 65 to 74 Years | 0 (0.0%) | 3 (4.8%) |
| 75 Years and over | 0 (0.0%) | 0 (0.0%) |
| Total | 93 (5.5%) | 212 (13.8%) |
Income Above Poverty by Sex and Age in Vine Hill
According to the poverty statistics in Vine Hill, males aged 5 years and females aged under 5 years are the age groups that are most secure financially, with 100.0% of males and 100.0% of females in these age groups living above the poverty line.
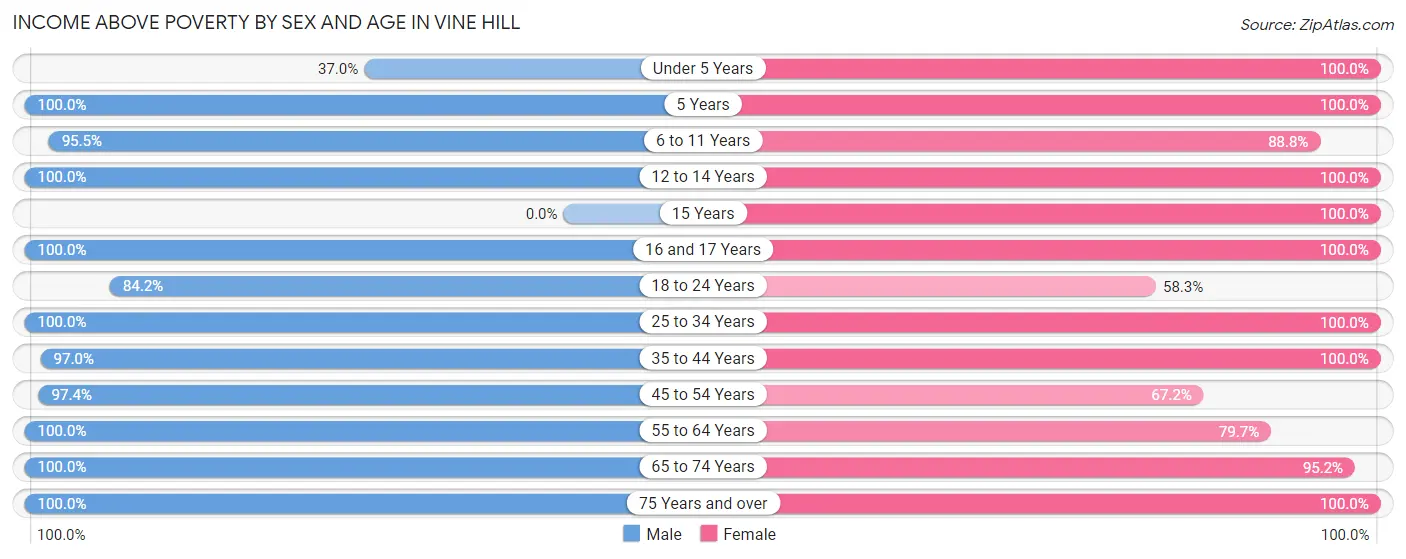
| Age Bracket | Male | Female |
| Under 5 Years | 27 (37.0%) | 130 (100.0%) |
| 5 Years | 21 (100.0%) | 10 (100.0%) |
| 6 to 11 Years | 256 (95.5%) | 95 (88.8%) |
| 12 to 14 Years | 23 (100.0%) | 35 (100.0%) |
| 15 Years | 0 (0.0%) | 5 (100.0%) |
| 16 and 17 Years | 66 (100.0%) | 13 (100.0%) |
| 18 to 24 Years | 85 (84.2%) | 70 (58.3%) |
| 25 to 34 Years | 154 (100.0%) | 166 (100.0%) |
| 35 to 44 Years | 358 (97.0%) | 229 (100.0%) |
| 45 to 54 Years | 297 (97.4%) | 225 (67.2%) |
| 55 to 64 Years | 182 (100.0%) | 145 (79.7%) |
| 65 to 74 Years | 51 (100.0%) | 60 (95.2%) |
| 75 Years and over | 71 (100.0%) | 138 (100.0%) |
| Total | 1,591 (94.5%) | 1,321 (86.2%) |
Income Below Poverty Among Married-Couple Families in Vine Hill
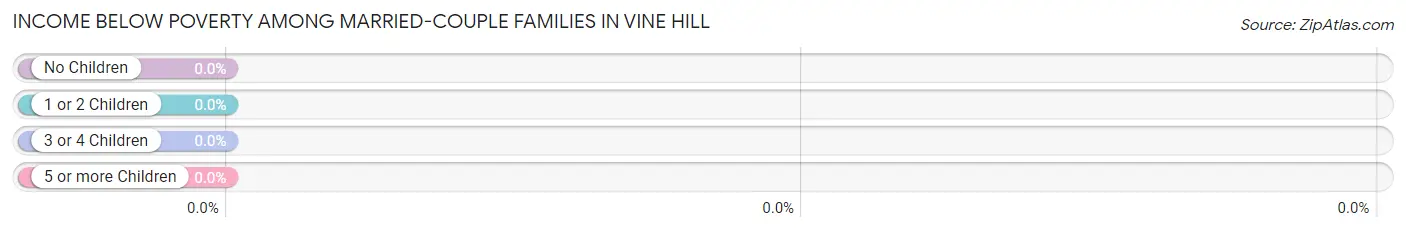
| Children | Above Poverty | Below Poverty |
| No Children | 282 (100.0%) | 0 (0.0%) |
| 1 or 2 Children | 201 (100.0%) | 0 (0.0%) |
| 3 or 4 Children | 28 (100.0%) | 0 (0.0%) |
| 5 or more Children | 22 (100.0%) | 0 (0.0%) |
| Total | 533 (100.0%) | 0 (0.0%) |
Income Below Poverty Among Single-Parent Households in Vine Hill
According to the poverty data in Vine Hill, 19.3% or 11 single-father households and 28.1% or 45 single-mother households are living below the poverty line. Among single-father households, those with 1 or 2 children have the highest poverty rate, with 11 households (42.3%) experiencing poverty. Likewise, among single-mother households, those with 1 or 2 children have the highest poverty rate, with 45 households (57.0%) falling below the poverty line.
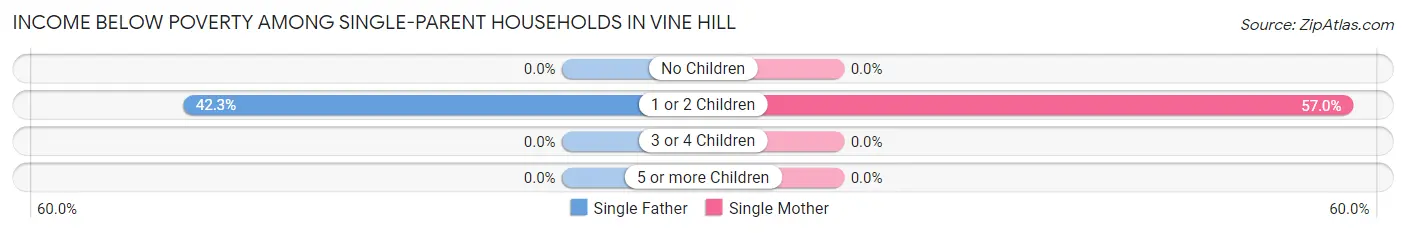
| Children | Single Father | Single Mother |
| No Children | 0 (0.0%) | 0 (0.0%) |
| 1 or 2 Children | 11 (42.3%) | 45 (57.0%) |
| 3 or 4 Children | 0 (0.0%) | 0 (0.0%) |
| 5 or more Children | 0 (0.0%) | 0 (0.0%) |
| Total | 11 (19.3%) | 45 (28.1%) |
Income Below Poverty Among Married-Couple vs Single-Parent Households in Vine Hill
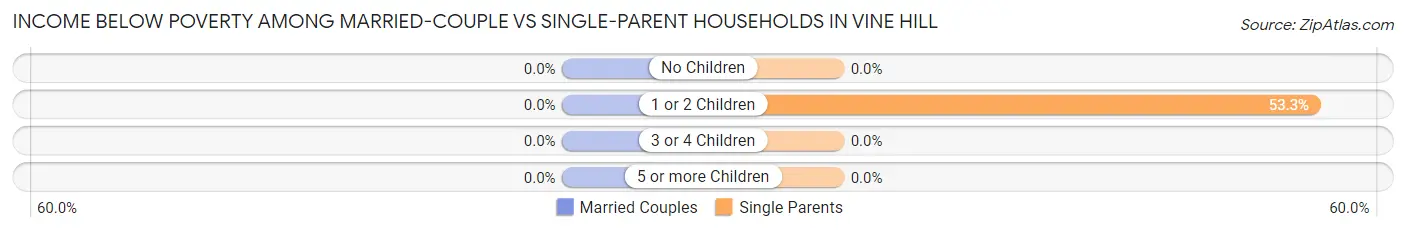
| Children | Married-Couple Families | Single-Parent Households |
| No Children | 0 (0.0%) | 0 (0.0%) |
| 1 or 2 Children | 0 (0.0%) | 56 (53.3%) |
| 3 or 4 Children | 0 (0.0%) | 0 (0.0%) |
| 5 or more Children | 0 (0.0%) | 0 (0.0%) |
| Total | 0 (0.0%) | 56 (25.8%) |
Race in Vine Hill
The most populous races in Vine Hill are White / Caucasian (2,201 | 68.4%), Hispanic or Latino (873 | 27.1%), and Some other Race (436 | 13.6%).
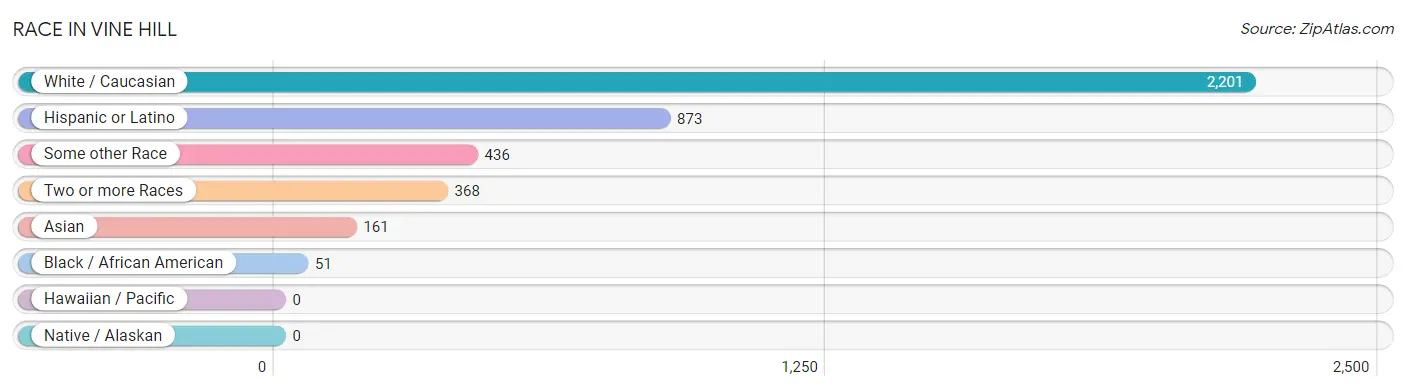
| Race | # Population | % Population |
| Asian | 161 | 5.0% |
| Black / African American | 51 | 1.6% |
| Hawaiian / Pacific | 0 | 0.0% |
| Hispanic or Latino | 873 | 27.1% |
| Native / Alaskan | 0 | 0.0% |
| White / Caucasian | 2,201 | 68.4% |
| Two or more Races | 368 | 11.4% |
| Some other Race | 436 | 13.6% |
| Total | 3,217 | 100.0% |
Ancestry in Vine Hill
The most populous ancestries reported in Vine Hill are Mexican (856 | 26.6%), Italian (326 | 10.1%), Irish (304 | 9.5%), German (222 | 6.9%), and English (220 | 6.8%), together accounting for 59.9% of all Vine Hill residents.
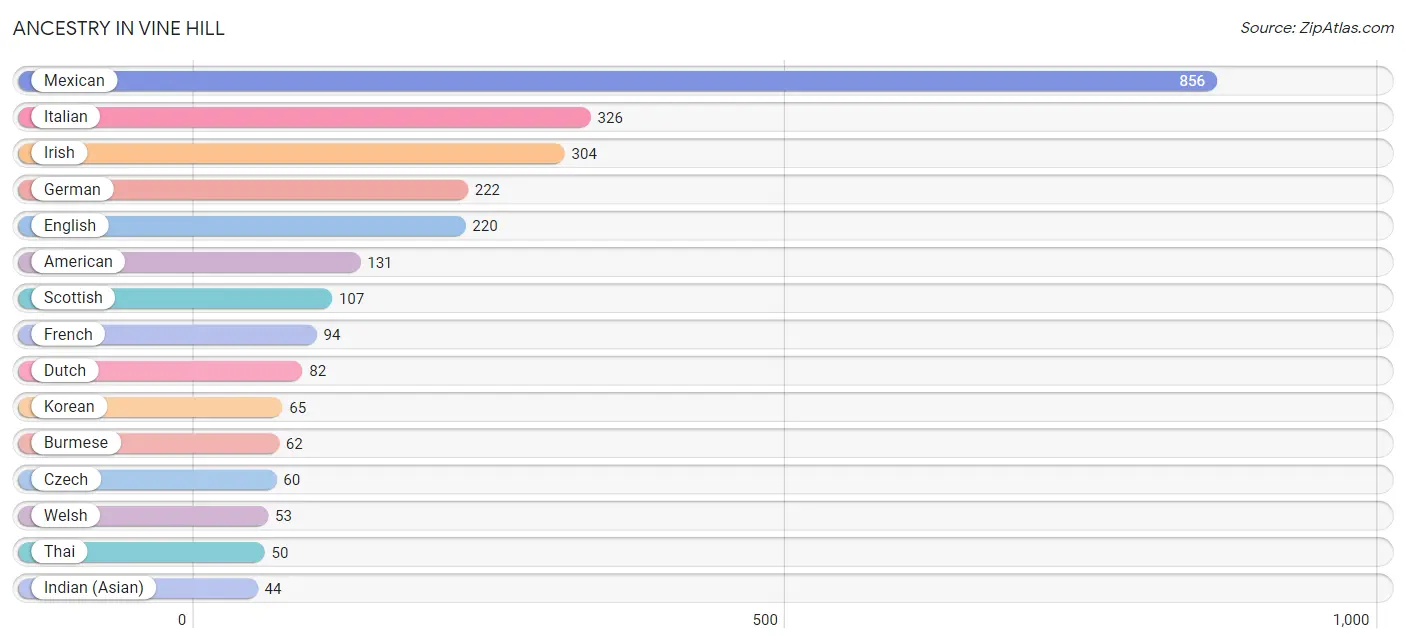
| Ancestry | # Population | % Population |
| African | 5 | 0.2% |
| American | 131 | 4.1% |
| Bhutanese | 41 | 1.3% |
| Brazilian | 9 | 0.3% |
| British | 15 | 0.5% |
| Burmese | 62 | 1.9% |
| Choctaw | 18 | 0.6% |
| Czech | 60 | 1.9% |
| Danish | 8 | 0.3% |
| Dutch | 82 | 2.5% |
| Ecuadorian | 9 | 0.3% |
| English | 220 | 6.8% |
| European | 39 | 1.2% |
| Filipino | 8 | 0.3% |
| French | 94 | 2.9% |
| French Canadian | 27 | 0.8% |
| German | 222 | 6.9% |
| Indian (Asian) | 44 | 1.4% |
| Iranian | 22 | 0.7% |
| Irish | 304 | 9.5% |
| Italian | 326 | 10.1% |
| Jamaican | 36 | 1.1% |
| Korean | 65 | 2.0% |
| Lithuanian | 7 | 0.2% |
| Mexican | 856 | 26.6% |
| Norwegian | 9 | 0.3% |
| Portuguese | 19 | 0.6% |
| Puerto Rican | 8 | 0.3% |
| Russian | 16 | 0.5% |
| Scotch-Irish | 42 | 1.3% |
| Scottish | 107 | 3.3% |
| Seminole | 33 | 1.0% |
| South American | 9 | 0.3% |
| Sri Lankan | 44 | 1.4% |
| Subsaharan African | 5 | 0.2% |
| Swedish | 7 | 0.2% |
| Thai | 50 | 1.5% |
| Tlingit-Haida | 8 | 0.3% |
| Ukrainian | 12 | 0.4% |
| Welsh | 53 | 1.7% | View All 40 Rows |
Immigrants in Vine Hill
The most numerous immigrant groups reported in Vine Hill came from Latin America (266 | 8.3%), Central America (221 | 6.9%), Mexico (221 | 6.9%), Asia (123 | 3.8%), and Europe (89 | 2.8%), together accounting for 28.6% of all Vine Hill residents.
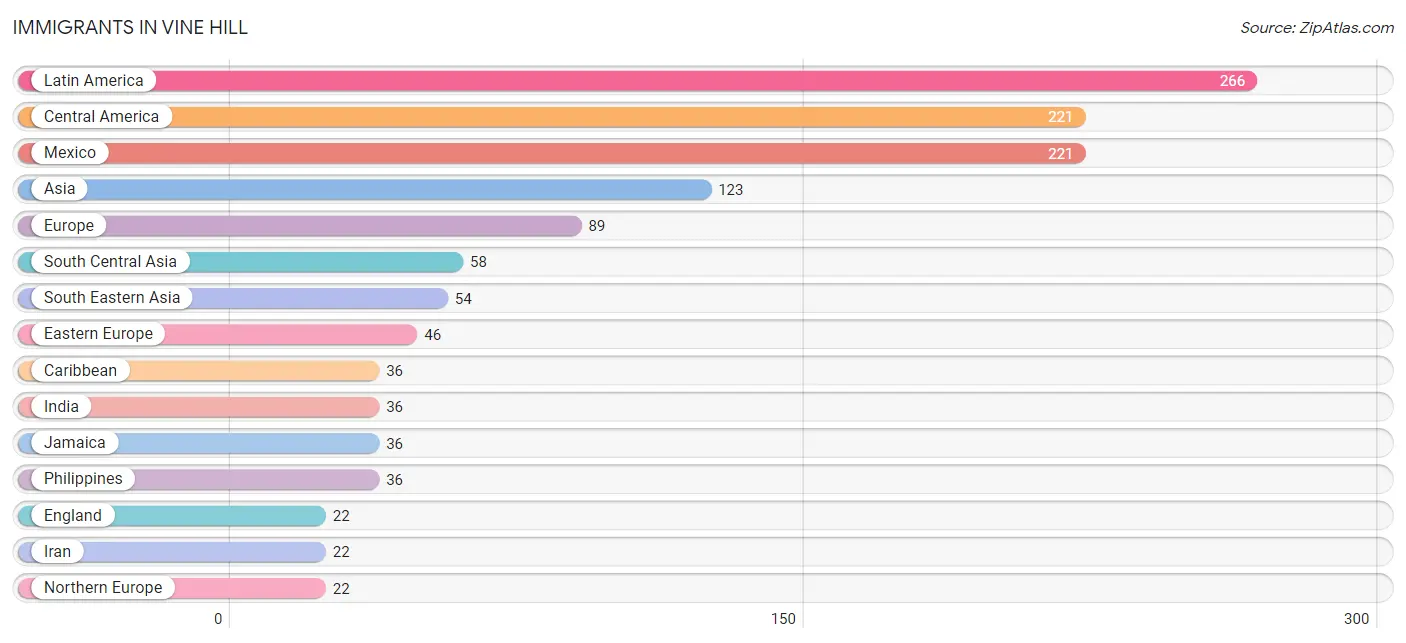
| Immigration Origin | # Population | % Population |
| Asia | 123 | 3.8% |
| Brazil | 9 | 0.3% |
| Caribbean | 36 | 1.1% |
| Central America | 221 | 6.9% |
| Eastern Europe | 46 | 1.4% |
| England | 22 | 0.7% |
| Europe | 89 | 2.8% |
| France | 21 | 0.6% |
| India | 36 | 1.1% |
| Iran | 22 | 0.7% |
| Jamaica | 36 | 1.1% |
| Latin America | 266 | 8.3% |
| Mexico | 221 | 6.9% |
| Northern Europe | 22 | 0.7% |
| Philippines | 36 | 1.1% |
| Russia | 18 | 0.6% |
| Singapore | 3 | 0.1% |
| South America | 9 | 0.3% |
| South Central Asia | 58 | 1.8% |
| South Eastern Asia | 54 | 1.7% |
| Turkey | 11 | 0.3% |
| Ukraine | 12 | 0.4% |
| Vietnam | 15 | 0.5% |
| Western Asia | 11 | 0.3% |
| Western Europe | 21 | 0.6% | View All 25 Rows |
Sex and Age in Vine Hill
Sex and Age in Vine Hill
The most populous age groups in Vine Hill are 35 to 39 Years (277 | 16.5%) for men and 50 to 54 Years (235 | 15.3%) for women.
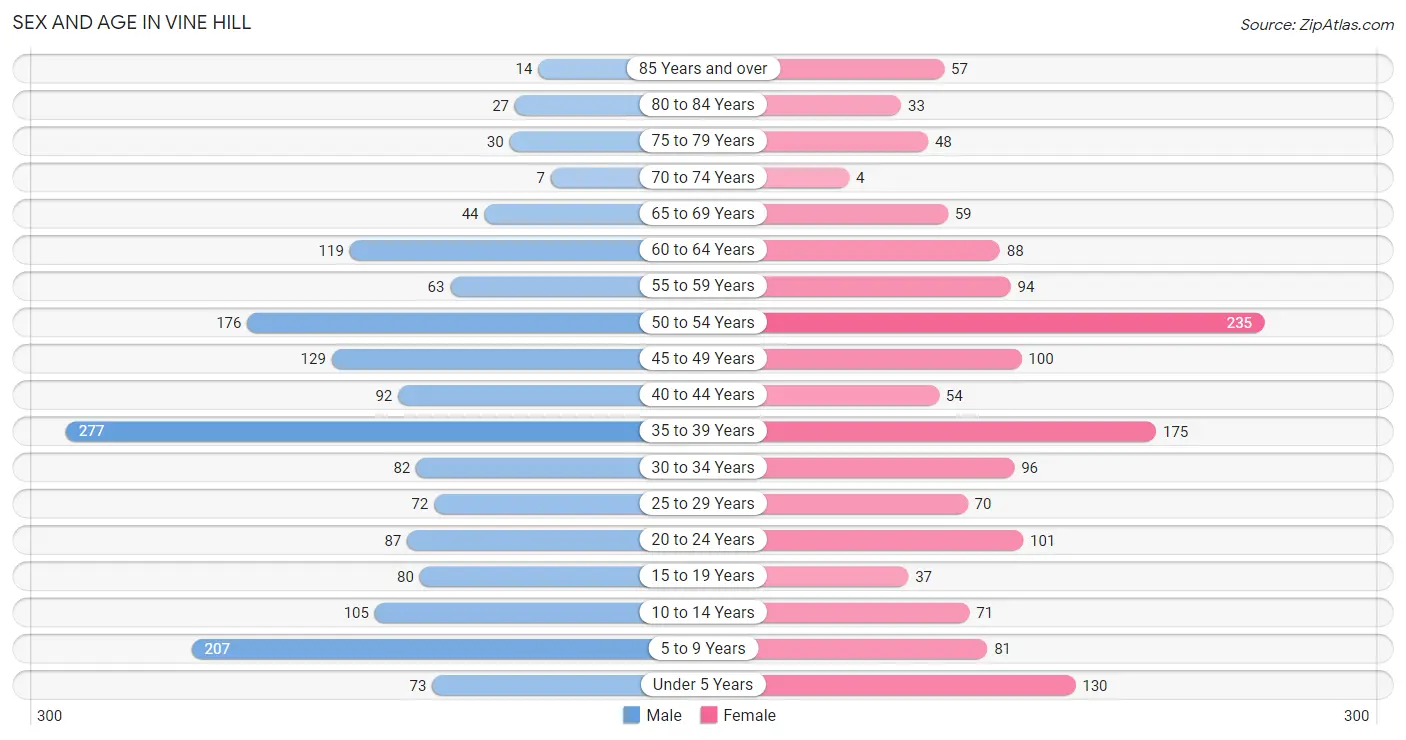
| Age Bracket | Male | Female |
| Under 5 Years | 73 (4.3%) | 130 (8.5%) |
| 5 to 9 Years | 207 (12.3%) | 81 (5.3%) |
| 10 to 14 Years | 105 (6.2%) | 71 (4.6%) |
| 15 to 19 Years | 80 (4.8%) | 37 (2.4%) |
| 20 to 24 Years | 87 (5.2%) | 101 (6.6%) |
| 25 to 29 Years | 72 (4.3%) | 70 (4.6%) |
| 30 to 34 Years | 82 (4.9%) | 96 (6.3%) |
| 35 to 39 Years | 277 (16.5%) | 175 (11.4%) |
| 40 to 44 Years | 92 (5.5%) | 54 (3.5%) |
| 45 to 49 Years | 129 (7.7%) | 100 (6.5%) |
| 50 to 54 Years | 176 (10.4%) | 235 (15.3%) |
| 55 to 59 Years | 63 (3.7%) | 94 (6.1%) |
| 60 to 64 Years | 119 (7.1%) | 88 (5.7%) |
| 65 to 69 Years | 44 (2.6%) | 59 (3.8%) |
| 70 to 74 Years | 7 (0.4%) | 4 (0.3%) |
| 75 to 79 Years | 30 (1.8%) | 48 (3.1%) |
| 80 to 84 Years | 27 (1.6%) | 33 (2.1%) |
| 85 Years and over | 14 (0.8%) | 57 (3.7%) |
| Total | 1,684 (100.0%) | 1,533 (100.0%) |
Families and Households in Vine Hill
Median Family Size in Vine Hill
The median family size in Vine Hill is 3.35 persons per family, with married-couple families (533 | 71.1%) accounting for the largest median family size of 3.4 persons per family. On the other hand, single male/father families (57 | 7.6%) represent the smallest median family size with 3.16 persons per family.
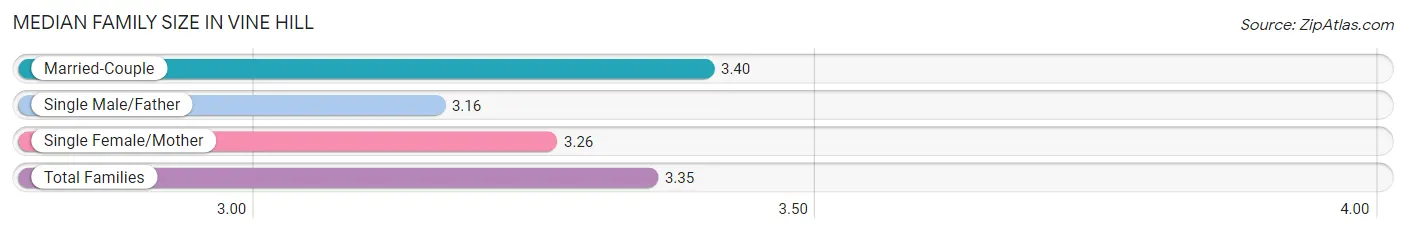
| Family Type | # Families | Family Size |
| Married-Couple | 533 (71.1%) | 3.40 |
| Single Male/Father | 57 (7.6%) | 3.16 |
| Single Female/Mother | 160 (21.3%) | 3.26 |
| Total Families | 750 (100.0%) | 3.35 |
Median Household Size in Vine Hill
The median household size in Vine Hill is 2.70 persons per household, with married-couple households (533 | 44.9%) accounting for the largest median household size of 3.57 persons per household. non-family households (437 | 36.8%) represent the smallest median household size with 1.33 persons per household.
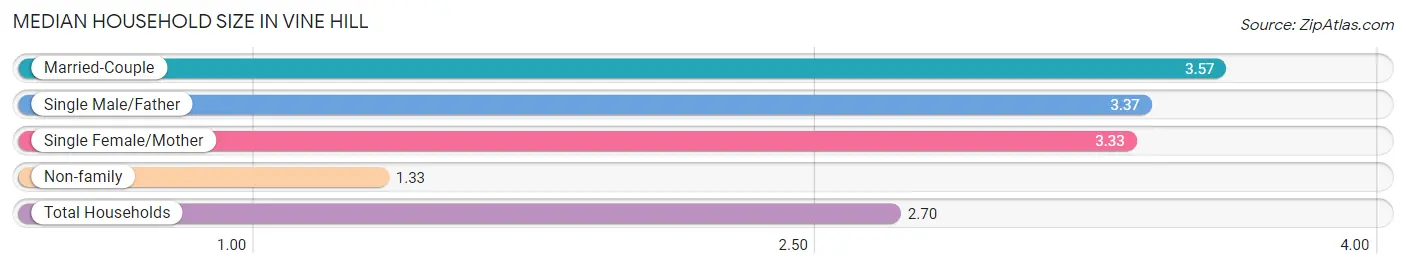
| Household Type | # Households | Household Size |
| Married-Couple | 533 (44.9%) | 3.57 |
| Single Male/Father | 57 (4.8%) | 3.37 |
| Single Female/Mother | 160 (13.5%) | 3.33 |
| Non-family | 437 (36.8%) | 1.33 |
| Total Households | 1,187 (100.0%) | 2.70 |
Household Size by Marriage Status in Vine Hill
Out of a total of 1,187 households in Vine Hill, 750 (63.2%) are family households, while 437 (36.8%) are nonfamily households. The most numerous type of family households are 2-person households, comprising 247, and the most common type of nonfamily households are 1-person households, comprising 334.
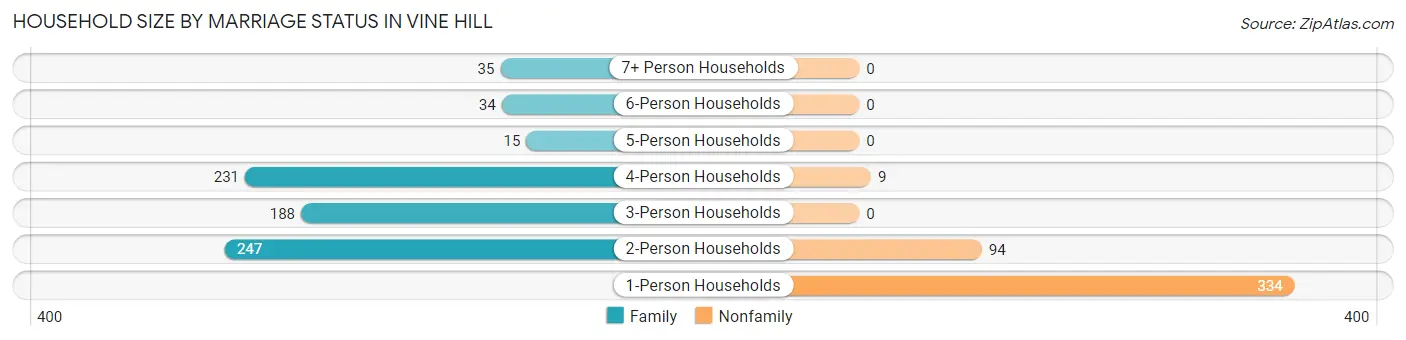
| Household Size | Family Households | Nonfamily Households |
| 1-Person Households | - | 334 (28.1%) |
| 2-Person Households | 247 (20.8%) | 94 (7.9%) |
| 3-Person Households | 188 (15.8%) | 0 (0.0%) |
| 4-Person Households | 231 (19.5%) | 9 (0.8%) |
| 5-Person Households | 15 (1.3%) | 0 (0.0%) |
| 6-Person Households | 34 (2.9%) | 0 (0.0%) |
| 7+ Person Households | 35 (2.9%) | 0 (0.0%) |
| Total | 750 (63.2%) | 437 (36.8%) |
Female Fertility in Vine Hill
Fertility by Age in Vine Hill
| Age Bracket | Women with Births | Births / 1,000 Women |
| 15 to 19 years | 0 (0.0%) | 0.0 |
| 20 to 34 years | 0 (0.0%) | 0.0 |
| 35 to 50 years | 0 (0.0%) | 0.0 |
| Total | 0 (0.0%) | 0.0 |
Fertility by Age by Marriage Status in Vine Hill
| Age Bracket | Married | Unmarried |
| 15 to 19 years | 0 (0.0%) | 0 (0.0%) |
| 20 to 34 years | 0 (0.0%) | 0 (0.0%) |
| 35 to 50 years | 0 (0.0%) | 0 (0.0%) |
| Total | 0 (0.0%) | 0 (0.0%) |
Fertility by Education in Vine Hill
| Educational Attainment | Women with Births | Births / 1,000 Women |
| Less than High School | 0 (0.0%) | 0.0 |
| High School Diploma | 0 (0.0%) | 0.0 |
| College or Associate's Degree | 0 (0.0%) | 0.0 |
| Bachelor's Degree | 0 (0.0%) | 0.0 |
| Graduate Degree | 0 (0.0%) | 0.0 |
| Total | 0 (0.0%) | 0.0 |
Fertility by Education by Marriage Status in Vine Hill
| Educational Attainment | Married | Unmarried |
| Less than High School | 0 (0.0%) | 0 (0.0%) |
| High School Diploma | 0 (0.0%) | 0 (0.0%) |
| College or Associate's Degree | 0 (0.0%) | 0 (0.0%) |
| Bachelor's Degree | 0 (0.0%) | 0 (0.0%) |
| Graduate Degree | 0 (0.0%) | 0 (0.0%) |
| Total | 0 (0.0%) | 0 (0.0%) |
Employment Characteristics in Vine Hill
Employment by Class of Employer in Vine Hill
Among the 1,517 employed individuals in Vine Hill, private company employees (954 | 62.9%), local government employees (214 | 14.1%), and not-for-profit organizations (115 | 7.6%) make up the most common classes of employment.
| Employer Class | # Employees | % Employees |
| Private Company Employees | 954 | 62.9% |
| Self-Employed (Incorporated) | 63 | 4.2% |
| Self-Employed (Not Incorporated) | 73 | 4.8% |
| Not-for-profit Organizations | 115 | 7.6% |
| Local Government Employees | 214 | 14.1% |
| State Government Employees | 98 | 6.5% |
| Federal Government Employees | 0 | 0.0% |
| Unpaid Family Workers | 0 | 0.0% |
| Total | 1,517 | 100.0% |
Employment Status by Age in Vine Hill
According to the labor force statistics for Vine Hill, out of the total population over 16 years of age (2,545), 67.9% or 1,728 individuals are in the labor force, with 7.5% or 130 of them unemployed. The age group with the highest labor force participation rate is 25 to 29 years, with 90.8% or 129 individuals in the labor force. Within the labor force, the 55 to 59 years age range has the highest percentage of unemployed individuals, with 24.2% or 24 of them being unemployed.
| Age Bracket | In Labor Force | Unemployed |
| 16 to 19 Years | 23 (20.5%) | 0 (0.0%) |
| 20 to 24 Years | 124 (66.0%) | 0 (0.0%) |
| 25 to 29 Years | 129 (90.8%) | 11 (8.5%) |
| 30 to 34 Years | 157 (88.2%) | 23 (14.6%) |
| 35 to 44 Years | 478 (79.9%) | 7 (1.5%) |
| 45 to 54 Years | 507 (79.2%) | 58 (11.4%) |
| 55 to 59 Years | 99 (63.1%) | 24 (24.2%) |
| 60 to 64 Years | 135 (65.2%) | 0 (0.0%) |
| 65 to 74 Years | 68 (59.6%) | 7 (10.3%) |
| 75 Years and over | 7 (3.3%) | 0 (0.0%) |
| Total | 1,728 (67.9%) | 130 (7.5%) |
Employment Status by Educational Attainment in Vine Hill
According to labor force statistics for Vine Hill, 78.3% of individuals (1,505) out of the total population between 25 and 64 years of age (1,922) are in the labor force, with 8.2% or 123 of them being unemployed. The group with the highest labor force participation rate are those with the educational attainment of bachelor's degree or higher, with 90.3% or 616 individuals in the labor force. Within the labor force, individuals with less than high school education have the highest percentage of unemployment, with 42.2% or 43 of them being unemployed.
| Educational Attainment | In Labor Force | Unemployed |
| Less than High School | 102 (55.7%) | 77 (42.2%) |
| High School Diploma | 390 (68.7%) | 78 (13.8%) |
| College / Associate Degree | 397 (81.2%) | 0 (0.0%) |
| Bachelor's Degree or higher | 616 (90.3%) | 29 (4.2%) |
| Total | 1,505 (78.3%) | 158 (8.2%) |
Employment Occupations by Sex in Vine Hill
Management, Business, Science and Arts Occupations
The most common Management, Business, Science and Arts occupations in Vine Hill are Management (205 | 12.8%), Community & Social Service (177 | 11.1%), Computers, Engineering & Science (155 | 9.7%), Education Instruction & Library (134 | 8.4%), and Computers & Mathematics (133 | 8.3%).
Management, Business, Science and Arts Occupations by Sex
Within the Management, Business, Science and Arts occupations in Vine Hill, the most male-oriented occupations are Computers, Engineering & Science (100.0%), Computers & Mathematics (100.0%), and Architecture & Engineering (100.0%), while the most female-oriented occupations are Education, Arts & Media (100.0%), Health Technologists (100.0%), and Health Diagnosing & Treating (88.2%).
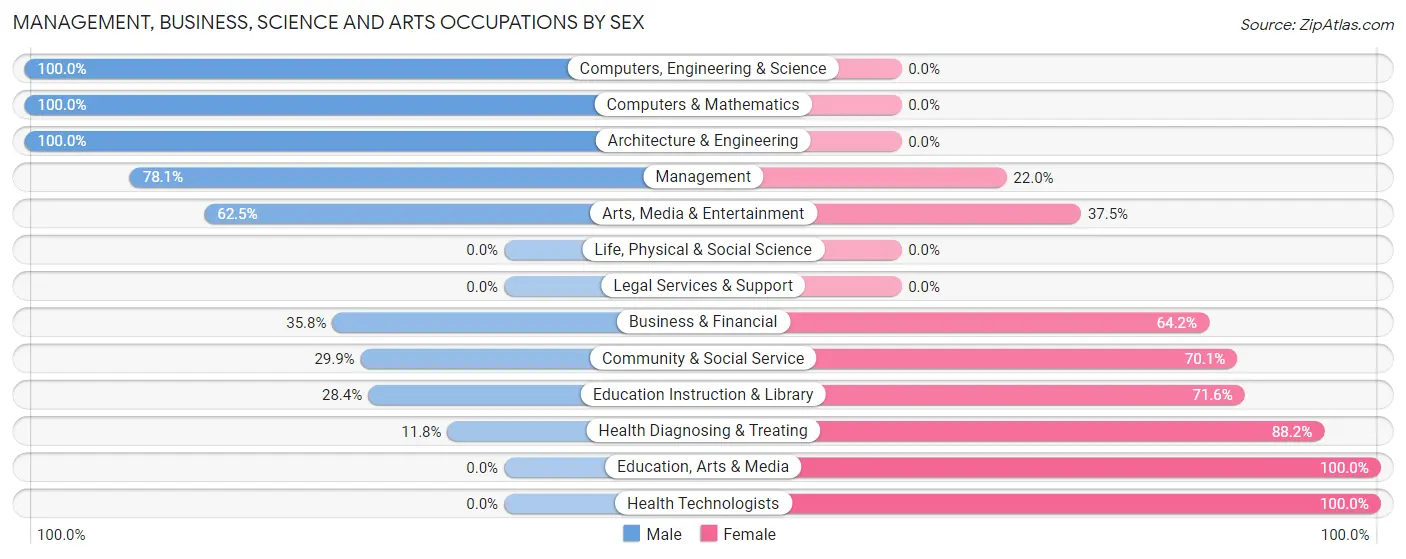
| Occupation | Male | Female |
| Management | 160 (78.0%) | 45 (22.0%) |
| Business & Financial | 24 (35.8%) | 43 (64.2%) |
| Computers, Engineering & Science | 155 (100.0%) | 0 (0.0%) |
| Computers & Mathematics | 133 (100.0%) | 0 (0.0%) |
| Architecture & Engineering | 22 (100.0%) | 0 (0.0%) |
| Life, Physical & Social Science | 0 (0.0%) | 0 (0.0%) |
| Community & Social Service | 53 (29.9%) | 124 (70.1%) |
| Education, Arts & Media | 0 (0.0%) | 19 (100.0%) |
| Legal Services & Support | 0 (0.0%) | 0 (0.0%) |
| Education Instruction & Library | 38 (28.4%) | 96 (71.6%) |
| Arts, Media & Entertainment | 15 (62.5%) | 9 (37.5%) |
| Health Diagnosing & Treating | 15 (11.8%) | 112 (88.2%) |
| Health Technologists | 0 (0.0%) | 99 (100.0%) |
| Total (Category) | 407 (55.7%) | 324 (44.3%) |
| Total (Overall) | 1,007 (63.1%) | 590 (36.9%) |
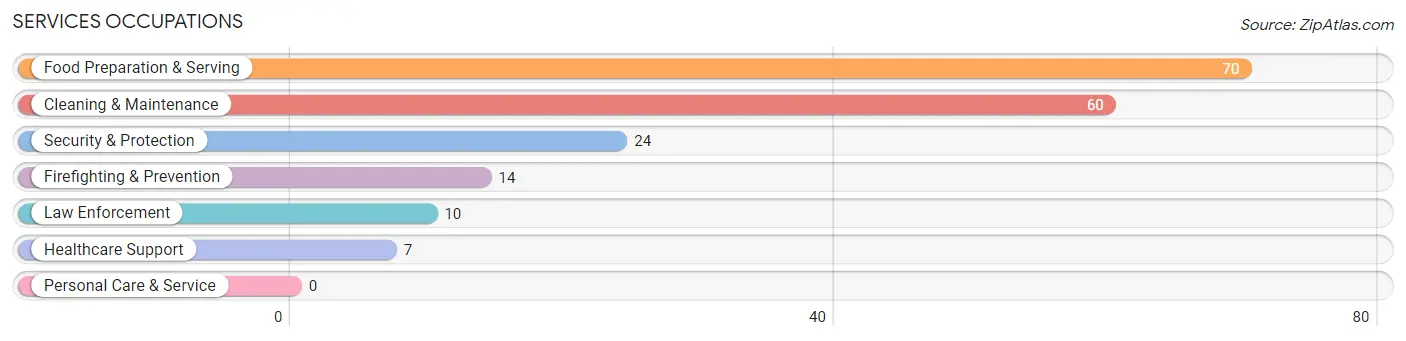
Services Occupations
The most common Services occupations in Vine Hill are Food Preparation & Serving (70 | 4.4%), Cleaning & Maintenance (60 | 3.8%), Security & Protection (24 | 1.5%), Firefighting & Prevention (14 | 0.9%), and Law Enforcement (10 | 0.6%).
Services Occupations by Sex
Within the Services occupations in Vine Hill, the most male-oriented occupations are Firefighting & Prevention (100.0%), Food Preparation & Serving (77.1%), and Cleaning & Maintenance (71.7%), while the most female-oriented occupations are Healthcare Support (100.0%), Law Enforcement (100.0%), and Security & Protection (41.7%).
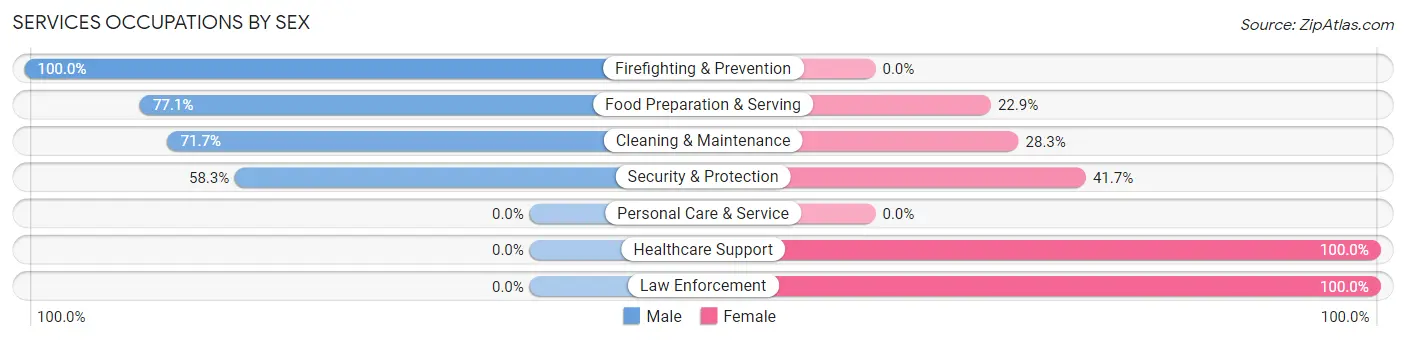
| Occupation | Male | Female |
| Healthcare Support | 0 (0.0%) | 7 (100.0%) |
| Security & Protection | 14 (58.3%) | 10 (41.7%) |
| Firefighting & Prevention | 14 (100.0%) | 0 (0.0%) |
| Law Enforcement | 0 (0.0%) | 10 (100.0%) |
| Food Preparation & Serving | 54 (77.1%) | 16 (22.9%) |
| Cleaning & Maintenance | 43 (71.7%) | 17 (28.3%) |
| Personal Care & Service | 0 (0.0%) | 0 (0.0%) |
| Total (Category) | 111 (68.9%) | 50 (31.1%) |
| Total (Overall) | 1,007 (63.1%) | 590 (36.9%) |
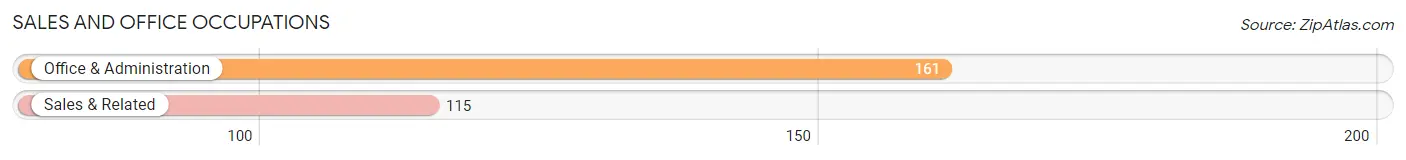
Sales and Office Occupations
The most common Sales and Office occupations in Vine Hill are Office & Administration (161 | 10.1%), and Sales & Related (115 | 7.2%).
Sales and Office Occupations by Sex
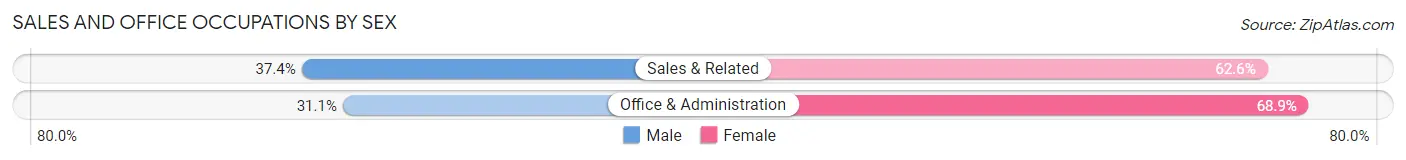
| Occupation | Male | Female |
| Sales & Related | 43 (37.4%) | 72 (62.6%) |
| Office & Administration | 50 (31.1%) | 111 (68.9%) |
| Total (Category) | 93 (33.7%) | 183 (66.3%) |
| Total (Overall) | 1,007 (63.1%) | 590 (36.9%) |
Natural Resources, Construction and Maintenance Occupations
The most common Natural Resources, Construction and Maintenance occupations in Vine Hill are Installation, Maintenance & Repair (111 | 7.0%), and Construction & Extraction (90 | 5.6%).
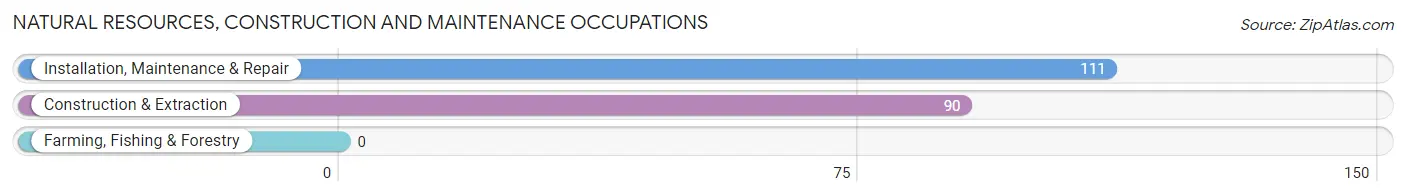
Natural Resources, Construction and Maintenance Occupations by Sex
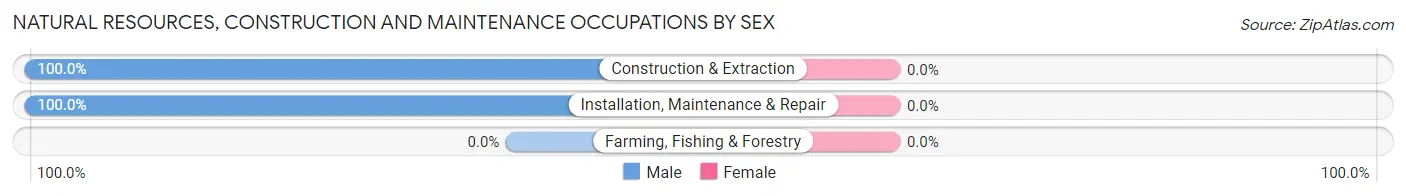
| Occupation | Male | Female |
| Farming, Fishing & Forestry | 0 (0.0%) | 0 (0.0%) |
| Construction & Extraction | 90 (100.0%) | 0 (0.0%) |
| Installation, Maintenance & Repair | 111 (100.0%) | 0 (0.0%) |
| Total (Category) | 201 (100.0%) | 0 (0.0%) |
| Total (Overall) | 1,007 (63.1%) | 590 (36.9%) |
Production, Transportation and Moving Occupations
The most common Production, Transportation and Moving occupations in Vine Hill are Transportation (132 | 8.3%), Material Moving (59 | 3.7%), and Production (37 | 2.3%).
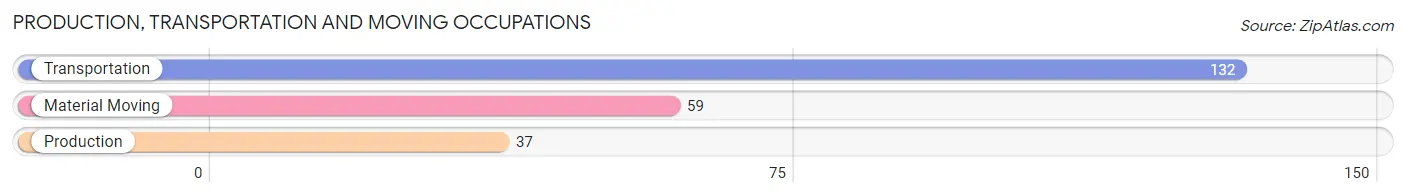
Production, Transportation and Moving Occupations by Sex
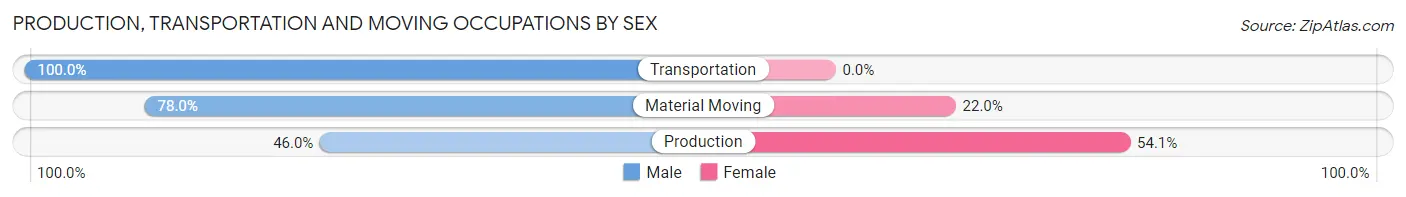
| Occupation | Male | Female |
| Production | 17 (46.0%) | 20 (54.0%) |
| Transportation | 132 (100.0%) | 0 (0.0%) |
| Material Moving | 46 (78.0%) | 13 (22.0%) |
| Total (Category) | 195 (85.5%) | 33 (14.5%) |
| Total (Overall) | 1,007 (63.1%) | 590 (36.9%) |
Employment Industries by Sex in Vine Hill
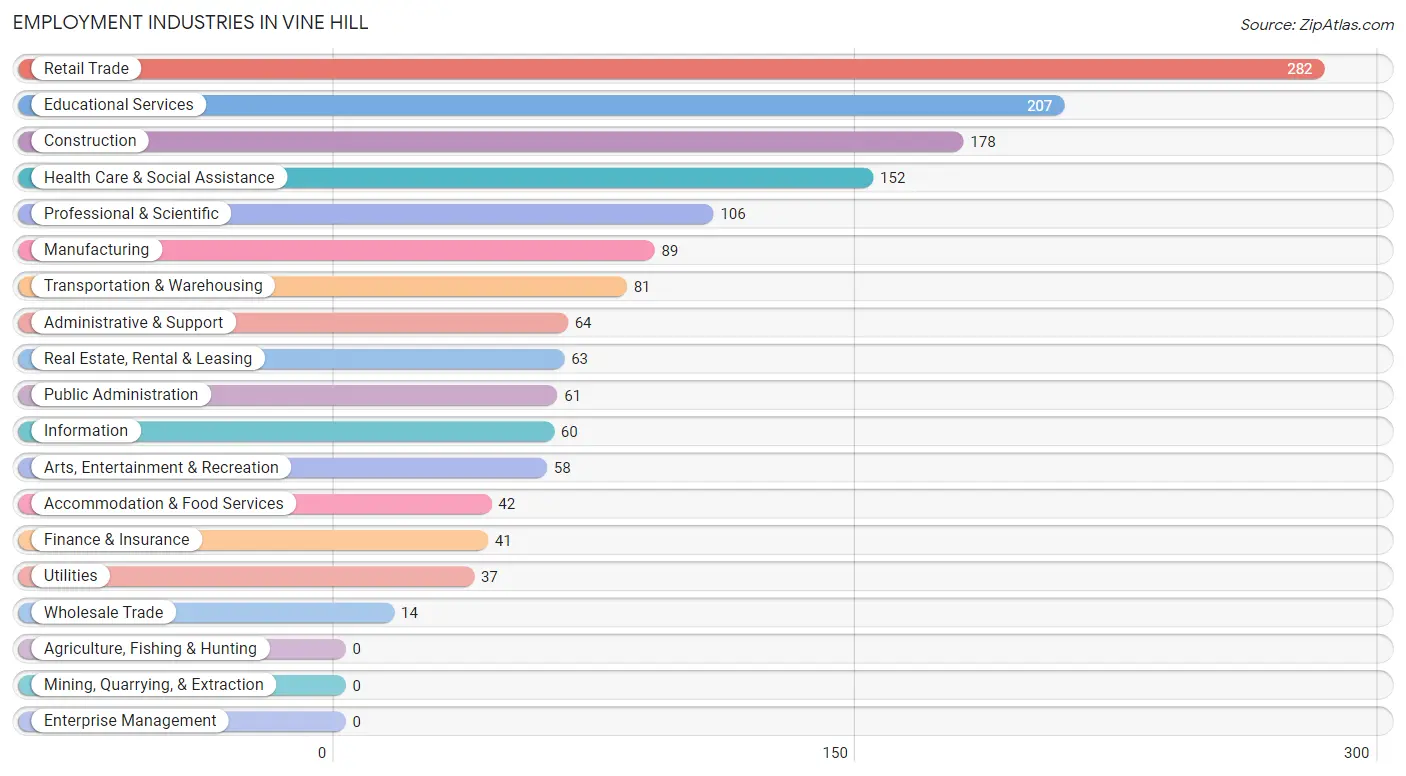
Employment Industries in Vine Hill
The major employment industries in Vine Hill include Retail Trade (282 | 17.7%), Educational Services (207 | 13.0%), Construction (178 | 11.2%), Health Care & Social Assistance (152 | 9.5%), and Professional & Scientific (106 | 6.6%).
Employment Industries by Sex in Vine Hill
The Vine Hill industries that see more men than women are Manufacturing (100.0%), Wholesale Trade (100.0%), and Utilities (100.0%), whereas the industries that tend to have a higher number of women are Health Care & Social Assistance (82.2%), Professional & Scientific (66.0%), and Public Administration (62.3%).
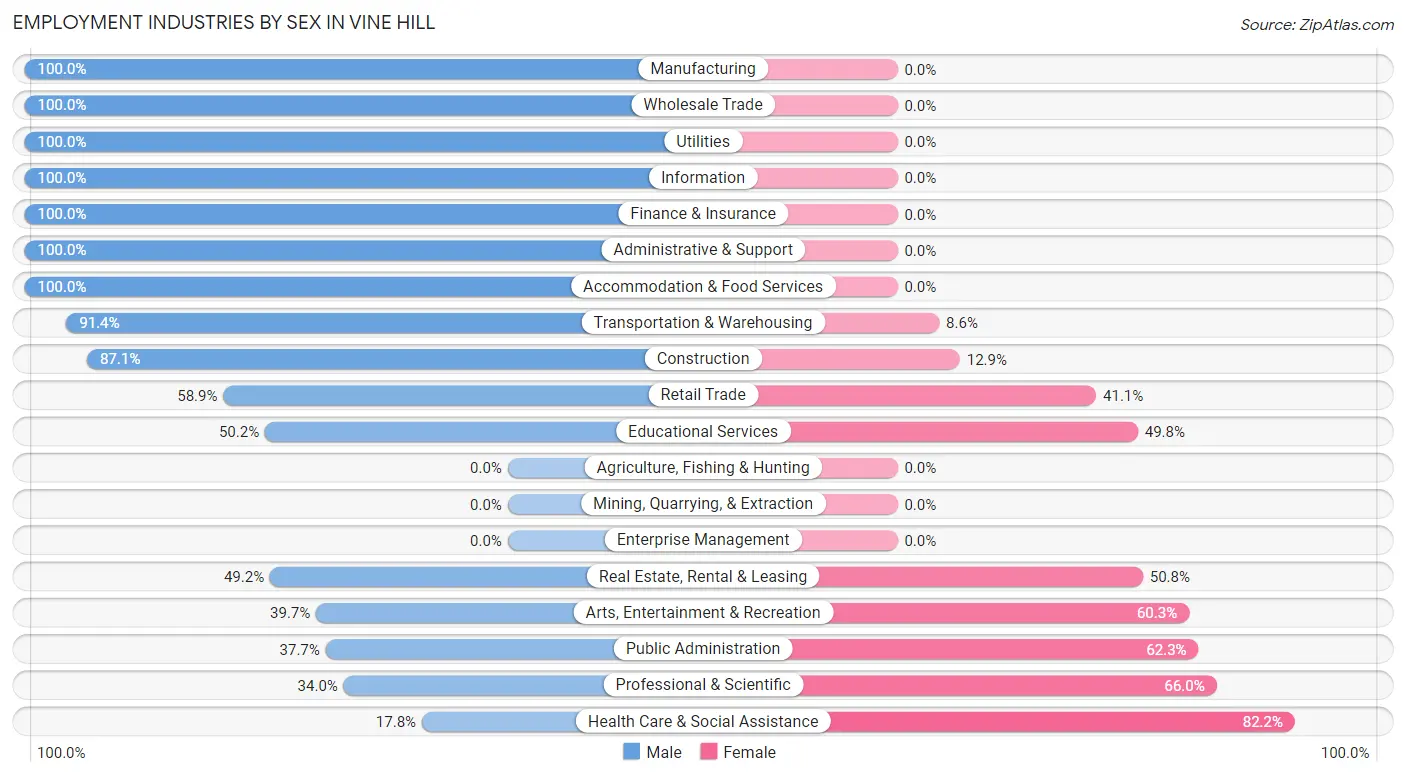
| Industry | Male | Female |
| Agriculture, Fishing & Hunting | 0 (0.0%) | 0 (0.0%) |
| Mining, Quarrying, & Extraction | 0 (0.0%) | 0 (0.0%) |
| Construction | 155 (87.1%) | 23 (12.9%) |
| Manufacturing | 89 (100.0%) | 0 (0.0%) |
| Wholesale Trade | 14 (100.0%) | 0 (0.0%) |
| Retail Trade | 166 (58.9%) | 116 (41.1%) |
| Transportation & Warehousing | 74 (91.4%) | 7 (8.6%) |
| Utilities | 37 (100.0%) | 0 (0.0%) |
| Information | 60 (100.0%) | 0 (0.0%) |
| Finance & Insurance | 41 (100.0%) | 0 (0.0%) |
| Real Estate, Rental & Leasing | 31 (49.2%) | 32 (50.8%) |
| Professional & Scientific | 36 (34.0%) | 70 (66.0%) |
| Enterprise Management | 0 (0.0%) | 0 (0.0%) |
| Administrative & Support | 64 (100.0%) | 0 (0.0%) |
| Educational Services | 104 (50.2%) | 103 (49.8%) |
| Health Care & Social Assistance | 27 (17.8%) | 125 (82.2%) |
| Arts, Entertainment & Recreation | 23 (39.7%) | 35 (60.3%) |
| Accommodation & Food Services | 42 (100.0%) | 0 (0.0%) |
| Public Administration | 23 (37.7%) | 38 (62.3%) |
| Total | 1,007 (63.1%) | 590 (36.9%) |
Education in Vine Hill
School Enrollment in Vine Hill
The most common levels of schooling among the 684 students in Vine Hill are elementary school (262 | 38.3%), college / undergraduate (174 | 25.4%), and middle school (132 | 19.3%).
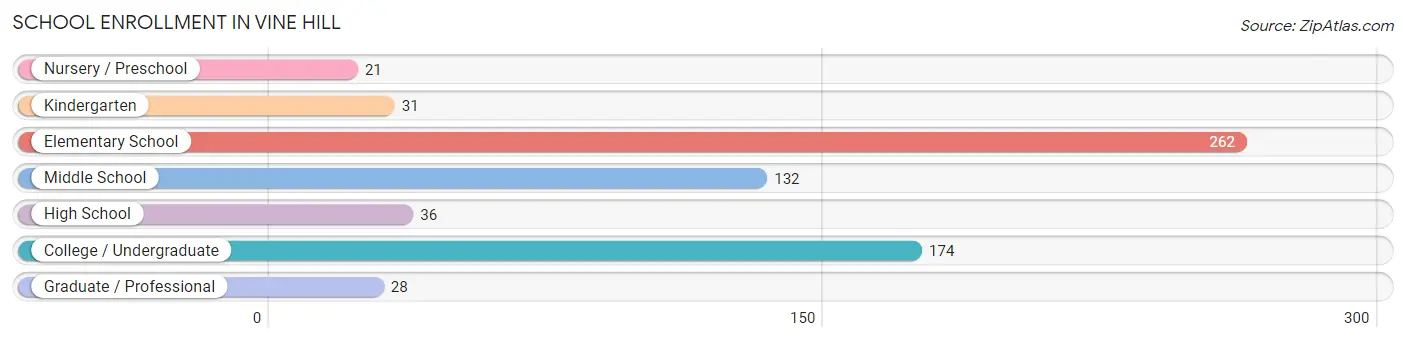
| School Level | # Students | % Students |
| Nursery / Preschool | 21 | 3.1% |
| Kindergarten | 31 | 4.5% |
| Elementary School | 262 | 38.3% |
| Middle School | 132 | 19.3% |
| High School | 36 | 5.3% |
| College / Undergraduate | 174 | 25.4% |
| Graduate / Professional | 28 | 4.1% |
| Total | 684 | 100.0% |
School Enrollment by Age by Funding Source in Vine Hill
Out of a total of 684 students who are enrolled in schools in Vine Hill, 82 (12.0%) attend a private institution, while the remaining 602 (88.0%) are enrolled in public schools. The age group of 5 to 9 year old has the highest likelihood of being enrolled in private schools, with 65 (23.9% in the age bracket) enrolled. Conversely, the age group of 3 to 4 year olds has the lowest likelihood of being enrolled in a private school, with 21 (100.0% in the age bracket) attending a public institution.
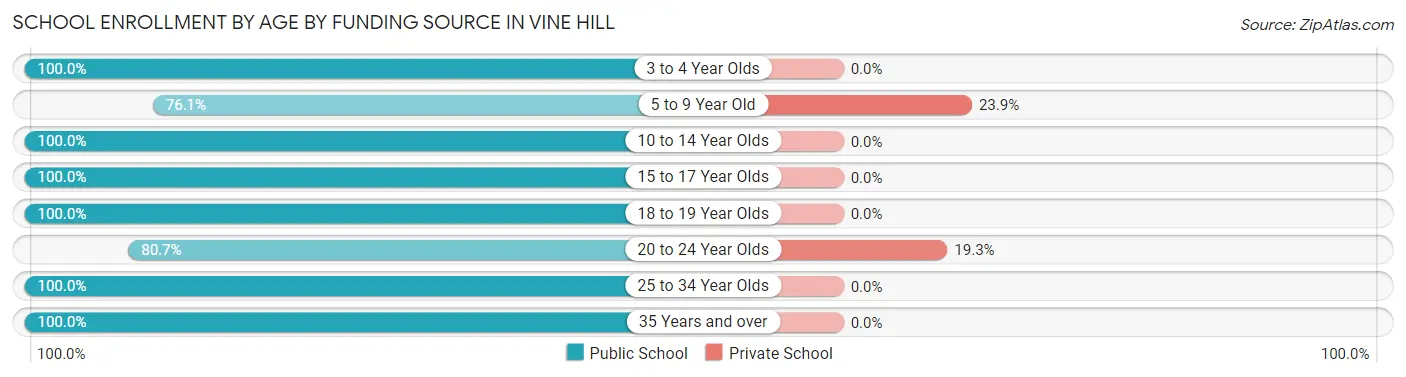
| Age Bracket | Public School | Private School |
| 3 to 4 Year Olds | 21 (100.0%) | 0 (0.0%) |
| 5 to 9 Year Old | 207 (76.1%) | 65 (23.9%) |
| 10 to 14 Year Olds | 160 (100.0%) | 0 (0.0%) |
| 15 to 17 Year Olds | 84 (100.0%) | 0 (0.0%) |
| 18 to 19 Year Olds | 10 (100.0%) | 0 (0.0%) |
| 20 to 24 Year Olds | 71 (80.7%) | 17 (19.3%) |
| 25 to 34 Year Olds | 13 (100.0%) | 0 (0.0%) |
| 35 Years and over | 36 (100.0%) | 0 (0.0%) |
| Total | 602 (88.0%) | 82 (12.0%) |
Educational Attainment by Field of Study in Vine Hill
Science & technology (165 | 21.1%), business (128 | 16.4%), social sciences (119 | 15.2%), computers & mathematics (70 | 9.0%), and arts & humanities (61 | 7.8%) are the most common fields of study among 781 individuals in Vine Hill who have obtained a bachelor's degree or higher.
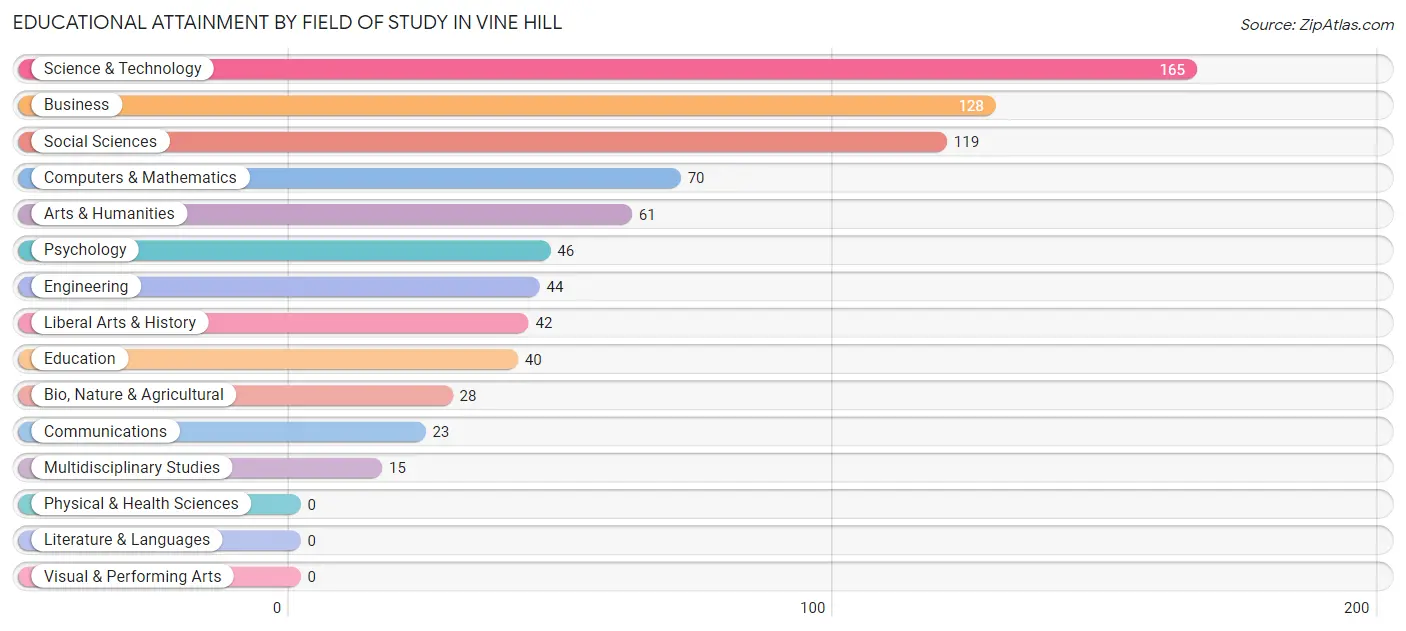
| Field of Study | # Graduates | % Graduates |
| Computers & Mathematics | 70 | 9.0% |
| Bio, Nature & Agricultural | 28 | 3.6% |
| Physical & Health Sciences | 0 | 0.0% |
| Psychology | 46 | 5.9% |
| Social Sciences | 119 | 15.2% |
| Engineering | 44 | 5.6% |
| Multidisciplinary Studies | 15 | 1.9% |
| Science & Technology | 165 | 21.1% |
| Business | 128 | 16.4% |
| Education | 40 | 5.1% |
| Literature & Languages | 0 | 0.0% |
| Liberal Arts & History | 42 | 5.4% |
| Visual & Performing Arts | 0 | 0.0% |
| Communications | 23 | 2.9% |
| Arts & Humanities | 61 | 7.8% |
| Total | 781 | 100.0% |
Transportation & Commute in Vine Hill
Vehicle Availability by Sex in Vine Hill
The most prevalent vehicle ownership categories in Vine Hill are males with 2 vehicles (396, accounting for 42.0%) and females with 2 vehicles (265, making up 69.1%).
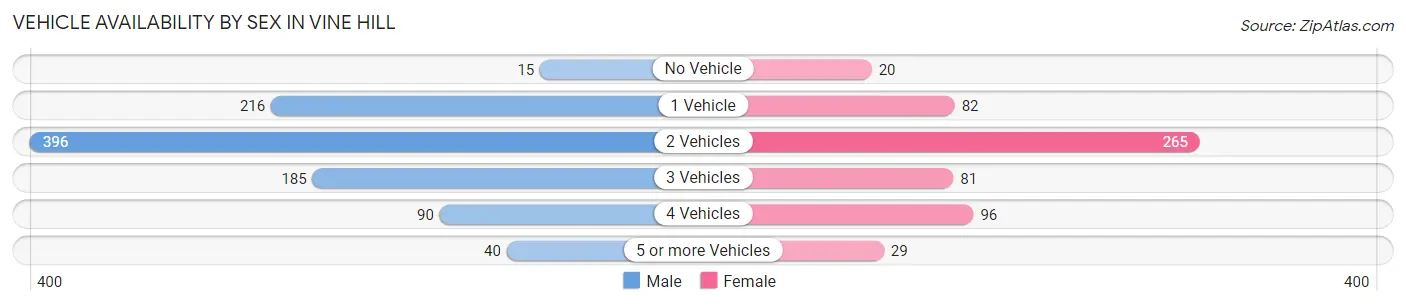
| Vehicles Available | Male | Female |
| No Vehicle | 15 (1.6%) | 20 (3.5%) |
| 1 Vehicle | 216 (22.9%) | 82 (14.3%) |
| 2 Vehicles | 396 (42.0%) | 265 (46.3%) |
| 3 Vehicles | 185 (19.6%) | 81 (14.1%) |
| 4 Vehicles | 90 (9.6%) | 96 (16.8%) |
| 5 or more Vehicles | 40 (4.3%) | 29 (5.1%) |
| Total | 942 (100.0%) | 573 (100.0%) |
Commute Time in Vine Hill
The most frequently occuring commute durations in Vine Hill are 60 to 89 minutes (232 commuters, 16.9%), 15 to 19 minutes (204 commuters, 14.9%), and 45 to 59 minutes (198 commuters, 14.4%).
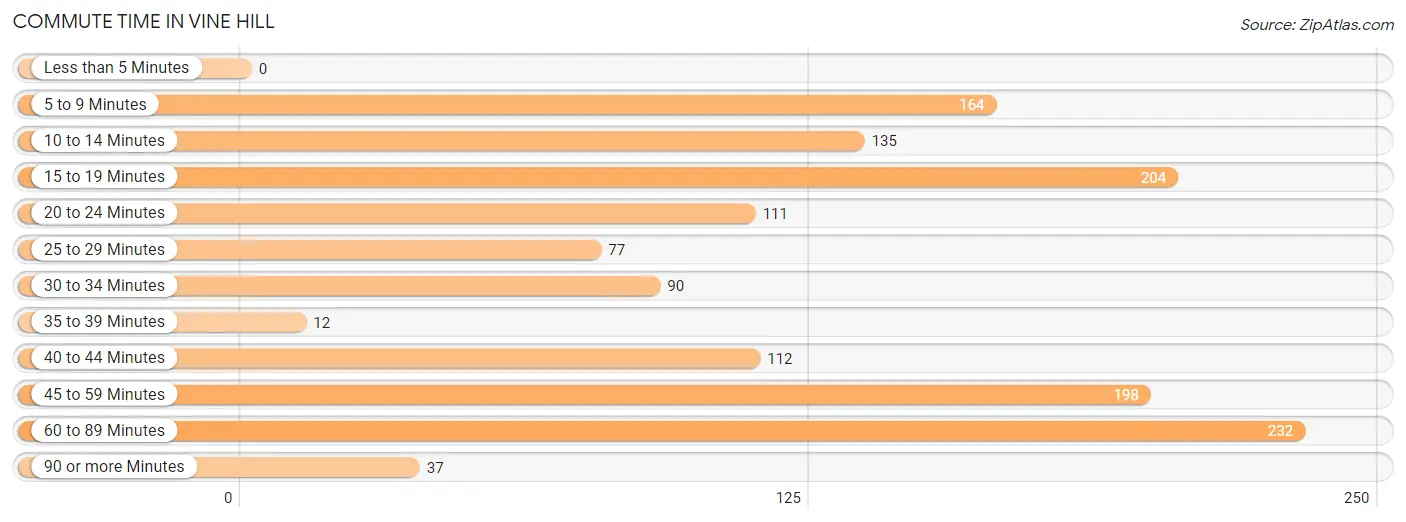
| Commute Time | # Commuters | % Commuters |
| Less than 5 Minutes | 0 | 0.0% |
| 5 to 9 Minutes | 164 | 11.9% |
| 10 to 14 Minutes | 135 | 9.8% |
| 15 to 19 Minutes | 204 | 14.9% |
| 20 to 24 Minutes | 111 | 8.1% |
| 25 to 29 Minutes | 77 | 5.6% |
| 30 to 34 Minutes | 90 | 6.6% |
| 35 to 39 Minutes | 12 | 0.9% |
| 40 to 44 Minutes | 112 | 8.2% |
| 45 to 59 Minutes | 198 | 14.4% |
| 60 to 89 Minutes | 232 | 16.9% |
| 90 or more Minutes | 37 | 2.7% |
Commute Time by Sex in Vine Hill
The most common commute times in Vine Hill are 15 to 19 minutes (151 commuters, 17.2%) for males and 60 to 89 minutes (90 commuters, 18.3%) for females.
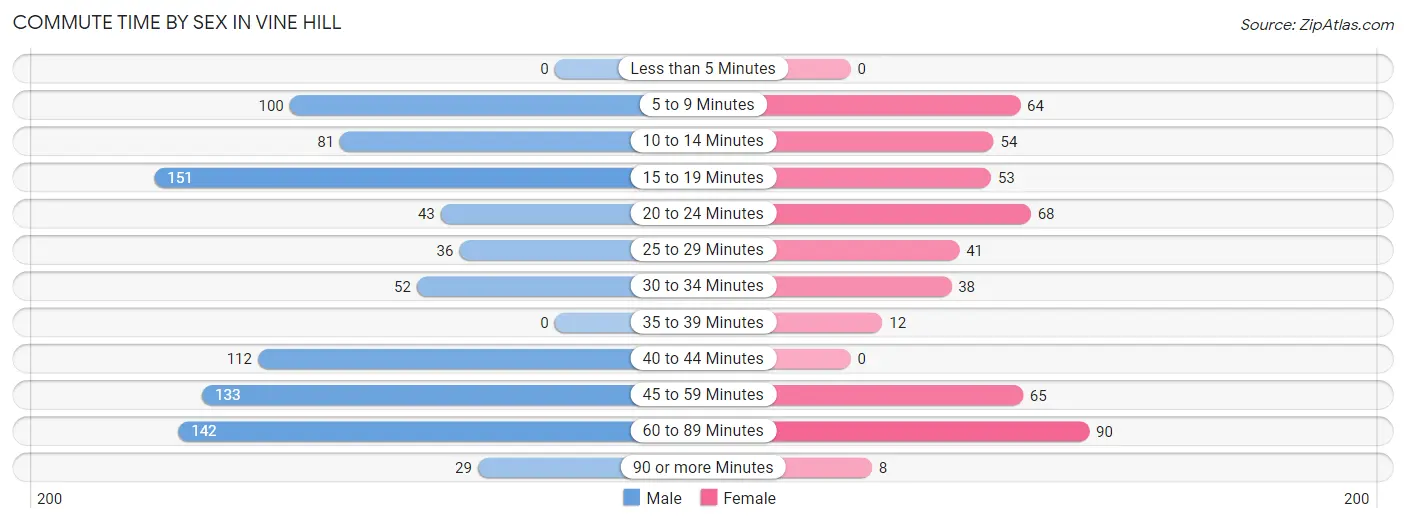
| Commute Time | Male | Female |
| Less than 5 Minutes | 0 (0.0%) | 0 (0.0%) |
| 5 to 9 Minutes | 100 (11.4%) | 64 (13.0%) |
| 10 to 14 Minutes | 81 (9.2%) | 54 (11.0%) |
| 15 to 19 Minutes | 151 (17.2%) | 53 (10.7%) |
| 20 to 24 Minutes | 43 (4.9%) | 68 (13.8%) |
| 25 to 29 Minutes | 36 (4.1%) | 41 (8.3%) |
| 30 to 34 Minutes | 52 (5.9%) | 38 (7.7%) |
| 35 to 39 Minutes | 0 (0.0%) | 12 (2.4%) |
| 40 to 44 Minutes | 112 (12.7%) | 0 (0.0%) |
| 45 to 59 Minutes | 133 (15.1%) | 65 (13.2%) |
| 60 to 89 Minutes | 142 (16.2%) | 90 (18.3%) |
| 90 or more Minutes | 29 (3.3%) | 8 (1.6%) |
Time of Departure to Work by Sex in Vine Hill
The most frequent times of departure to work in Vine Hill are 12:00 AM to 4:59 AM (158, 18.0%) for males and 7:30 AM to 7:59 AM (118, 23.9%) for females.
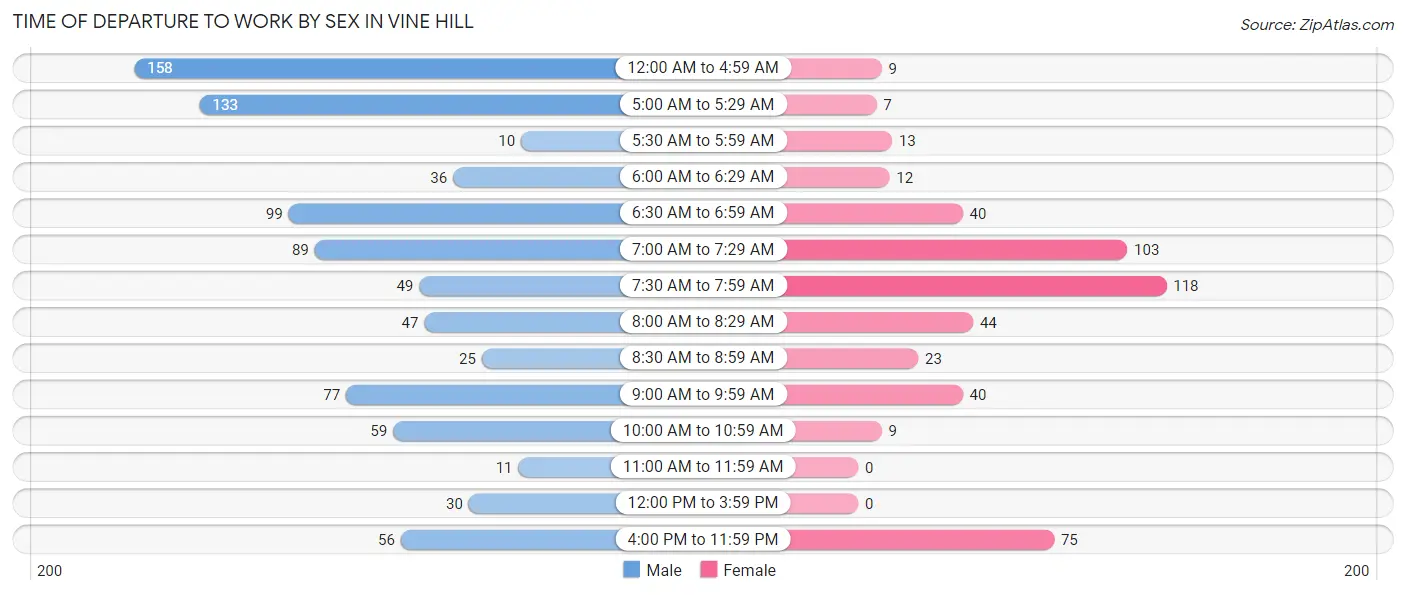
| Time of Departure | Male | Female |
| 12:00 AM to 4:59 AM | 158 (18.0%) | 9 (1.8%) |
| 5:00 AM to 5:29 AM | 133 (15.1%) | 7 (1.4%) |
| 5:30 AM to 5:59 AM | 10 (1.1%) | 13 (2.6%) |
| 6:00 AM to 6:29 AM | 36 (4.1%) | 12 (2.4%) |
| 6:30 AM to 6:59 AM | 99 (11.3%) | 40 (8.1%) |
| 7:00 AM to 7:29 AM | 89 (10.1%) | 103 (20.9%) |
| 7:30 AM to 7:59 AM | 49 (5.6%) | 118 (23.9%) |
| 8:00 AM to 8:29 AM | 47 (5.3%) | 44 (8.9%) |
| 8:30 AM to 8:59 AM | 25 (2.8%) | 23 (4.7%) |
| 9:00 AM to 9:59 AM | 77 (8.8%) | 40 (8.1%) |
| 10:00 AM to 10:59 AM | 59 (6.7%) | 9 (1.8%) |
| 11:00 AM to 11:59 AM | 11 (1.3%) | 0 (0.0%) |
| 12:00 PM to 3:59 PM | 30 (3.4%) | 0 (0.0%) |
| 4:00 PM to 11:59 PM | 56 (6.4%) | 75 (15.2%) |
| Total | 879 (100.0%) | 493 (100.0%) |
Housing Occupancy in Vine Hill
Occupancy by Ownership in Vine Hill
Of the total 1,187 dwellings in Vine Hill, owner-occupied units account for 890 (75.0%), while renter-occupied units make up 297 (25.0%).
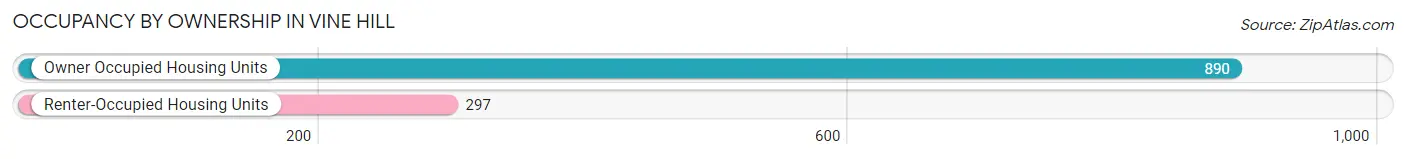
| Occupancy | # Housing Units | % Housing Units |
| Owner Occupied Housing Units | 890 | 75.0% |
| Renter-Occupied Housing Units | 297 | 25.0% |
| Total Occupied Housing Units | 1,187 | 100.0% |
Occupancy by Household Size in Vine Hill
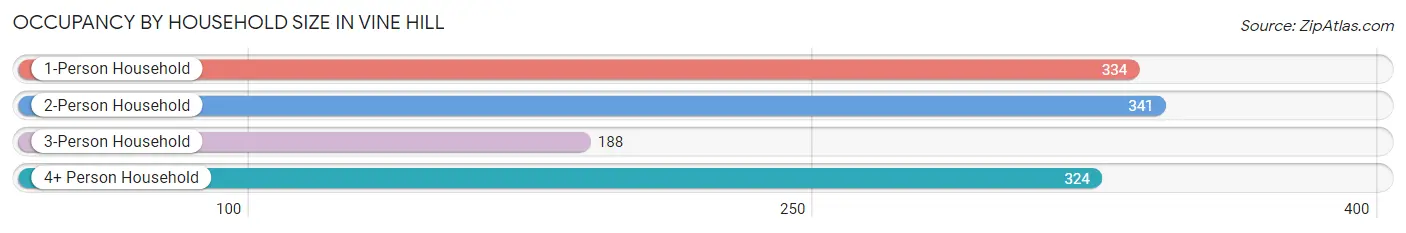
| Household Size | # Housing Units | % Housing Units |
| 1-Person Household | 334 | 28.1% |
| 2-Person Household | 341 | 28.7% |
| 3-Person Household | 188 | 15.8% |
| 4+ Person Household | 324 | 27.3% |
| Total Housing Units | 1,187 | 100.0% |
Occupancy by Ownership by Household Size in Vine Hill
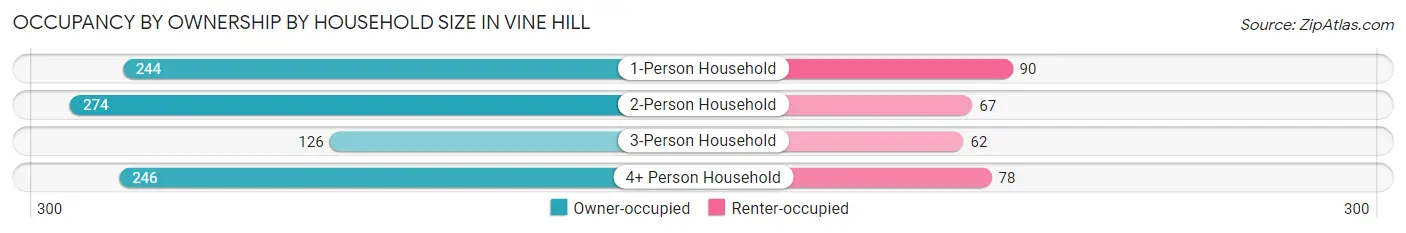
| Household Size | Owner-occupied | Renter-occupied |
| 1-Person Household | 244 (73.1%) | 90 (27.0%) |
| 2-Person Household | 274 (80.3%) | 67 (19.7%) |
| 3-Person Household | 126 (67.0%) | 62 (33.0%) |
| 4+ Person Household | 246 (75.9%) | 78 (24.1%) |
| Total Housing Units | 890 (75.0%) | 297 (25.0%) |
Occupancy by Educational Attainment in Vine Hill
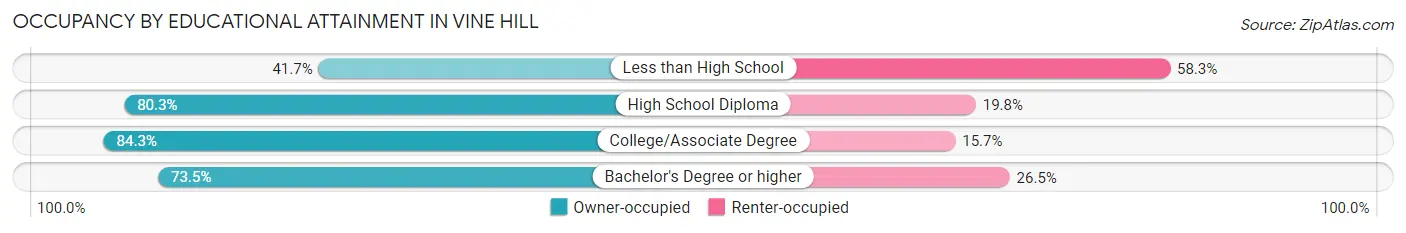
| Household Size | Owner-occupied | Renter-occupied |
| Less than High School | 53 (41.7%) | 74 (58.3%) |
| High School Diploma | 252 (80.2%) | 62 (19.8%) |
| College/Associate Degree | 285 (84.3%) | 53 (15.7%) |
| Bachelor's Degree or higher | 300 (73.5%) | 108 (26.5%) |
Occupancy by Age of Householder in Vine Hill
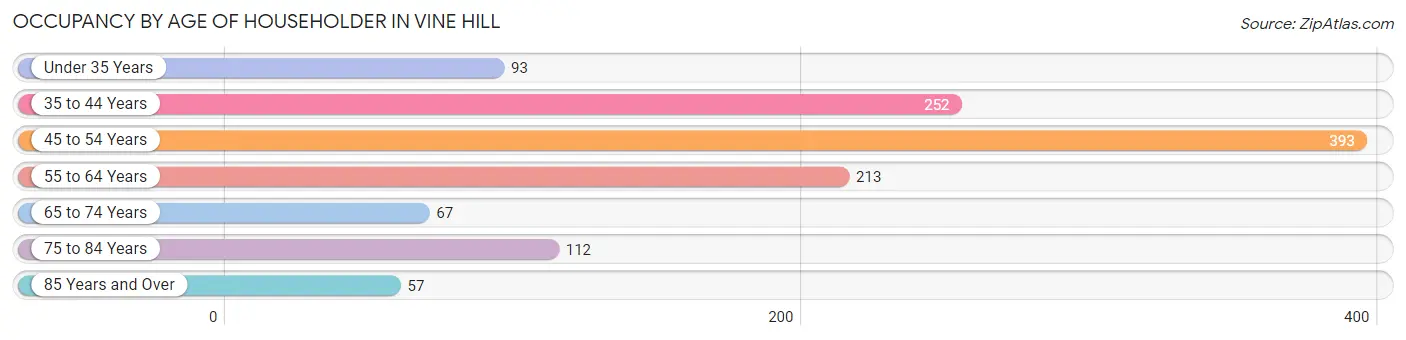
| Age Bracket | # Households | % Households |
| Under 35 Years | 93 | 7.8% |
| 35 to 44 Years | 252 | 21.2% |
| 45 to 54 Years | 393 | 33.1% |
| 55 to 64 Years | 213 | 17.9% |
| 65 to 74 Years | 67 | 5.6% |
| 75 to 84 Years | 112 | 9.4% |
| 85 Years and Over | 57 | 4.8% |
| Total | 1,187 | 100.0% |
Housing Finances in Vine Hill
Median Income by Occupancy in Vine Hill
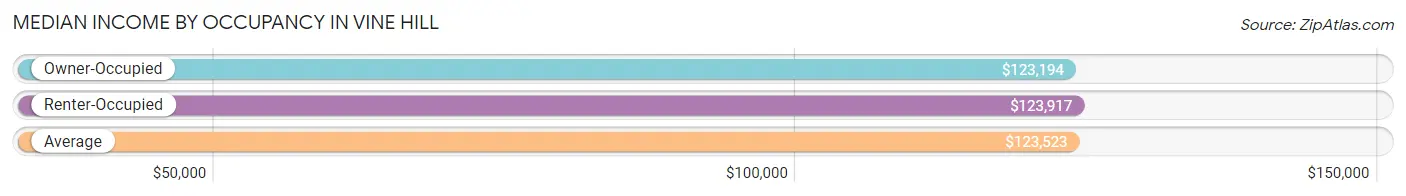
| Occupancy Type | # Households | Median Income |
| Owner-Occupied | 890 (75.0%) | $123,194 |
| Renter-Occupied | 297 (25.0%) | $123,917 |
| Average | 1,187 (100.0%) | $123,523 |
Occupancy by Householder Income Bracket in Vine Hill
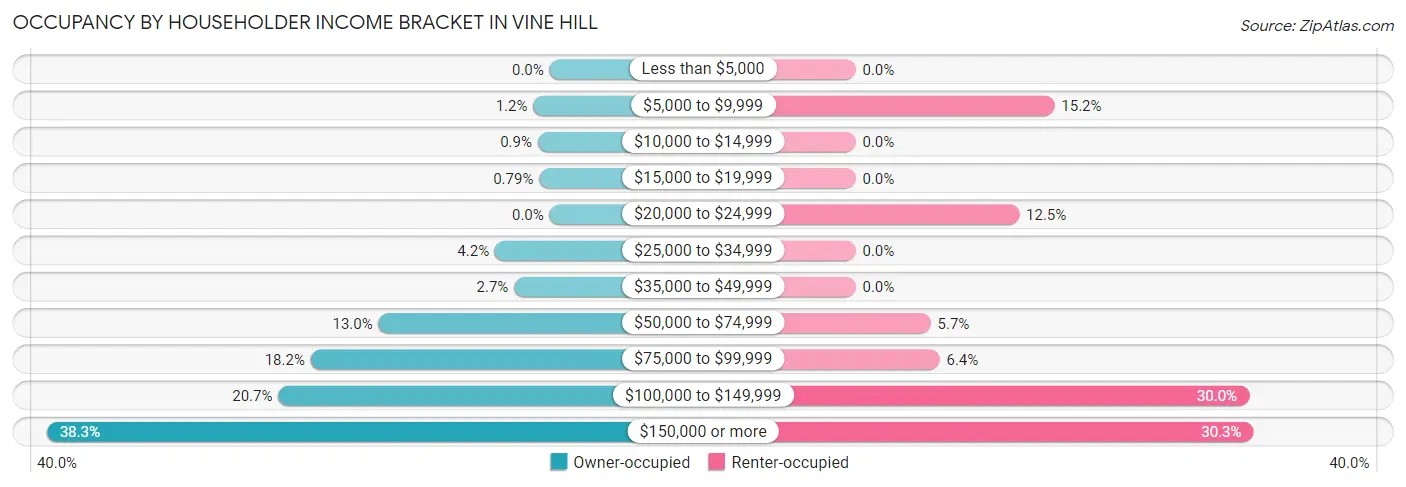
| Income Bracket | Owner-occupied | Renter-occupied |
| Less than $5,000 | 0 (0.0%) | 0 (0.0%) |
| $5,000 to $9,999 | 11 (1.2%) | 45 (15.1%) |
| $10,000 to $14,999 | 8 (0.9%) | 0 (0.0%) |
| $15,000 to $19,999 | 7 (0.8%) | 0 (0.0%) |
| $20,000 to $24,999 | 0 (0.0%) | 37 (12.5%) |
| $25,000 to $34,999 | 37 (4.2%) | 0 (0.0%) |
| $35,000 to $49,999 | 24 (2.7%) | 0 (0.0%) |
| $50,000 to $74,999 | 116 (13.0%) | 17 (5.7%) |
| $75,000 to $99,999 | 162 (18.2%) | 19 (6.4%) |
| $100,000 to $149,999 | 184 (20.7%) | 89 (30.0%) |
| $150,000 or more | 341 (38.3%) | 90 (30.3%) |
| Total | 890 (100.0%) | 297 (100.0%) |
Monthly Housing Cost Tiers in Vine Hill
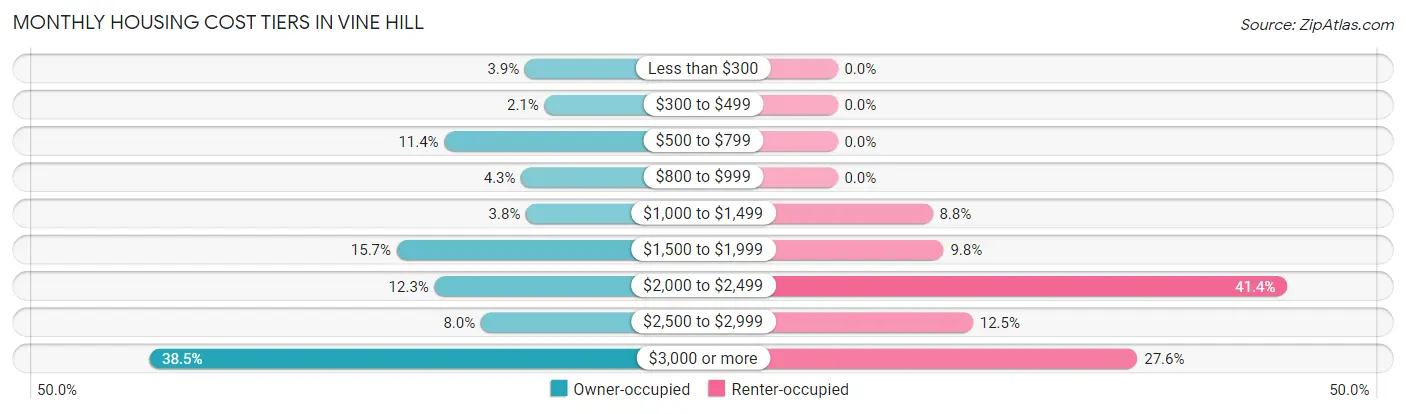
| Monthly Cost | Owner-occupied | Renter-occupied |
| Less than $300 | 35 (3.9%) | 0 (0.0%) |
| $300 to $499 | 19 (2.1%) | 0 (0.0%) |
| $500 to $799 | 101 (11.4%) | 0 (0.0%) |
| $800 to $999 | 38 (4.3%) | 0 (0.0%) |
| $1,000 to $1,499 | 34 (3.8%) | 26 (8.7%) |
| $1,500 to $1,999 | 140 (15.7%) | 29 (9.8%) |
| $2,000 to $2,499 | 109 (12.2%) | 123 (41.4%) |
| $2,500 to $2,999 | 71 (8.0%) | 37 (12.5%) |
| $3,000 or more | 343 (38.5%) | 82 (27.6%) |
| Total | 890 (100.0%) | 297 (100.0%) |
Physical Housing Characteristics in Vine Hill
Housing Structures in Vine Hill
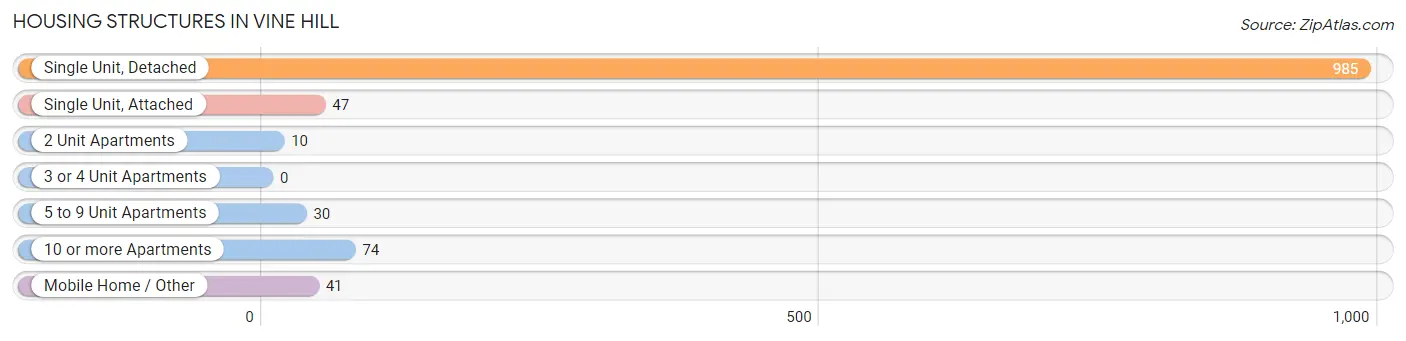
| Structure Type | # Housing Units | % Housing Units |
| Single Unit, Detached | 985 | 83.0% |
| Single Unit, Attached | 47 | 4.0% |
| 2 Unit Apartments | 10 | 0.8% |
| 3 or 4 Unit Apartments | 0 | 0.0% |
| 5 to 9 Unit Apartments | 30 | 2.5% |
| 10 or more Apartments | 74 | 6.2% |
| Mobile Home / Other | 41 | 3.5% |
| Total | 1,187 | 100.0% |
Housing Structures by Occupancy in Vine Hill
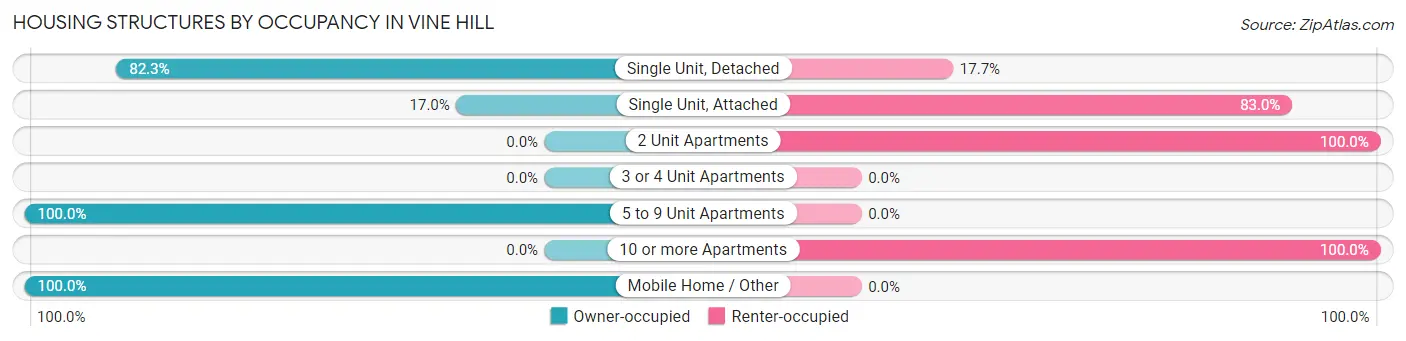
| Structure Type | Owner-occupied | Renter-occupied |
| Single Unit, Detached | 811 (82.3%) | 174 (17.7%) |
| Single Unit, Attached | 8 (17.0%) | 39 (83.0%) |
| 2 Unit Apartments | 0 (0.0%) | 10 (100.0%) |
| 3 or 4 Unit Apartments | 0 (0.0%) | 0 (0.0%) |
| 5 to 9 Unit Apartments | 30 (100.0%) | 0 (0.0%) |
| 10 or more Apartments | 0 (0.0%) | 74 (100.0%) |
| Mobile Home / Other | 41 (100.0%) | 0 (0.0%) |
| Total | 890 (75.0%) | 297 (25.0%) |
Housing Structures by Number of Rooms in Vine Hill
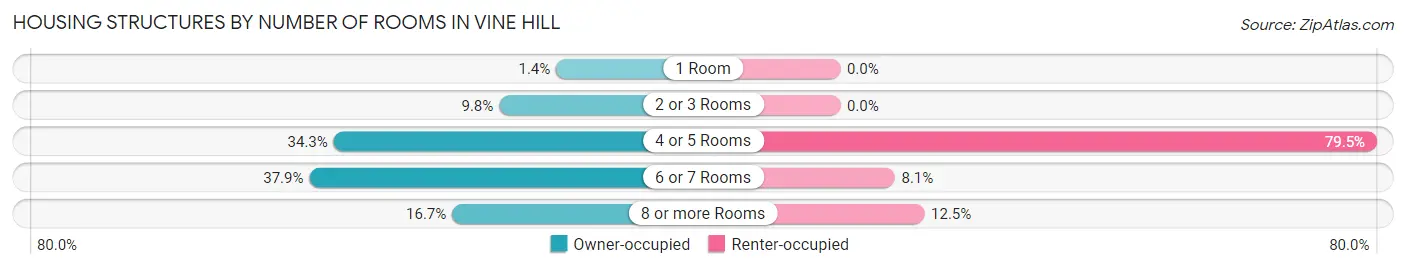
| Number of Rooms | Owner-occupied | Renter-occupied |
| 1 Room | 12 (1.3%) | 0 (0.0%) |
| 2 or 3 Rooms | 87 (9.8%) | 0 (0.0%) |
| 4 or 5 Rooms | 305 (34.3%) | 236 (79.5%) |
| 6 or 7 Rooms | 337 (37.9%) | 24 (8.1%) |
| 8 or more Rooms | 149 (16.7%) | 37 (12.5%) |
| Total | 890 (100.0%) | 297 (100.0%) |
Housing Structure by Heating Type in Vine Hill
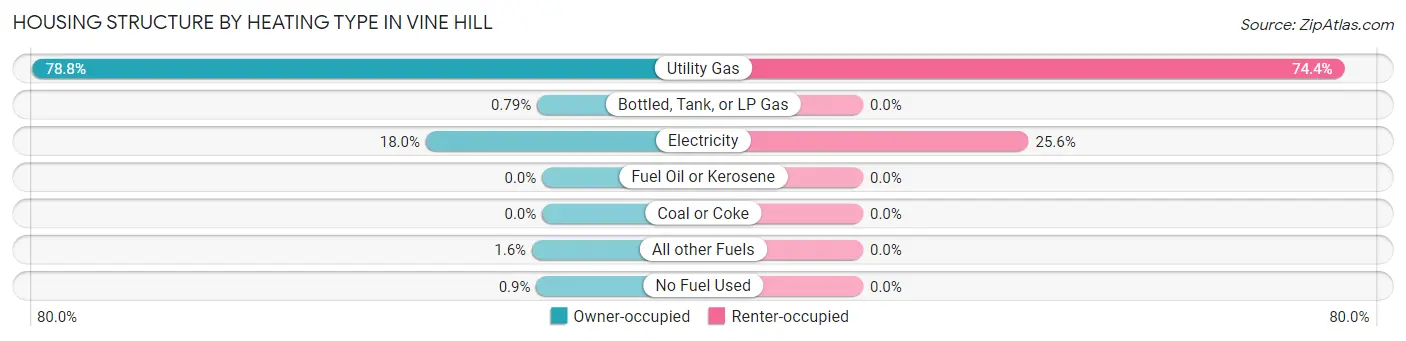
| Heating Type | Owner-occupied | Renter-occupied |
| Utility Gas | 701 (78.8%) | 221 (74.4%) |
| Bottled, Tank, or LP Gas | 7 (0.8%) | 0 (0.0%) |
| Electricity | 160 (18.0%) | 76 (25.6%) |
| Fuel Oil or Kerosene | 0 (0.0%) | 0 (0.0%) |
| Coal or Coke | 0 (0.0%) | 0 (0.0%) |
| All other Fuels | 14 (1.6%) | 0 (0.0%) |
| No Fuel Used | 8 (0.9%) | 0 (0.0%) |
| Total | 890 (100.0%) | 297 (100.0%) |
Household Vehicle Usage in Vine Hill
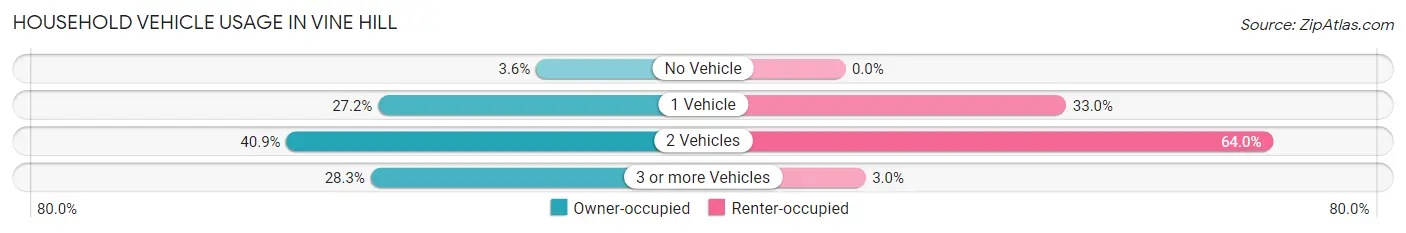
| Vehicles per Household | Owner-occupied | Renter-occupied |
| No Vehicle | 32 (3.6%) | 0 (0.0%) |
| 1 Vehicle | 242 (27.2%) | 98 (33.0%) |
| 2 Vehicles | 364 (40.9%) | 190 (64.0%) |
| 3 or more Vehicles | 252 (28.3%) | 9 (3.0%) |
| Total | 890 (100.0%) | 297 (100.0%) |
Real Estate & Mortgages in Vine Hill
Real Estate and Mortgage Overview in Vine Hill
| Characteristic | Without Mortgage | With Mortgage |
| Housing Units | 190 | 700 |
| Median Property Value | $480,300 | $618,800 |
| Median Household Income | $79,432 | $313 |
| Monthly Housing Costs | $758 | $343 |
| Real Estate Taxes | - | - |
Property Value by Mortgage Status in Vine Hill
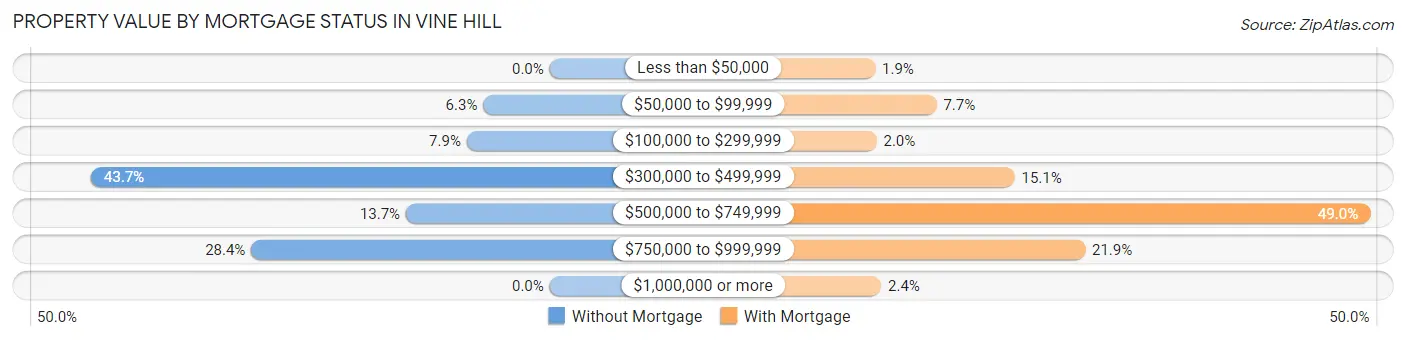
| Property Value | Without Mortgage | With Mortgage |
| Less than $50,000 | 0 (0.0%) | 13 (1.9%) |
| $50,000 to $99,999 | 12 (6.3%) | 54 (7.7%) |
| $100,000 to $299,999 | 15 (7.9%) | 14 (2.0%) |
| $300,000 to $499,999 | 83 (43.7%) | 106 (15.1%) |
| $500,000 to $749,999 | 26 (13.7%) | 343 (49.0%) |
| $750,000 to $999,999 | 54 (28.4%) | 153 (21.9%) |
| $1,000,000 or more | 0 (0.0%) | 17 (2.4%) |
| Total | 190 (100.0%) | 700 (100.0%) |
Household Income by Mortgage Status in Vine Hill
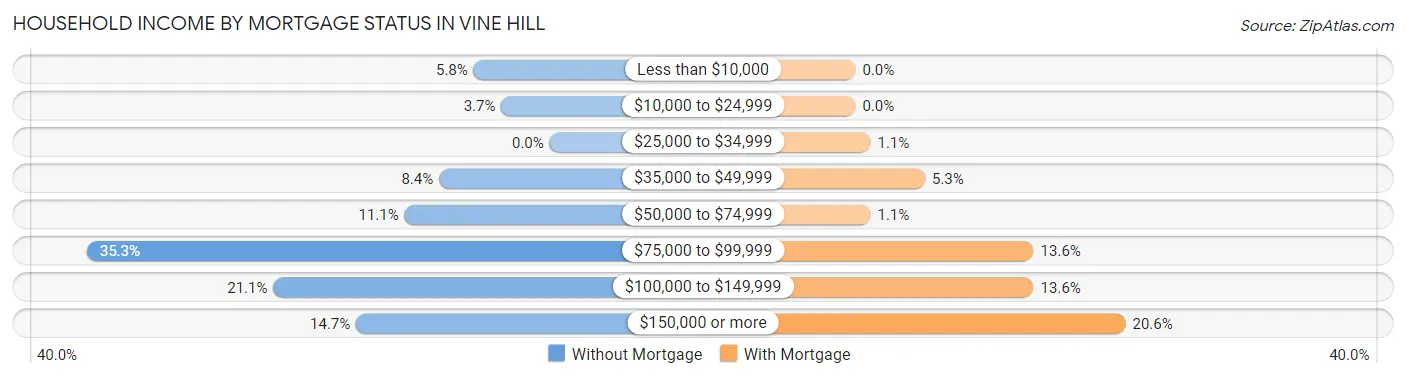
| Household Income | Without Mortgage | With Mortgage |
| Less than $10,000 | 11 (5.8%) | 0 (0.0%) |
| $10,000 to $24,999 | 7 (3.7%) | 0 (0.0%) |
| $25,000 to $34,999 | 0 (0.0%) | 8 (1.1%) |
| $35,000 to $49,999 | 16 (8.4%) | 37 (5.3%) |
| $50,000 to $74,999 | 21 (11.1%) | 8 (1.1%) |
| $75,000 to $99,999 | 67 (35.3%) | 95 (13.6%) |
| $100,000 to $149,999 | 40 (21.0%) | 95 (13.6%) |
| $150,000 or more | 28 (14.7%) | 144 (20.6%) |
| Total | 190 (100.0%) | 700 (100.0%) |
Property Value to Household Income Ratio in Vine Hill
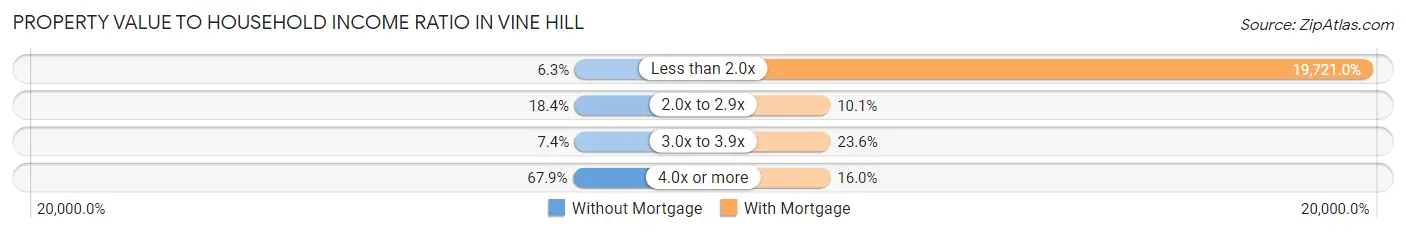
| Value-to-Income Ratio | Without Mortgage | With Mortgage |
| Less than 2.0x | 12 (6.3%) | 138,047 (19,721.0%) |
| 2.0x to 2.9x | 35 (18.4%) | 71 (10.1%) |
| 3.0x to 3.9x | 14 (7.4%) | 165 (23.6%) |
| 4.0x or more | 129 (67.9%) | 112 (16.0%) |
| Total | 190 (100.0%) | 700 (100.0%) |
Real Estate Taxes by Mortgage Status in Vine Hill
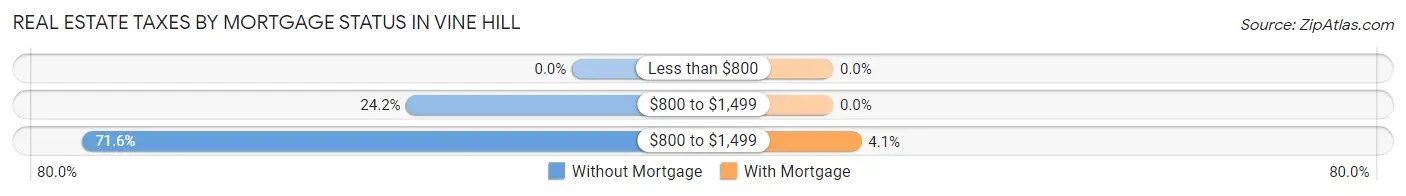
| Property Taxes | Without Mortgage | With Mortgage |
| Less than $800 | 0 (0.0%) | 0 (0.0%) |
| $800 to $1,499 | 46 (24.2%) | 0 (0.0%) |
| $800 to $1,499 | 136 (71.6%) | 29 (4.1%) |
| Total | 190 (100.0%) | 700 (100.0%) |
Health & Disability in Vine Hill
Health Insurance Coverage by Age in Vine Hill
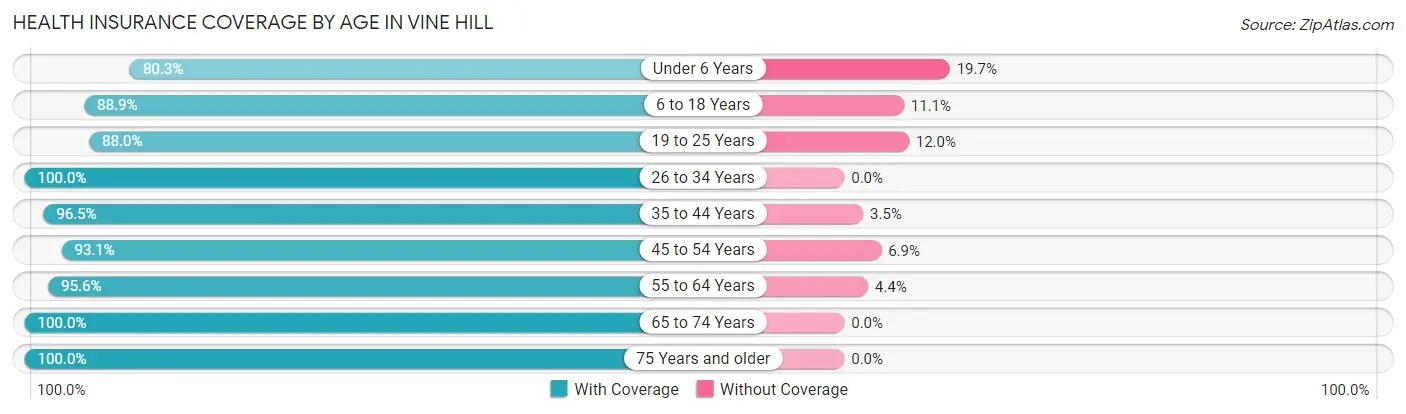
| Age Bracket | With Coverage | Without Coverage |
| Under 6 Years | 188 (80.3%) | 46 (19.7%) |
| 6 to 18 Years | 480 (88.9%) | 60 (11.1%) |
| 19 to 25 Years | 205 (88.0%) | 28 (12.0%) |
| 26 to 34 Years | 285 (100.0%) | 0 (0.0%) |
| 35 to 44 Years | 577 (96.5%) | 21 (3.5%) |
| 45 to 54 Years | 596 (93.1%) | 44 (6.9%) |
| 55 to 64 Years | 348 (95.6%) | 16 (4.4%) |
| 65 to 74 Years | 114 (100.0%) | 0 (0.0%) |
| 75 Years and older | 209 (100.0%) | 0 (0.0%) |
| Total | 3,002 (93.3%) | 215 (6.7%) |
Health Insurance Coverage by Citizenship Status in Vine Hill
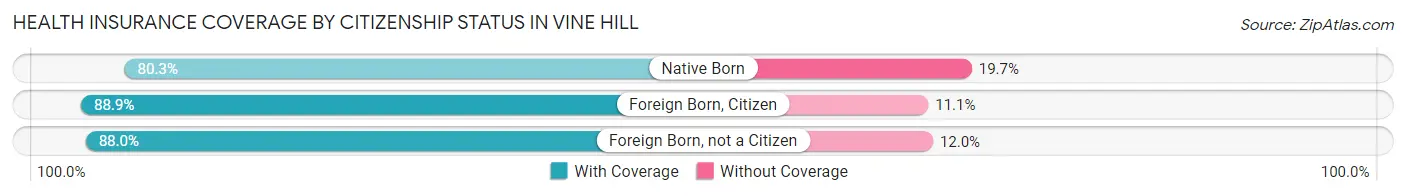
| Citizenship Status | With Coverage | Without Coverage |
| Native Born | 188 (80.3%) | 46 (19.7%) |
| Foreign Born, Citizen | 480 (88.9%) | 60 (11.1%) |
| Foreign Born, not a Citizen | 205 (88.0%) | 28 (12.0%) |
Health Insurance Coverage by Household Income in Vine Hill
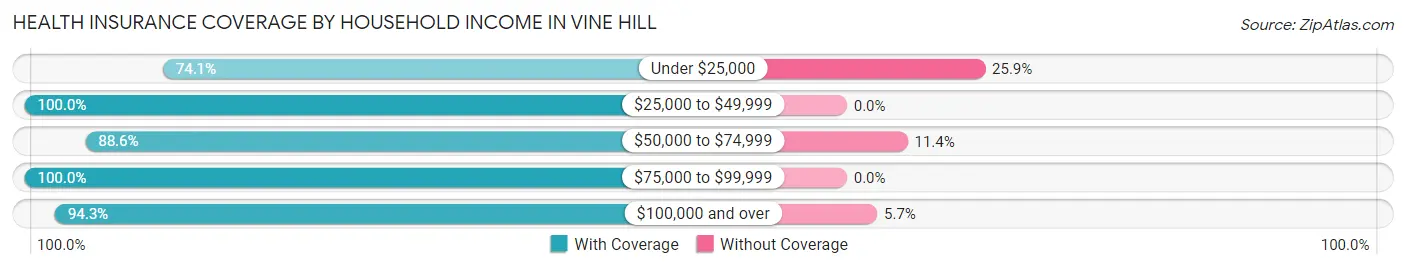
| Household Income | With Coverage | Without Coverage |
| Under $25,000 | 163 (74.1%) | 57 (25.9%) |
| $25,000 to $49,999 | 75 (100.0%) | 0 (0.0%) |
| $50,000 to $74,999 | 257 (88.6%) | 33 (11.4%) |
| $75,000 to $99,999 | 425 (100.0%) | 0 (0.0%) |
| $100,000 and over | 2,074 (94.3%) | 125 (5.7%) |
Public vs Private Health Insurance Coverage by Age in Vine Hill
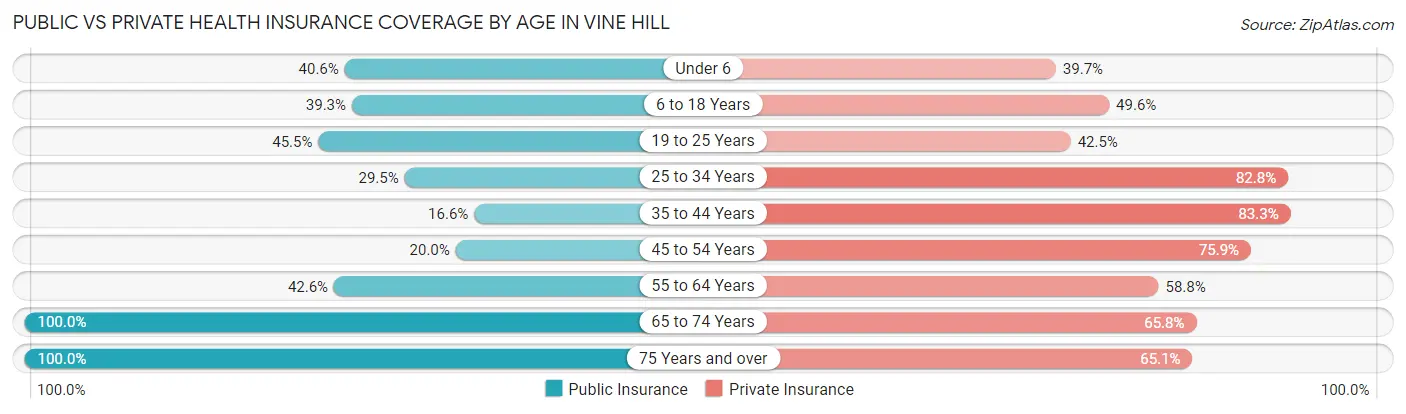
| Age Bracket | Public Insurance | Private Insurance |
| Under 6 | 95 (40.6%) | 93 (39.7%) |
| 6 to 18 Years | 212 (39.3%) | 268 (49.6%) |
| 19 to 25 Years | 106 (45.5%) | 99 (42.5%) |
| 25 to 34 Years | 84 (29.5%) | 236 (82.8%) |
| 35 to 44 Years | 99 (16.6%) | 498 (83.3%) |
| 45 to 54 Years | 128 (20.0%) | 486 (75.9%) |
| 55 to 64 Years | 155 (42.6%) | 214 (58.8%) |
| 65 to 74 Years | 114 (100.0%) | 75 (65.8%) |
| 75 Years and over | 209 (100.0%) | 136 (65.1%) |
| Total | 1,202 (37.4%) | 2,105 (65.4%) |
Disability Status by Sex by Age in Vine Hill
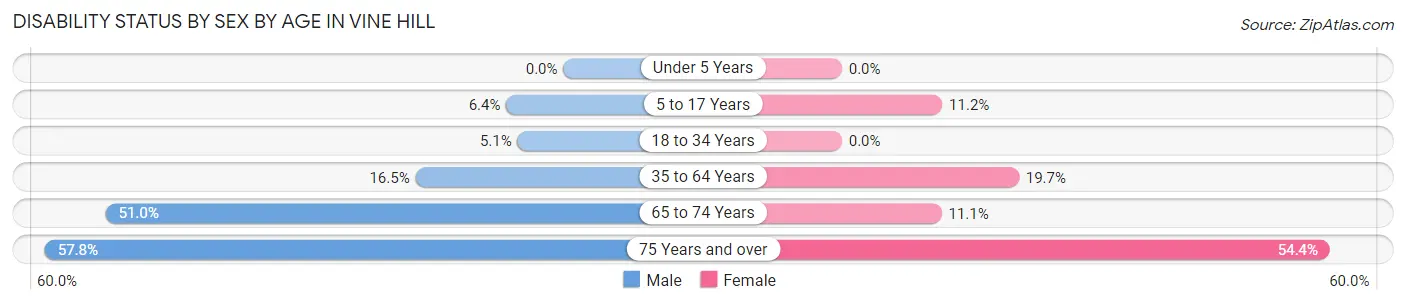
| Age Bracket | Male | Female |
| Under 5 Years | 0 (0.0%) | 0 (0.0%) |
| 5 to 17 Years | 24 (6.4%) | 19 (11.2%) |
| 18 to 34 Years | 13 (5.1%) | 0 (0.0%) |
| 35 to 64 Years | 141 (16.5%) | 147 (19.7%) |
| 65 to 74 Years | 26 (51.0%) | 7 (11.1%) |
| 75 Years and over | 41 (57.8%) | 75 (54.3%) |
Disability Class by Sex by Age in Vine Hill
Disability Class: Hearing Difficulty
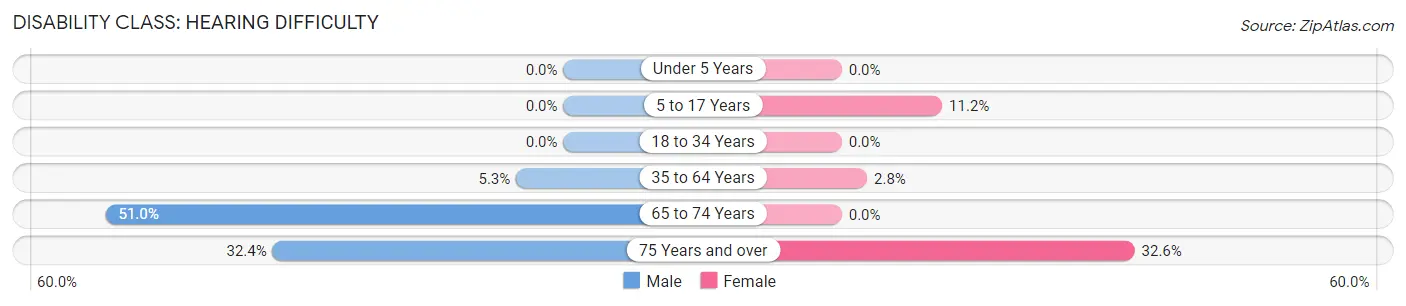
| Age Bracket | Male | Female |
| Under 5 Years | 0 (0.0%) | 0 (0.0%) |
| 5 to 17 Years | 0 (0.0%) | 19 (11.2%) |
| 18 to 34 Years | 0 (0.0%) | 0 (0.0%) |
| 35 to 64 Years | 45 (5.3%) | 21 (2.8%) |
| 65 to 74 Years | 26 (51.0%) | 0 (0.0%) |
| 75 Years and over | 23 (32.4%) | 45 (32.6%) |
Disability Class: Vision Difficulty
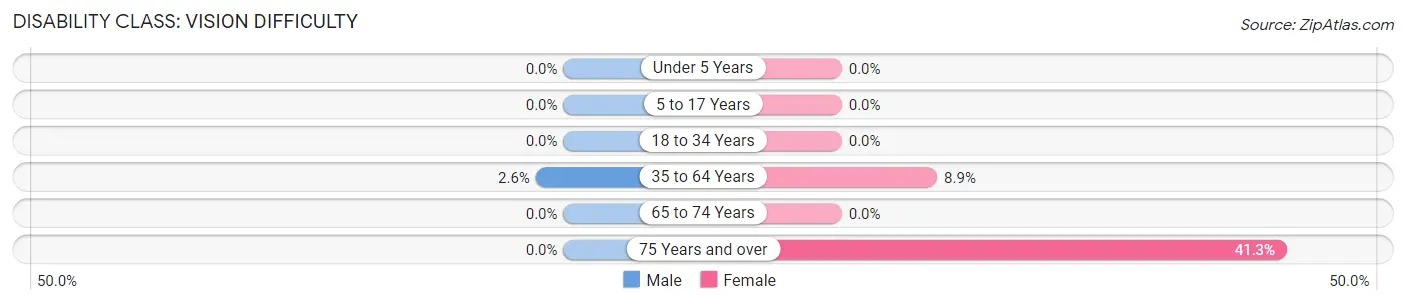
| Age Bracket | Male | Female |
| Under 5 Years | 0 (0.0%) | 0 (0.0%) |
| 5 to 17 Years | 0 (0.0%) | 0 (0.0%) |
| 18 to 34 Years | 0 (0.0%) | 0 (0.0%) |
| 35 to 64 Years | 22 (2.6%) | 66 (8.8%) |
| 65 to 74 Years | 0 (0.0%) | 0 (0.0%) |
| 75 Years and over | 0 (0.0%) | 57 (41.3%) |
Disability Class: Cognitive Difficulty
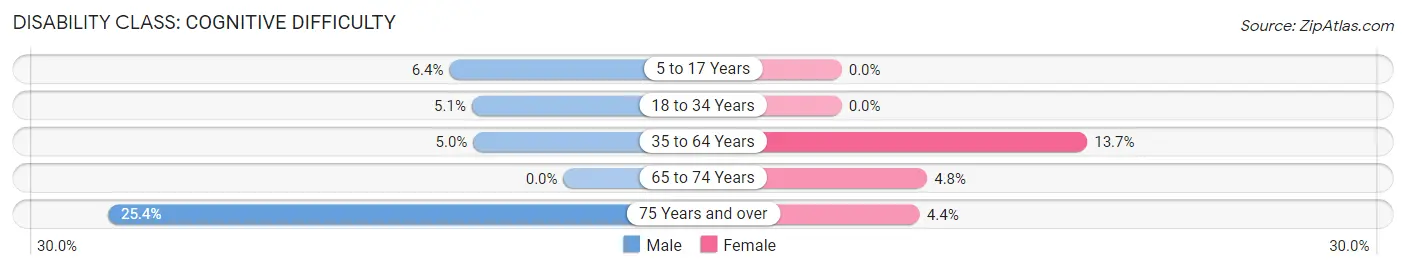
| Age Bracket | Male | Female |
| 5 to 17 Years | 24 (6.4%) | 0 (0.0%) |
| 18 to 34 Years | 13 (5.1%) | 0 (0.0%) |
| 35 to 64 Years | 43 (5.0%) | 102 (13.7%) |
| 65 to 74 Years | 0 (0.0%) | 3 (4.8%) |
| 75 Years and over | 18 (25.4%) | 6 (4.3%) |
Disability Class: Ambulatory Difficulty
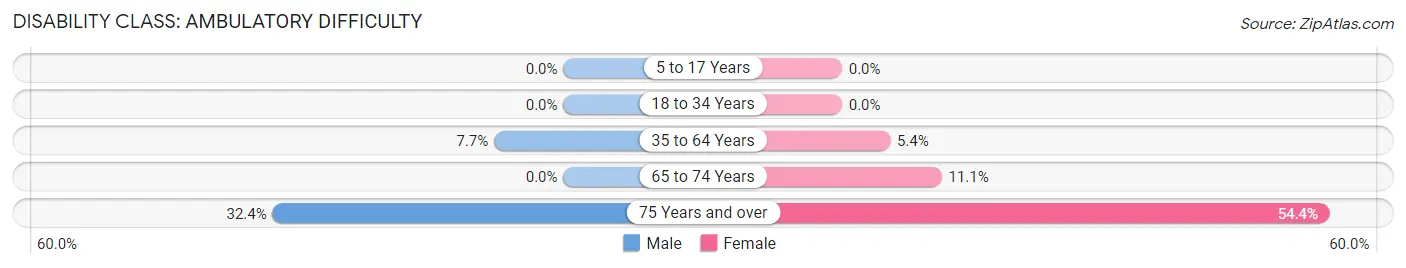
| Age Bracket | Male | Female |
| 5 to 17 Years | 0 (0.0%) | 0 (0.0%) |
| 18 to 34 Years | 0 (0.0%) | 0 (0.0%) |
| 35 to 64 Years | 66 (7.7%) | 40 (5.4%) |
| 65 to 74 Years | 0 (0.0%) | 7 (11.1%) |
| 75 Years and over | 23 (32.4%) | 75 (54.3%) |
Disability Class: Self-Care Difficulty
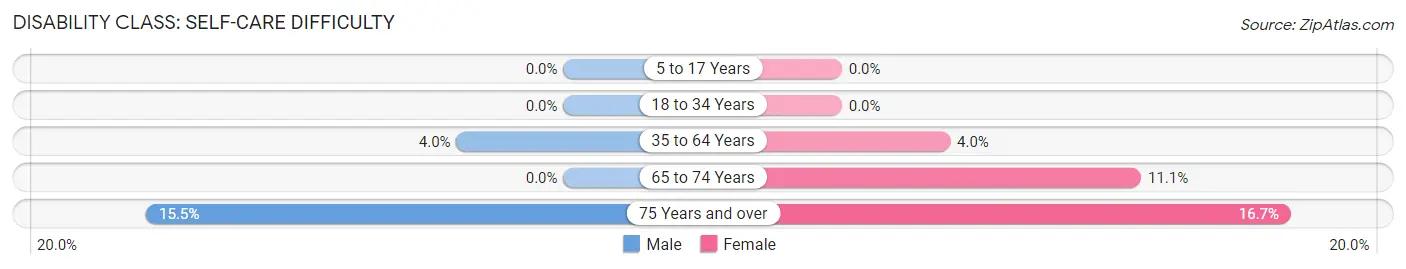
| Age Bracket | Male | Female |
| 5 to 17 Years | 0 (0.0%) | 0 (0.0%) |
| 18 to 34 Years | 0 (0.0%) | 0 (0.0%) |
| 35 to 64 Years | 34 (4.0%) | 30 (4.0%) |
| 65 to 74 Years | 0 (0.0%) | 7 (11.1%) |
| 75 Years and over | 11 (15.5%) | 23 (16.7%) |
Technology Access in Vine Hill
Computing Device Access in Vine Hill
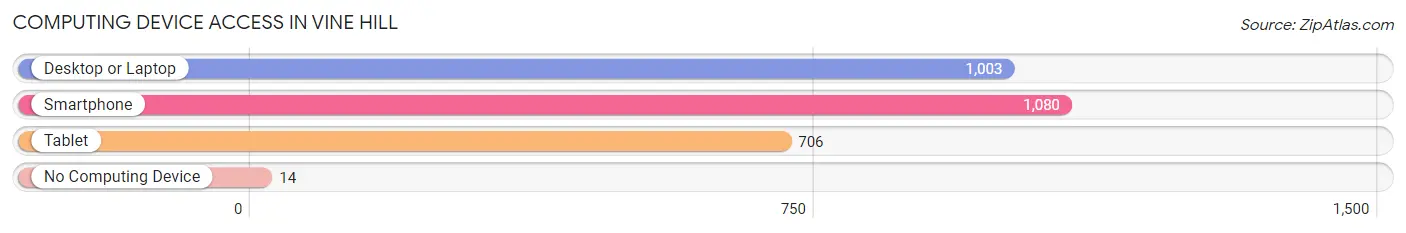
| Device Type | # Households | % Households |
| Desktop or Laptop | 1,003 | 84.5% |
| Smartphone | 1,080 | 91.0% |
| Tablet | 706 | 59.5% |
| No Computing Device | 14 | 1.2% |
| Total | 1,187 | 100.0% |
Internet Access in Vine Hill
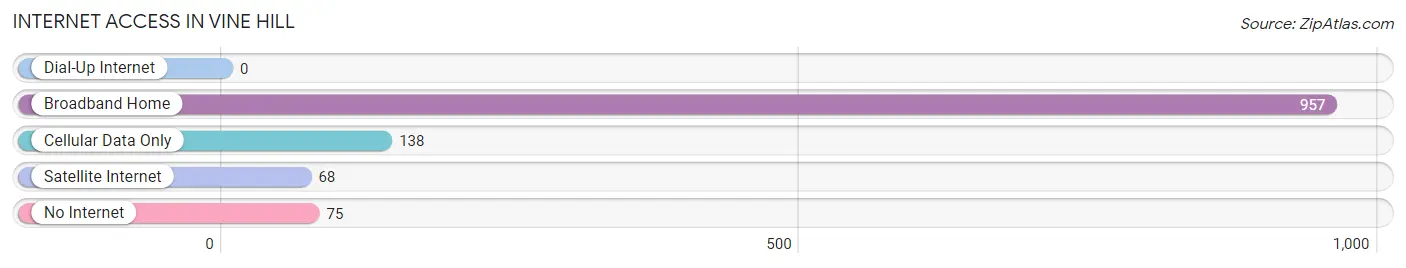
| Internet Type | # Households | % Households |
| Dial-Up Internet | 0 | 0.0% |
| Broadband Home | 957 | 80.6% |
| Cellular Data Only | 138 | 11.6% |
| Satellite Internet | 68 | 5.7% |
| No Internet | 75 | 6.3% |
| Total | 1,187 | 100.0% |
Vine Hill Summary
Vine Hill is a small unincorporated community located in Santa Cruz County, California. It is situated in the Santa Cruz Mountains, approximately 8 miles (13 km) northwest of the city of Santa Cruz. The community is located in a rural area, surrounded by redwood forests and vineyards.
History
Vine Hill was originally inhabited by the Ohlone people, who lived in the area for thousands of years before the arrival of Europeans. The first Europeans to settle in the area were Spanish missionaries, who established a mission in nearby Santa Cruz in 1791. The area around Vine Hill was used for cattle ranching and farming, and the first settlers arrived in the mid-1800s.
The community was named after the vineyards that were planted in the area in the late 1800s. The vineyards were planted by Italian immigrants who had come to the area to work in the local lumber industry. The vineyards were a major source of income for the community, and the grapes were used to make wine.
Geography
Vine Hill is located in the Santa Cruz Mountains, approximately 8 miles (13 km) northwest of the city of Santa Cruz. The community is situated at an elevation of 1,000 feet (305 m) above sea level. The area is characterized by rolling hills, redwood forests, and vineyards. The climate is mild, with temperatures ranging from the mid-50s to the mid-70s Fahrenheit (10-25 Celsius).
Economy
The economy of Vine Hill is largely based on agriculture. The area is known for its vineyards, which produce a variety of wines. The vineyards are also a major tourist attraction, and the area is home to several wineries and tasting rooms. In addition, the area is home to several small businesses, including a general store, a cafe, and a post office.
Demographics
As of the 2010 census, the population of Vine Hill was 1,093. The racial makeup of the community was 87.3% White, 0.9% African American, 0.7% Native American, 0.7% Asian, 0.1% Pacific Islander, 8.2% from other races, and 2.1% from two or more races. The median household income was $50,000, and the median age was 44.
Conclusion
Vine Hill is a small unincorporated community located in Santa Cruz County, California. It is situated in the Santa Cruz Mountains, approximately 8 miles (13 km) northwest of the city of Santa Cruz. The community is located in a rural area, surrounded by redwood forests and vineyards. The economy of Vine Hill is largely based on agriculture, with vineyards and wineries being the main sources of income. As of the 2010 census, the population of Vine Hill was 1,093. The racial makeup of the community was 87.3% White, 0.9% African American, 0.7% Native American, 0.7% Asian, 0.1% Pacific Islander, 8.2% from other races, and 2.1% from two or more races. The median household income was $50,000, and the median age was 44.
Common Questions
What is Per Capita Income in Vine Hill?
Per Capita income in Vine Hill is $53,807.
What is the Median Family Income in Vine Hill?
Median Family Income in Vine Hill is $150,278.
What is the Median Household income in Vine Hill?
Median Household Income in Vine Hill is $123,523.
What is Income or Wage Gap in Vine Hill?
Income or Wage Gap in Vine Hill is 30.8%.
Women in Vine Hill earn 69.2 cents for every dollar earned by a man.
What is Inequality or Gini Index in Vine Hill?
Inequality or Gini Index in Vine Hill is 0.38.
What is the Total Population of Vine Hill?
Total Population of Vine Hill is 3,217.
What is the Total Male Population of Vine Hill?
Total Male Population of Vine Hill is 1,684.
What is the Total Female Population of Vine Hill?
Total Female Population of Vine Hill is 1,533.
What is the Ratio of Males per 100 Females in Vine Hill?
There are 109.85 Males per 100 Females in Vine Hill.
What is the Ratio of Females per 100 Males in Vine Hill?
There are 91.03 Females per 100 Males in Vine Hill.
What is the Median Population Age in Vine Hill?
Median Population Age in Vine Hill is 37.9 Years.
What is the Average Family Size in Vine Hill
Average Family Size in Vine Hill is 3.4 People.
What is the Average Household Size in Vine Hill
Average Household Size in Vine Hill is 2.7 People.
How Large is the Labor Force in Vine Hill?
There are 1,728 People in the Labor Forcein in Vine Hill.
What is the Percentage of People in the Labor Force in Vine Hill?
67.9% of People are in the Labor Force in Vine Hill.
What is the Unemployment Rate in Vine Hill?
Unemployment Rate in Vine Hill is 7.5%.