Cities with the Highest Percentage of Population Employed in Computer & Mathematics in North Dakota
RELATED REPORTS & OPTIONS
Computer & Mathematics
North Dakota
Compare Cities
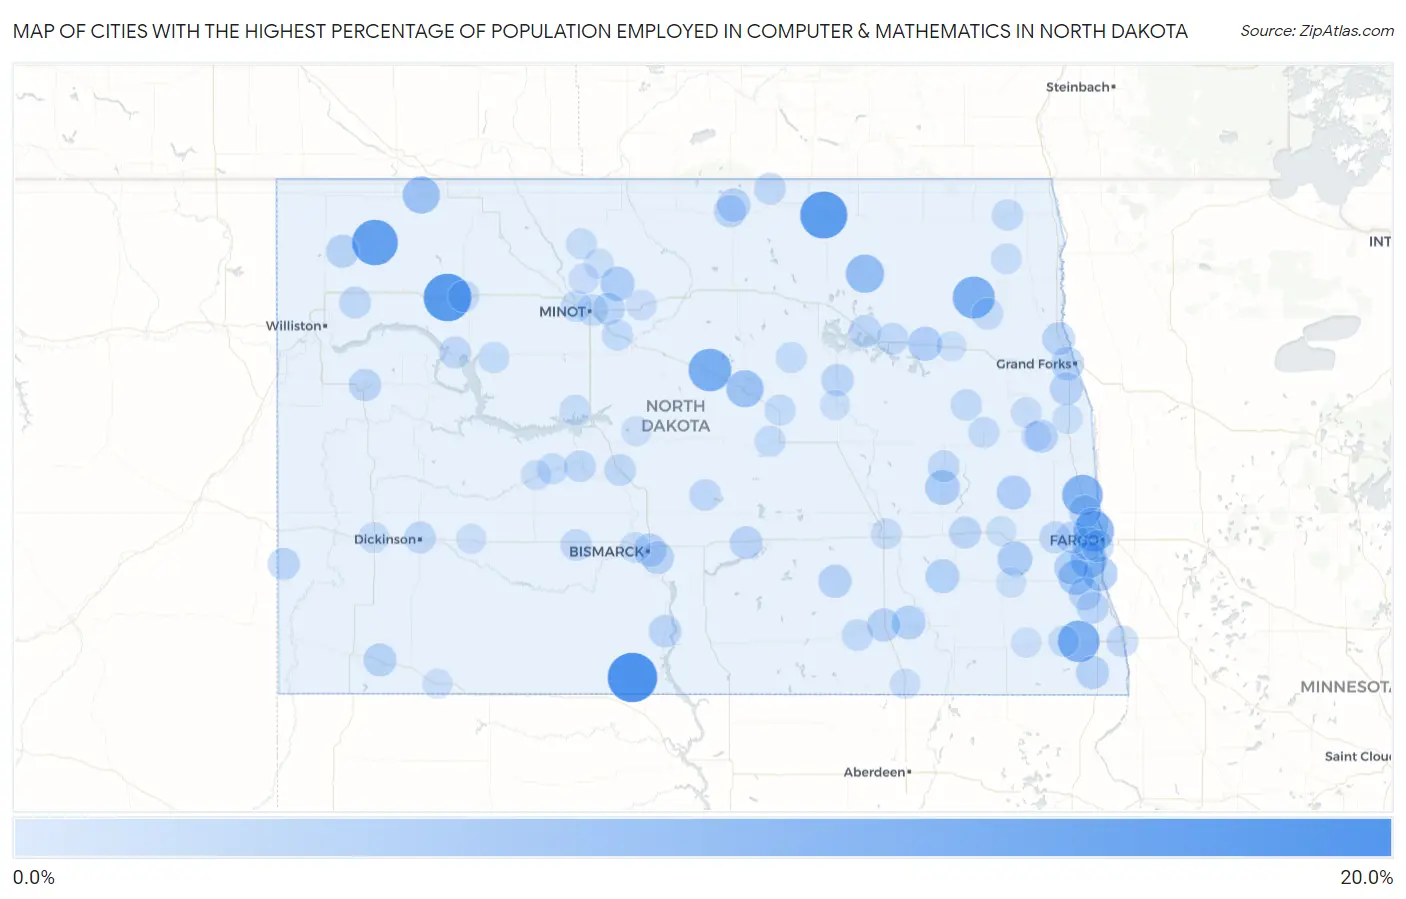
Map of Cities with the Highest Percentage of Population Employed in Computer & Mathematics in North Dakota
0.0%
20.0%
Cities with the Highest Percentage of Population Employed in Computer & Mathematics in North Dakota
| City | % Employed | vs State | vs National | |
| 1. | Selfridge | 18.2% | 1.8%(+16.4)#1 | 3.5%(+14.7)#205 |
| 2. | Ross | 16.3% | 1.8%(+14.5)#2 | 3.5%(+12.8)#253 |
| 3. | Rocklake | 15.9% | 1.8%(+14.1)#3 | 3.5%(+12.4)#273 |
| 4. | Wildrose | 14.5% | 1.8%(+12.7)#4 | 3.5%(+11.0)#338 |
| 5. | Anamoose | 11.8% | 1.8%(+9.95)#5 | 3.5%(+8.24)#519 |
| 6. | Lankin | 11.1% | 1.8%(+9.30)#6 | 3.5%(+7.59)#579 |
| 7. | Barney | 10.7% | 1.8%(+8.90)#7 | 3.5%(+7.19)#628 |
| 8. | Gardner | 9.8% | 1.8%(+7.94)#8 | 3.5%(+6.23)#781 |
| 9. | Reile S Acres | 9.7% | 1.8%(+7.92)#9 | 3.5%(+6.20)#784 |
| 10. | Starkweather | 7.7% | 1.8%(+5.88)#10 | 3.5%(+4.17)#1,342 |
| 11. | Columbus | 6.7% | 1.8%(+4.86)#11 | 3.5%(+3.14)#1,779 |
| 12. | Harvey | 6.6% | 1.8%(+4.77)#12 | 3.5%(+3.06)#1,822 |
| 13. | Horace | 5.7% | 1.8%(+3.89)#13 | 3.5%(+2.18)#2,391 |
| 14. | Kindred | 5.0% | 1.8%(+3.18)#14 | 3.5%(+1.47)#3,106 |
| 15. | Alice | 4.5% | 1.8%(+2.73)#15 | 3.5%(+1.02)#3,633 |
| 16. | Oxbow | 4.5% | 1.8%(+2.69)#16 | 3.5%(+0.975)#3,678 |
| 17. | Dazey | 4.4% | 1.8%(+2.63)#17 | 3.5%(+0.920)#3,744 |
| 18. | Deering | 4.1% | 1.8%(+2.27)#18 | 3.5%(+0.557)#4,347 |
| 19. | Lakota | 3.9% | 1.8%(+2.09)#19 | 3.5%(+0.376)#4,634 |
| 20. | Page | 3.8% | 1.8%(+2.00)#20 | 3.5%(+0.285)#4,806 |
| 21. | Litchville | 3.8% | 1.8%(+1.96)#21 | 3.5%(+0.249)#4,877 |
| 22. | Davenport | 3.7% | 1.8%(+1.94)#22 | 3.5%(+0.225)#4,910 |
| 23. | Berlin | 3.6% | 1.8%(+1.76)#23 | 3.5%(+0.047)#5,266 |
| 24. | West Fargo | 3.3% | 1.8%(+1.50)#24 | 3.5%(-0.215)#5,844 |
| 25. | East Dunseith | 3.1% | 1.8%(+1.33)#25 | 3.5%(-0.380)#6,251 |
| 26. | Hankinson | 3.1% | 1.8%(+1.28)#26 | 3.5%(-0.432)#6,371 |
| 27. | Mayville | 3.1% | 1.8%(+1.27)#27 | 3.5%(-0.439)#6,397 |
| 28. | Grand Forks | 3.1% | 1.8%(+1.27)#28 | 3.5%(-0.443)#6,403 |
| 29. | Edgeley | 3.0% | 1.8%(+1.20)#29 | 3.5%(-0.513)#6,563 |
| 30. | Gackle | 3.0% | 1.8%(+1.19)#30 | 3.5%(-0.525)#6,598 |
| 31. | Alamo | 2.9% | 1.8%(+1.13)#31 | 3.5%(-0.583)#6,749 |
| 32. | Scranton | 2.9% | 1.8%(+1.09)#32 | 3.5%(-0.626)#6,837 |
| 33. | Bismarck | 2.9% | 1.8%(+1.06)#33 | 3.5%(-0.652)#6,906 |
| 34. | Manvel | 2.8% | 1.8%(+1.01)#34 | 3.5%(-0.708)#7,048 |
| 35. | Lincoln | 2.7% | 1.8%(+0.925)#35 | 3.5%(-0.788)#7,284 |
| 36. | Thompson | 2.7% | 1.8%(+0.874)#36 | 3.5%(-0.839)#7,415 |
| 37. | Steele | 2.6% | 1.8%(+0.779)#37 | 3.5%(-0.934)#7,654 |
| 38. | Walcott | 2.6% | 1.8%(+0.769)#38 | 3.5%(-0.944)#7,691 |
| 39. | Cannon Ball | 2.5% | 1.8%(+0.642)#39 | 3.5%(-1.07)#8,090 |
| 40. | Devils Lake | 2.4% | 1.8%(+0.602)#40 | 3.5%(-1.11)#8,214 |
| 41. | Sheyenne | 2.4% | 1.8%(+0.569)#41 | 3.5%(-1.14)#8,332 |
| 42. | Dunseith | 2.4% | 1.8%(+0.561)#42 | 3.5%(-1.15)#8,360 |
| 43. | Watford City | 2.4% | 1.8%(+0.550)#43 | 3.5%(-1.16)#8,386 |
| 44. | Mapleton | 2.3% | 1.8%(+0.538)#44 | 3.5%(-1.18)#8,428 |
| 45. | Argusville | 2.1% | 1.8%(+0.336)#45 | 3.5%(-1.38)#9,141 |
| 46. | Valley City | 2.1% | 1.8%(+0.298)#46 | 3.5%(-1.42)#9,265 |
| 47. | Harwood | 2.1% | 1.8%(+0.294)#47 | 3.5%(-1.42)#9,282 |
| 48. | Fargo | 2.1% | 1.8%(+0.275)#48 | 3.5%(-1.44)#9,352 |
| 49. | Golva | 2.1% | 1.8%(+0.272)#49 | 3.5%(-1.44)#9,369 |
| 50. | Surrey | 2.1% | 1.8%(+0.246)#50 | 3.5%(-1.47)#9,451 |
| 51. | Colfax | 2.0% | 1.8%(+0.188)#51 | 3.5%(-1.52)#9,648 |
| 52. | Hannaford | 2.0% | 1.8%(+0.149)#52 | 3.5%(-1.56)#9,805 |
| 53. | Dickinson | 1.9% | 1.8%(+0.104)#53 | 3.5%(-1.61)#9,973 |
| 54. | St John | 1.9% | 1.8%(+0.093)#54 | 3.5%(-1.62)#10,022 |
| 55. | New Town | 1.9% | 1.8%(+0.054)#55 | 3.5%(-1.66)#10,151 |
| 56. | Washburn | 1.9% | 1.8%(+0.054)#56 | 3.5%(-1.66)#10,152 |
| 57. | Stanton | 1.8% | 1.8%(+0.007)#57 | 3.5%(-1.71)#10,336 |
| 58. | Crary | 1.8% | 1.8%(+0.007)#58 | 3.5%(-1.71)#10,346 |
| 59. | Casselton | 1.8% | 1.8%(-0.020)#59 | 3.5%(-1.73)#10,460 |
| 60. | Wahpeton | 1.8% | 1.8%(-0.052)#60 | 3.5%(-1.76)#10,595 |
| 61. | New Salem | 1.8% | 1.8%(-0.053)#61 | 3.5%(-1.77)#10,600 |
| 62. | Epping | 1.8% | 1.8%(-0.057)#62 | 3.5%(-1.77)#10,626 |
| 63. | Wing | 1.7% | 1.8%(-0.088)#63 | 3.5%(-1.80)#10,749 |
| 64. | Minot | 1.7% | 1.8%(-0.114)#64 | 3.5%(-1.83)#10,850 |
| 65. | Burlington | 1.7% | 1.8%(-0.147)#65 | 3.5%(-1.86)#10,983 |
| 66. | Kulm | 1.7% | 1.8%(-0.159)#66 | 3.5%(-1.87)#11,035 |
| 67. | Stanley | 1.6% | 1.8%(-0.234)#67 | 3.5%(-1.95)#11,364 |
| 68. | Cavalier | 1.5% | 1.8%(-0.264)#68 | 3.5%(-1.98)#11,481 |
| 69. | Fordville | 1.5% | 1.8%(-0.273)#69 | 3.5%(-1.99)#11,511 |
| 70. | Aneta | 1.5% | 1.8%(-0.341)#70 | 3.5%(-2.05)#11,825 |
| 71. | Finley | 1.3% | 1.8%(-0.469)#71 | 3.5%(-2.18)#12,343 |
| 72. | Sawyer | 1.3% | 1.8%(-0.478)#72 | 3.5%(-2.19)#12,388 |
| 73. | Maddock | 1.3% | 1.8%(-0.521)#73 | 3.5%(-2.23)#12,592 |
| 74. | Parshall | 1.3% | 1.8%(-0.538)#74 | 3.5%(-2.25)#12,670 |
| 75. | Fessenden | 1.2% | 1.8%(-0.600)#75 | 3.5%(-2.31)#12,945 |
| 76. | Hazen | 1.2% | 1.8%(-0.604)#76 | 3.5%(-2.32)#12,967 |
| 77. | Wyndmere | 1.2% | 1.8%(-0.644)#77 | 3.5%(-2.36)#13,152 |
| 78. | Bowdon | 1.2% | 1.8%(-0.649)#78 | 3.5%(-2.36)#13,177 |
| 79. | Jamestown | 1.0% | 1.8%(-0.802)#79 | 3.5%(-2.51)#13,864 |
| 80. | Lansford | 1.0% | 1.8%(-0.812)#80 | 3.5%(-2.52)#13,910 |
| 81. | Mandan | 0.99% | 1.8%(-0.818)#81 | 3.5%(-2.53)#13,933 |
| 82. | Belfield | 0.99% | 1.8%(-0.825)#82 | 3.5%(-2.54)#13,967 |
| 83. | Garrison | 0.94% | 1.8%(-0.871)#83 | 3.5%(-2.58)#14,166 |
| 84. | Hatton | 0.91% | 1.8%(-0.903)#84 | 3.5%(-2.62)#14,318 |
| 85. | Hoople | 0.91% | 1.8%(-0.903)#85 | 3.5%(-2.62)#14,320 |
| 86. | Minot Afb | 0.75% | 1.8%(-1.06)#86 | 3.5%(-2.77)#15,073 |
| 87. | Granville | 0.69% | 1.8%(-1.12)#87 | 3.5%(-2.83)#15,339 |
| 88. | Ellendale | 0.64% | 1.8%(-1.17)#88 | 3.5%(-2.89)#15,628 |
| 89. | Beulah | 0.57% | 1.8%(-1.24)#89 | 3.5%(-2.95)#15,922 |
| 90. | Buxton | 0.56% | 1.8%(-1.25)#90 | 3.5%(-2.96)#15,976 |
| 91. | Tower City | 0.52% | 1.8%(-1.30)#91 | 3.5%(-3.01)#16,164 |
| 92. | Glenburn | 0.49% | 1.8%(-1.33)#92 | 3.5%(-3.04)#16,289 |
| 93. | Richardton | 0.47% | 1.8%(-1.34)#93 | 3.5%(-3.05)#16,343 |
| 94. | Milnor | 0.47% | 1.8%(-1.34)#94 | 3.5%(-3.06)#16,359 |
| 95. | Michigan City | 0.47% | 1.8%(-1.34)#95 | 3.5%(-3.06)#16,361 |
| 96. | Enderlin | 0.44% | 1.8%(-1.37)#96 | 3.5%(-3.09)#16,469 |
| 97. | Turtle Lake | 0.44% | 1.8%(-1.37)#97 | 3.5%(-3.09)#16,471 |
| 98. | New Rockford | 0.44% | 1.8%(-1.37)#98 | 3.5%(-3.09)#16,473 |
| 99. | Hettinger | 0.38% | 1.8%(-1.43)#99 | 3.5%(-3.15)#16,684 |
| 100. | Portland | 0.36% | 1.8%(-1.45)#100 | 3.5%(-3.16)#16,727 |
Common Questions
What are the Top 10 Cities with the Highest Percentage of Population Employed in Computer & Mathematics in North Dakota?
Top 10 Cities with the Highest Percentage of Population Employed in Computer & Mathematics in North Dakota are:
#1
18.2%
#2
16.3%
#3
15.9%
#4
14.5%
#5
11.8%
#6
11.1%
#7
10.7%
#8
9.8%
#9
9.7%
#10
7.7%
What city has the Highest Percentage of Population Employed in Computer & Mathematics in North Dakota?
Selfridge has the Highest Percentage of Population Employed in Computer & Mathematics in North Dakota with 18.2%.
What is the Percentage of Population Employed in Computer & Mathematics in the State of North Dakota?
Percentage of Population Employed in Computer & Mathematics in North Dakota is 1.8%.
What is the Percentage of Population Employed in Computer & Mathematics in the United States?
Percentage of Population Employed in Computer & Mathematics in the United States is 3.5%.