Cities with the Highest Percentage of Population Employed in Computer & Mathematics in Arkansas
RELATED REPORTS & OPTIONS
Computer & Mathematics
Arkansas
Compare Cities
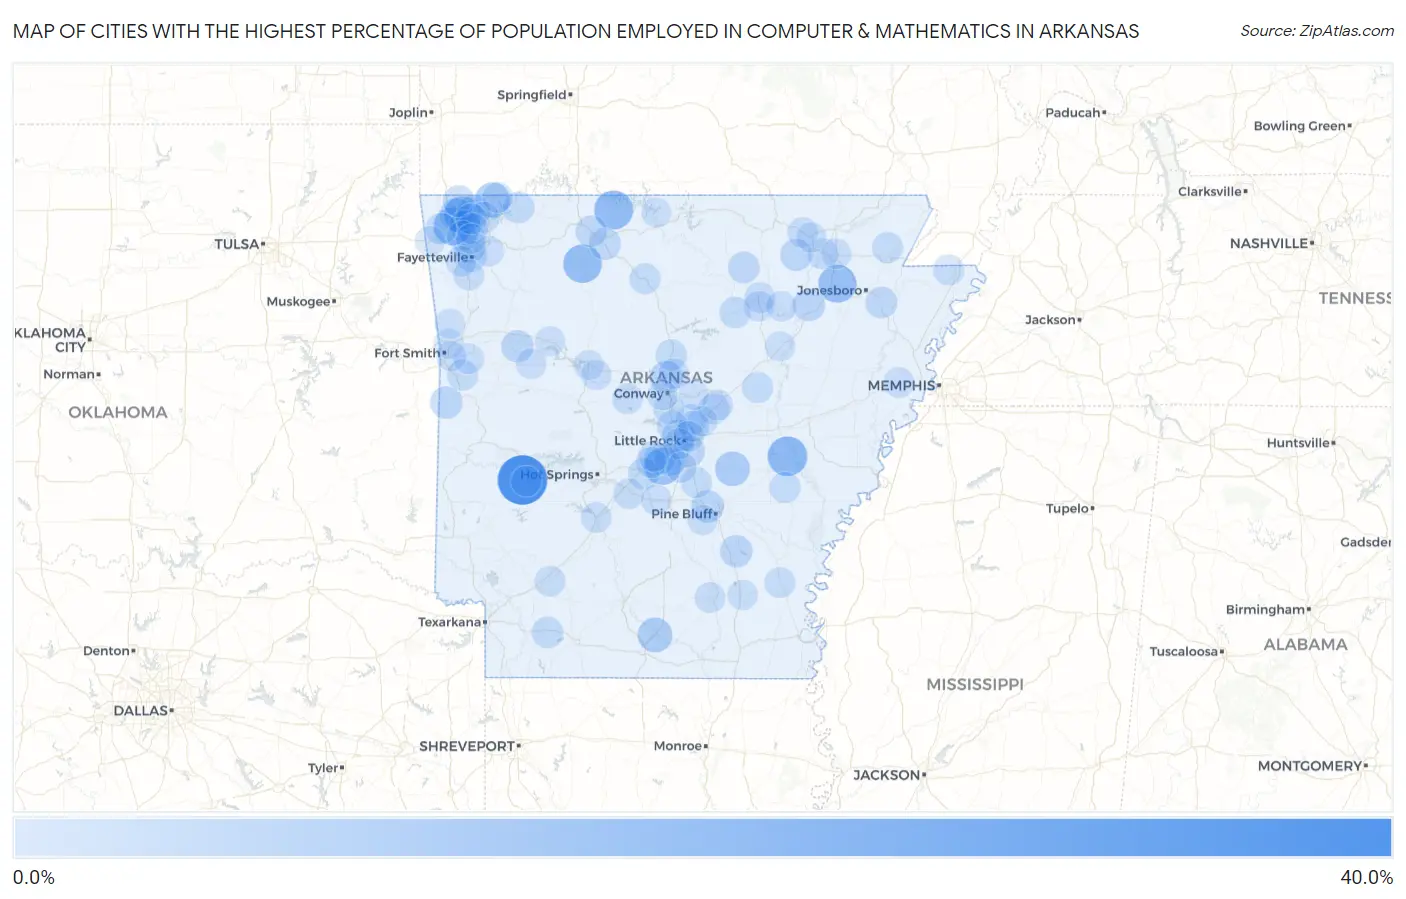
Map of Cities with the Highest Percentage of Population Employed in Computer & Mathematics in Arkansas
0.0%
40.0%
Cities with the Highest Percentage of Population Employed in Computer & Mathematics in Arkansas
| City | % Employed | vs State | vs National | |
| 1. | Black Springs | 33.3% | 2.2%(+31.2)#1 | 3.5%(+29.8)#58 |
| 2. | Center Point | 21.2% | 2.2%(+19.1)#2 | 3.5%(+17.7)#150 |
| 3. | Roe | 17.0% | 2.2%(+14.9)#3 | 3.5%(+13.5)#234 |
| 4. | South Lead Hill | 15.8% | 2.2%(+13.6)#4 | 3.5%(+12.3)#280 |
| 5. | Jasper | 15.3% | 2.2%(+13.1)#5 | 3.5%(+11.8)#302 |
| 6. | Egypt | 14.3% | 2.2%(+12.1)#6 | 3.5%(+10.8)#354 |
| 7. | Highfill | 14.1% | 2.2%(+12.0)#7 | 3.5%(+10.6)#361 |
| 8. | Bauxite | 13.2% | 2.2%(+11.0)#8 | 3.5%(+9.66)#418 |
| 9. | Bentonville | 13.1% | 2.2%(+11.0)#9 | 3.5%(+9.60)#425 |
| 10. | Sardis | 12.0% | 2.2%(+9.81)#10 | 3.5%(+8.44)#499 |
| 11. | Garfield | 9.6% | 2.2%(+7.48)#11 | 3.5%(+6.11)#805 |
| 12. | Calion | 9.1% | 2.2%(+6.98)#12 | 3.5%(+5.62)#911 |
| 13. | Coy | 9.1% | 2.2%(+6.93)#13 | 3.5%(+5.57)#924 |
| 14. | Cammack Village | 6.9% | 2.2%(+4.76)#14 | 3.5%(+3.39)#1,642 |
| 15. | Centerton | 6.8% | 2.2%(+4.68)#15 | 3.5%(+3.31)#1,691 |
| 16. | Little Flock | 6.4% | 2.2%(+4.23)#16 | 3.5%(+2.87)#1,917 |
| 17. | Wooster | 6.4% | 2.2%(+4.22)#17 | 3.5%(+2.85)#1,925 |
| 18. | White Hall | 5.7% | 2.2%(+3.59)#18 | 3.5%(+2.22)#2,356 |
| 19. | Star City | 5.6% | 2.2%(+3.40)#19 | 3.5%(+2.04)#2,519 |
| 20. | Tuckerman | 5.5% | 2.2%(+3.33)#20 | 3.5%(+1.96)#2,583 |
| 21. | Hartford | 5.4% | 2.2%(+3.21)#21 | 3.5%(+1.84)#2,710 |
| 22. | Denning | 5.3% | 2.2%(+3.11)#22 | 3.5%(+1.74)#2,806 |
| 23. | Smithville | 5.1% | 2.2%(+2.97)#23 | 3.5%(+1.60)#2,946 |
| 24. | Sweet Home | 4.9% | 2.2%(+2.73)#24 | 3.5%(+1.36)#3,222 |
| 25. | Johnson | 4.8% | 2.2%(+2.66)#25 | 3.5%(+1.30)#3,299 |
| 26. | Cave Springs | 4.8% | 2.2%(+2.63)#26 | 3.5%(+1.26)#3,342 |
| 27. | Shannon Hills | 4.7% | 2.2%(+2.55)#27 | 3.5%(+1.18)#3,431 |
| 28. | Bay | 4.5% | 2.2%(+2.33)#28 | 3.5%(+0.959)#3,699 |
| 29. | Mount Pleasant | 4.5% | 2.2%(+2.32)#29 | 3.5%(+0.953)#3,705 |
| 30. | Valley Springs | 4.5% | 2.2%(+2.32)#30 | 3.5%(+0.953)#3,707 |
| 31. | Harrison | 4.4% | 2.2%(+2.24)#31 | 3.5%(+0.869)#3,835 |
| 32. | Bella Vista | 4.3% | 2.2%(+2.18)#32 | 3.5%(+0.813)#3,915 |
| 33. | Bryant | 4.3% | 2.2%(+2.14)#33 | 3.5%(+0.778)#3,975 |
| 34. | Stamps | 4.3% | 2.2%(+2.12)#34 | 3.5%(+0.755)#4,006 |
| 35. | Eureka Springs | 4.2% | 2.2%(+2.03)#35 | 3.5%(+0.663)#4,146 |
| 36. | Haskell | 4.1% | 2.2%(+1.95)#36 | 3.5%(+0.588)#4,284 |
| 37. | Concord | 4.1% | 2.2%(+1.92)#37 | 3.5%(+0.557)#4,346 |
| 38. | Springtown | 4.0% | 2.2%(+1.84)#38 | 3.5%(+0.475)#4,463 |
| 39. | Damascus | 3.9% | 2.2%(+1.72)#39 | 3.5%(+0.351)#4,683 |
| 40. | Gibson | 3.8% | 2.2%(+1.69)#40 | 3.5%(+0.324)#4,719 |
| 41. | Prairie Creek | 3.8% | 2.2%(+1.63)#41 | 3.5%(+0.266)#4,850 |
| 42. | Griffithville | 3.7% | 2.2%(+1.52)#42 | 3.5%(+0.152)#5,052 |
| 43. | Maumelle | 3.6% | 2.2%(+1.43)#43 | 3.5%(+0.063)#5,230 |
| 44. | Greenwood | 3.5% | 2.2%(+1.33)#44 | 3.5%(-0.039)#5,452 |
| 45. | Sherwood | 3.5% | 2.2%(+1.31)#45 | 3.5%(-0.061)#5,500 |
| 46. | Fayetteville | 3.4% | 2.2%(+1.29)#46 | 3.5%(-0.081)#5,547 |
| 47. | Marshall | 3.4% | 2.2%(+1.24)#47 | 3.5%(-0.127)#5,641 |
| 48. | Oak Grove Heights | 3.4% | 2.2%(+1.24)#48 | 3.5%(-0.130)#5,647 |
| 49. | Lowell | 3.4% | 2.2%(+1.23)#49 | 3.5%(-0.136)#5,668 |
| 50. | Redfield | 3.3% | 2.2%(+1.19)#50 | 3.5%(-0.179)#5,762 |
| 51. | Almyra | 3.3% | 2.2%(+1.18)#51 | 3.5%(-0.191)#5,798 |
| 52. | Elm Springs | 3.3% | 2.2%(+1.17)#52 | 3.5%(-0.194)#5,802 |
| 53. | Gosnell | 3.2% | 2.2%(+1.07)#53 | 3.5%(-0.293)#6,034 |
| 54. | Mayflower | 3.2% | 2.2%(+1.06)#54 | 3.5%(-0.302)#6,058 |
| 55. | Cabot | 3.2% | 2.2%(+1.00)#55 | 3.5%(-0.362)#6,199 |
| 56. | Emmet | 3.1% | 2.2%(+0.981)#56 | 3.5%(-0.386)#6,263 |
| 57. | Rogers | 3.1% | 2.2%(+0.946)#57 | 3.5%(-0.421)#6,344 |
| 58. | Tillar | 3.0% | 2.2%(+0.872)#58 | 3.5%(-0.494)#6,532 |
| 59. | Portia | 3.0% | 2.2%(+0.859)#59 | 3.5%(-0.507)#6,554 |
| 60. | Benton | 3.0% | 2.2%(+0.855)#60 | 3.5%(-0.512)#6,561 |
| 61. | Perry | 3.0% | 2.2%(+0.812)#61 | 3.5%(-0.554)#6,669 |
| 62. | West Fork | 3.0% | 2.2%(+0.806)#62 | 3.5%(-0.561)#6,687 |
| 63. | Caddo Valley | 3.0% | 2.2%(+0.803)#63 | 3.5%(-0.564)#6,695 |
| 64. | Batesville | 3.0% | 2.2%(+0.793)#64 | 3.5%(-0.574)#6,717 |
| 65. | Austin | 2.9% | 2.2%(+0.787)#65 | 3.5%(-0.580)#6,734 |
| 66. | Perla | 2.9% | 2.2%(+0.741)#66 | 3.5%(-0.626)#6,839 |
| 67. | Little Rock | 2.9% | 2.2%(+0.697)#67 | 3.5%(-0.669)#6,962 |
| 68. | Salem | 2.8% | 2.2%(+0.686)#68 | 3.5%(-0.680)#6,991 |
| 69. | Farmington | 2.8% | 2.2%(+0.679)#69 | 3.5%(-0.688)#7,004 |
| 70. | Warren | 2.8% | 2.2%(+0.649)#70 | 3.5%(-0.718)#7,078 |
| 71. | East End | 2.8% | 2.2%(+0.623)#71 | 3.5%(-0.744)#7,153 |
| 72. | Subiaco | 2.7% | 2.2%(+0.589)#72 | 3.5%(-0.777)#7,250 |
| 73. | Jennette | 2.7% | 2.2%(+0.545)#73 | 3.5%(-0.822)#7,376 |
| 74. | Goshen | 2.7% | 2.2%(+0.540)#74 | 3.5%(-0.827)#7,384 |
| 75. | Lavaca | 2.7% | 2.2%(+0.533)#75 | 3.5%(-0.834)#7,402 |
| 76. | Prattsville | 2.7% | 2.2%(+0.509)#76 | 3.5%(-0.858)#7,469 |
| 77. | Norman | 2.7% | 2.2%(+0.502)#77 | 3.5%(-0.865)#7,491 |
| 78. | Southside | 2.6% | 2.2%(+0.449)#78 | 3.5%(-0.918)#7,622 |
| 79. | Greenbrier | 2.6% | 2.2%(+0.418)#79 | 3.5%(-0.949)#7,706 |
| 80. | Pottsville | 2.5% | 2.2%(+0.388)#80 | 3.5%(-0.979)#7,812 |
| 81. | Gateway | 2.5% | 2.2%(+0.363)#81 | 3.5%(-1.00)#7,877 |
| 82. | North Little Rock | 2.5% | 2.2%(+0.354)#82 | 3.5%(-1.01)#7,900 |
| 83. | Walnut Ridge | 2.5% | 2.2%(+0.345)#83 | 3.5%(-1.02)#7,919 |
| 84. | Newark | 2.5% | 2.2%(+0.301)#84 | 3.5%(-1.07)#8,066 |
| 85. | Monticello | 2.5% | 2.2%(+0.297)#85 | 3.5%(-1.07)#8,086 |
| 86. | Ravenden | 2.4% | 2.2%(+0.223)#86 | 3.5%(-1.14)#8,327 |
| 87. | Conway | 2.4% | 2.2%(+0.214)#87 | 3.5%(-1.15)#8,364 |
| 88. | Sulphur Springs | 2.2% | 2.2%(+0.092)#88 | 3.5%(-1.27)#8,781 |
| 89. | Bradford | 2.2% | 2.2%(+0.040)#89 | 3.5%(-1.33)#8,951 |
| 90. | Imboden | 2.2% | 2.2%(+0.024)#90 | 3.5%(-1.34)#9,013 |
| 91. | Van Buren | 2.2% | 2.2%(-0.002)#91 | 3.5%(-1.37)#9,101 |
| 92. | Springdale | 2.1% | 2.2%(-0.018)#92 | 3.5%(-1.39)#9,162 |
| 93. | Russellville | 2.1% | 2.2%(-0.027)#93 | 3.5%(-1.39)#9,192 |
| 94. | Clarksville | 2.1% | 2.2%(-0.053)#94 | 3.5%(-1.42)#9,290 |
| 95. | Cedarville | 2.1% | 2.2%(-0.063)#95 | 3.5%(-1.43)#9,314 |
| 96. | Jacksonville | 2.1% | 2.2%(-0.080)#96 | 3.5%(-1.45)#9,382 |
| 97. | Siloam Springs | 2.1% | 2.2%(-0.097)#97 | 3.5%(-1.46)#9,444 |
| 98. | Lakeview | 2.0% | 2.2%(-0.110)#98 | 3.5%(-1.48)#9,479 |
| 99. | Fort Smith | 2.0% | 2.2%(-0.129)#99 | 3.5%(-1.50)#9,538 |
| 100. | Vilonia | 2.0% | 2.2%(-0.186)#100 | 3.5%(-1.55)#9,748 |
Common Questions
What are the Top 10 Cities with the Highest Percentage of Population Employed in Computer & Mathematics in Arkansas?
Top 10 Cities with the Highest Percentage of Population Employed in Computer & Mathematics in Arkansas are:
#1
33.3%
#2
17.0%
#3
15.8%
#4
15.3%
#5
14.3%
#6
14.1%
#7
13.2%
#8
13.1%
#9
9.6%
#10
9.1%
What city has the Highest Percentage of Population Employed in Computer & Mathematics in Arkansas?
Black Springs has the Highest Percentage of Population Employed in Computer & Mathematics in Arkansas with 33.3%.
What is the Percentage of Population Employed in Computer & Mathematics in the State of Arkansas?
Percentage of Population Employed in Computer & Mathematics in Arkansas is 2.2%.
What is the Percentage of Population Employed in Computer & Mathematics in the United States?
Percentage of Population Employed in Computer & Mathematics in the United States is 3.5%.