Zip Codes with the Highest Percentage of Population with a Degree in Engineering in Los Angeles, CA
RELATED REPORTS & OPTIONS
Engineering
Los Angeles
Compare Zip Codes
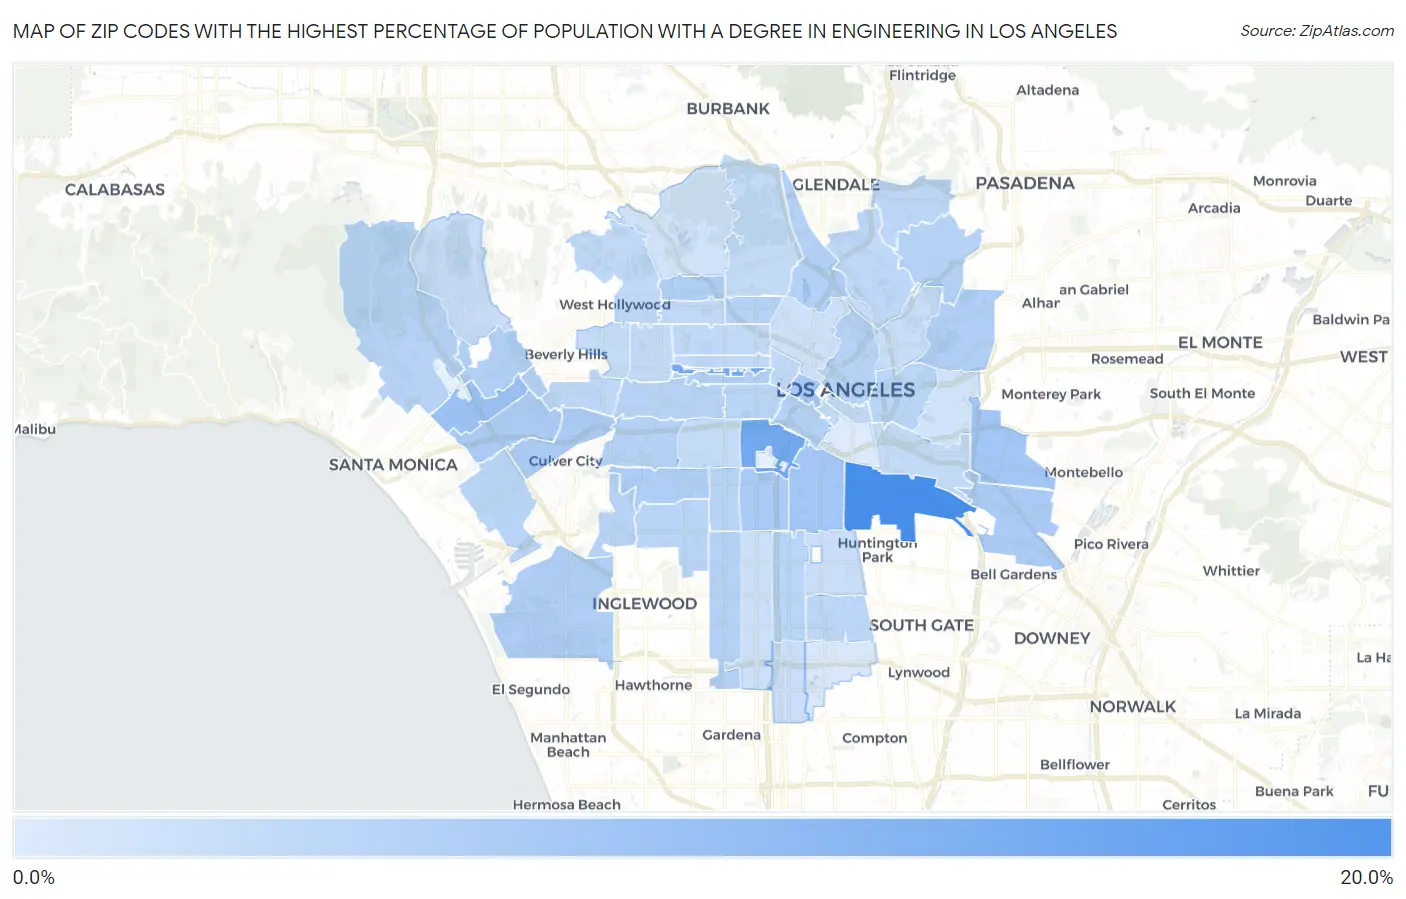
Map of Zip Codes with the Highest Percentage of Population with a Degree in Engineering in Los Angeles
0.92%
19.5%
Zip Codes with the Highest Percentage of Population with a Degree in Engineering in Los Angeles, CA
| Zip Code | % Graduates | vs State | vs National | |
| 1. | 90058 | 19.5% | 9.9%(+9.62)#114 | 7.6%(+11.9)#960 |
| 2. | 90007 | 13.7% | 9.9%(+3.75)#214 | 7.6%(+6.03)#2,146 |
| 3. | 90010 | 13.5% | 9.9%(+3.61)#220 | 7.6%(+5.88)#2,205 |
| 4. | 90025 | 8.5% | 9.9%(-1.39)#573 | 7.6%(+0.889)#6,222 |
| 5. | 90022 | 7.8% | 9.9%(-2.13)#673 | 7.6%(+0.146)#7,456 |
| 6. | 90011 | 7.6% | 9.9%(-2.29)#705 | 7.6%(-0.016)#7,772 |
| 7. | 90017 | 7.3% | 9.9%(-2.58)#751 | 7.6%(-0.308)#8,321 |
| 8. | 90037 | 7.0% | 9.9%(-2.97)#813 | 7.6%(-0.692)#9,099 |
| 9. | 90040 | 6.8% | 9.9%(-3.14)#831 | 7.6%(-0.863)#9,425 |
| 10. | 90034 | 6.6% | 9.9%(-3.29)#860 | 7.6%(-1.01)#9,756 |
| 11. | 90064 | 6.5% | 9.9%(-3.39)#873 | 7.6%(-1.12)#9,944 |
| 12. | 90028 | 6.4% | 9.9%(-3.49)#885 | 7.6%(-1.22)#10,153 |
| 13. | 90005 | 6.2% | 9.9%(-3.75)#931 | 7.6%(-1.47)#10,767 |
| 14. | 90045 | 6.2% | 9.9%(-3.75)#932 | 7.6%(-1.48)#10,774 |
| 15. | 90008 | 6.1% | 9.9%(-3.82)#942 | 7.6%(-1.55)#10,956 |
| 16. | 90067 | 6.0% | 9.9%(-3.93)#955 | 7.6%(-1.66)#11,212 |
| 17. | 90032 | 5.9% | 9.9%(-4.00)#969 | 7.6%(-1.73)#11,376 |
| 18. | 90024 | 5.8% | 9.9%(-4.15)#990 | 7.6%(-1.88)#11,758 |
| 19. | 90015 | 5.7% | 9.9%(-4.20)#997 | 7.6%(-1.92)#11,874 |
| 20. | 90039 | 5.7% | 9.9%(-4.22)#1,003 | 7.6%(-1.95)#11,952 |
| 21. | 90016 | 5.6% | 9.9%(-4.31)#1,012 | 7.6%(-2.04)#12,172 |
| 22. | 90047 | 5.5% | 9.9%(-4.44)#1,032 | 7.6%(-2.17)#12,502 |
| 23. | 90029 | 5.4% | 9.9%(-4.49)#1,042 | 7.6%(-2.22)#12,593 |
| 24. | 90042 | 5.4% | 9.9%(-4.54)#1,048 | 7.6%(-2.27)#12,731 |
| 25. | 90049 | 5.3% | 9.9%(-4.59)#1,057 | 7.6%(-2.31)#12,849 |
| 26. | 90019 | 5.3% | 9.9%(-4.64)#1,065 | 7.6%(-2.37)#12,995 |
| 27. | 90012 | 5.1% | 9.9%(-4.82)#1,076 | 7.6%(-2.54)#13,420 |
| 28. | 90056 | 5.1% | 9.9%(-4.83)#1,079 | 7.6%(-2.56)#13,458 |
| 29. | 90043 | 5.0% | 9.9%(-4.93)#1,086 | 7.6%(-2.65)#13,688 |
| 30. | 90033 | 5.0% | 9.9%(-4.96)#1,090 | 7.6%(-2.68)#13,785 |
| 31. | 90066 | 4.9% | 9.9%(-4.99)#1,094 | 7.6%(-2.71)#13,879 |
| 32. | 90003 | 4.9% | 9.9%(-5.02)#1,098 | 7.6%(-2.75)#13,971 |
| 33. | 90062 | 4.9% | 9.9%(-5.03)#1,103 | 7.6%(-2.76)#13,997 |
| 34. | 90006 | 4.8% | 9.9%(-5.08)#1,108 | 7.6%(-2.80)#14,139 |
| 35. | 90002 | 4.7% | 9.9%(-5.20)#1,120 | 7.6%(-2.92)#14,437 |
| 36. | 90041 | 4.6% | 9.9%(-5.36)#1,138 | 7.6%(-3.09)#14,900 |
| 37. | 90035 | 4.5% | 9.9%(-5.45)#1,151 | 7.6%(-3.18)#15,138 |
| 38. | 90065 | 4.4% | 9.9%(-5.51)#1,158 | 7.6%(-3.24)#15,304 |
| 39. | 90038 | 4.2% | 9.9%(-5.70)#1,182 | 7.6%(-3.43)#15,750 |
| 40. | 90046 | 4.1% | 9.9%(-5.78)#1,195 | 7.6%(-3.50)#15,960 |
| 41. | 90057 | 4.1% | 9.9%(-5.80)#1,198 | 7.6%(-3.52)#15,999 |
| 42. | 90014 | 4.1% | 9.9%(-5.81)#1,203 | 7.6%(-3.53)#16,037 |
| 43. | 90004 | 4.1% | 9.9%(-5.84)#1,208 | 7.6%(-3.57)#16,113 |
| 44. | 90020 | 4.1% | 9.9%(-5.84)#1,209 | 7.6%(-3.57)#16,133 |
| 45. | 90013 | 4.0% | 9.9%(-5.92)#1,218 | 7.6%(-3.64)#16,329 |
| 46. | 90027 | 4.0% | 9.9%(-5.96)#1,223 | 7.6%(-3.68)#16,449 |
| 47. | 90036 | 3.9% | 9.9%(-6.00)#1,227 | 7.6%(-3.72)#16,558 |
| 48. | 90023 | 3.8% | 9.9%(-6.15)#1,243 | 7.6%(-3.87)#16,959 |
| 49. | 90048 | 3.7% | 9.9%(-6.20)#1,251 | 7.6%(-3.93)#17,092 |
| 50. | 90018 | 3.6% | 9.9%(-6.36)#1,269 | 7.6%(-4.09)#17,517 |
| 51. | 90031 | 3.4% | 9.9%(-6.48)#1,278 | 7.6%(-4.20)#17,787 |
| 52. | 90001 | 3.2% | 9.9%(-6.75)#1,308 | 7.6%(-4.47)#18,447 |
| 53. | 90077 | 3.2% | 9.9%(-6.76)#1,310 | 7.6%(-4.49)#18,491 |
| 54. | 90061 | 3.0% | 9.9%(-6.97)#1,322 | 7.6%(-4.70)#19,015 |
| 55. | 90044 | 2.7% | 9.9%(-7.23)#1,336 | 7.6%(-4.95)#19,531 |
| 56. | 90026 | 2.6% | 9.9%(-7.30)#1,344 | 7.6%(-5.02)#19,698 |
| 57. | 90063 | 2.3% | 9.9%(-7.62)#1,369 | 7.6%(-5.35)#20,385 |
| 58. | 90068 | 2.3% | 9.9%(-7.67)#1,371 | 7.6%(-5.40)#20,480 |
| 59. | 90059 | 1.2% | 9.9%(-8.73)#1,420 | 7.6%(-6.45)#22,329 |
| 60. | 90021 | 0.92% | 9.9%(-9.00)#1,429 | 7.6%(-6.72)#22,735 |
1
Common Questions
What are the Top 10 Zip Codes with the Highest Percentage of Population with a Degree in Engineering in Los Angeles, CA?
Top 10 Zip Codes with the Highest Percentage of Population with a Degree in Engineering in Los Angeles, CA are:
What zip code has the Highest Percentage of Population with a Degree in Engineering in Los Angeles, CA?
90058 has the Highest Percentage of Population with a Degree in Engineering in Los Angeles, CA with 19.5%.
What is the Percentage of Population with a Degree in Engineering in Los Angeles, CA?
Percentage of Population with a Degree in Engineering in Los Angeles is 6.0%.
What is the Percentage of Population with a Degree in Engineering in California?
Percentage of Population with a Degree in Engineering in California is 9.9%.
What is the Percentage of Population with a Degree in Engineering in the United States?
Percentage of Population with a Degree in Engineering in the United States is 7.6%.