Cities with the Highest Percentage of Population with a Degree in Engineering in Kentucky
RELATED REPORTS & OPTIONS
Engineering
Kentucky
Compare Cities
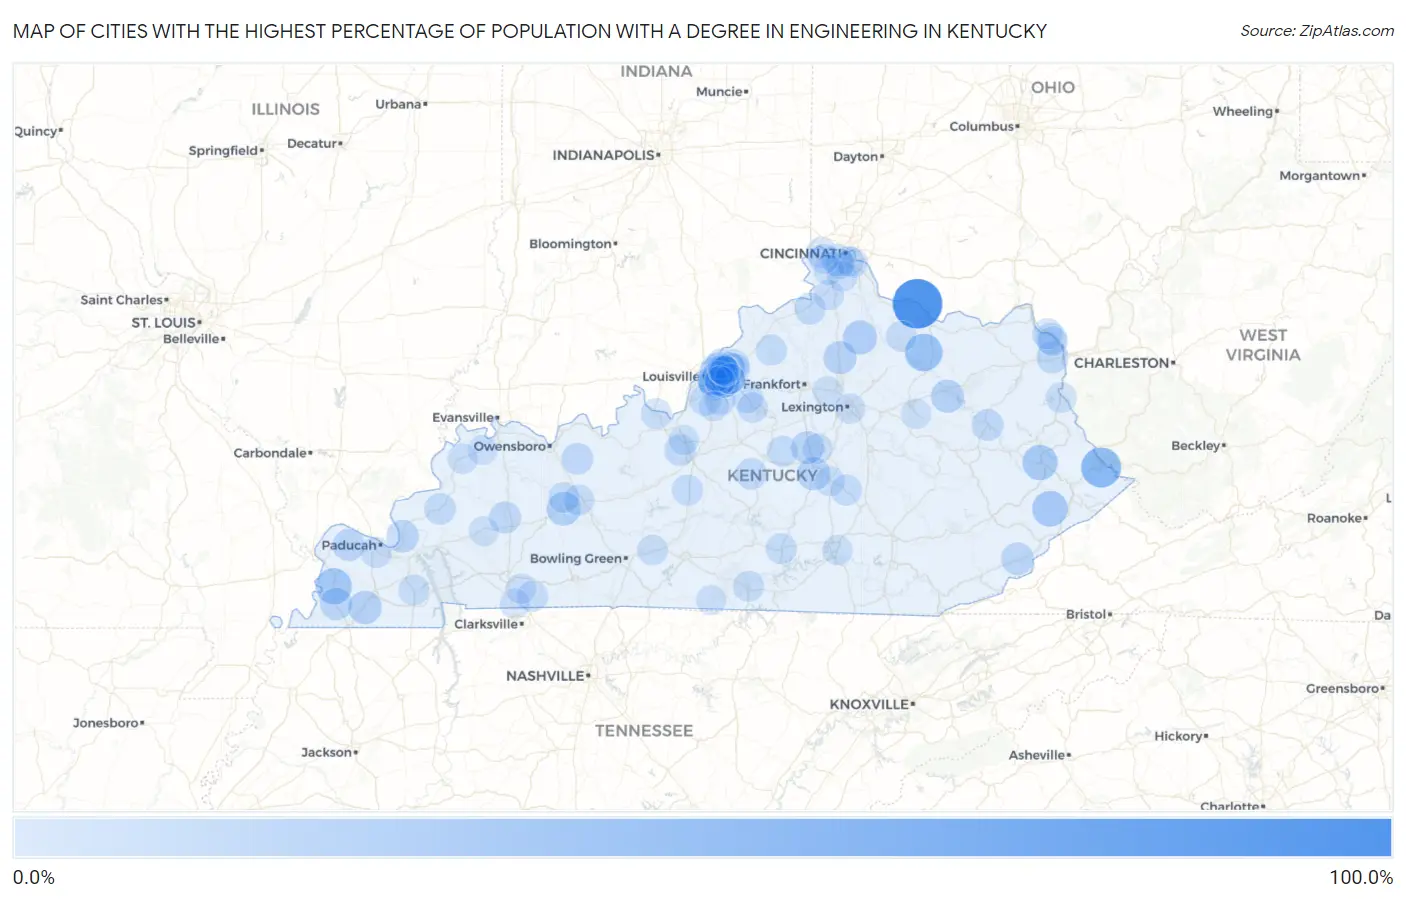
Map of Cities with the Highest Percentage of Population with a Degree in Engineering in Kentucky
0.0%
100.0%
Cities with the Highest Percentage of Population with a Degree in Engineering in Kentucky
| City | % Graduates | vs State | vs National | |
| 1. | Dover | 87.5% | 5.5%(+82.0)#1 | 7.6%(+79.9)#62 |
| 2. | Belfry | 46.5% | 5.5%(+41.0)#2 | 7.6%(+38.9)#203 |
| 3. | Elizaville | 36.7% | 5.5%(+31.1)#3 | 7.6%(+29.0)#311 |
| 4. | Arlington | 30.8% | 5.5%(+25.2)#4 | 7.6%(+23.1)#422 |
| 5. | Wheelwright | 28.8% | 5.5%(+23.3)#5 | 7.6%(+21.2)#480 |
| 6. | Prestonsburg | 26.9% | 5.5%(+21.4)#6 | 7.6%(+19.3)#565 |
| 7. | Berry | 22.2% | 5.5%(+16.7)#7 | 7.6%(+14.6)#839 |
| 8. | Rockport | 21.4% | 5.5%(+15.9)#8 | 7.6%(+13.8)#895 |
| 9. | Wingo | 19.6% | 5.5%(+14.1)#9 | 7.6%(+12.0)#1,102 |
| 10. | Junction City | 18.5% | 5.5%(+13.0)#10 | 7.6%(+10.9)#1,211 |
| 11. | Sadieville | 18.4% | 5.5%(+12.9)#11 | 7.6%(+10.8)#1,222 |
| 12. | Salt Lick | 18.4% | 5.5%(+12.8)#12 | 7.6%(+10.7)#1,231 |
| 13. | Harrodsburg | 17.1% | 5.5%(+11.6)#13 | 7.6%(+9.49)#1,421 |
| 14. | Hurstbourne Acres | 17.1% | 5.5%(+11.5)#14 | 7.6%(+9.42)#1,434 |
| 15. | Cumberland | 16.7% | 5.5%(+11.1)#15 | 7.6%(+9.02)#1,496 |
| 16. | Smithland | 16.7% | 5.5%(+11.1)#16 | 7.6%(+9.02)#1,522 |
| 17. | Clinton | 15.9% | 5.5%(+10.3)#17 | 7.6%(+8.21)#1,686 |
| 18. | Kevil | 15.2% | 5.5%(+9.71)#18 | 7.6%(+7.59)#1,822 |
| 19. | Earlington | 13.6% | 5.5%(+8.11)#19 | 7.6%(+5.99)#2,256 |
| 20. | Cannonsburg | 13.6% | 5.5%(+8.03)#20 | 7.6%(+5.91)#2,285 |
| 21. | West Liberty | 13.4% | 5.5%(+7.85)#21 | 7.6%(+5.73)#2,346 |
| 22. | Riverwood | 13.2% | 5.5%(+7.66)#22 | 7.6%(+5.54)#2,417 |
| 23. | Hurstbourne | 13.2% | 5.5%(+7.64)#23 | 7.6%(+5.52)#2,421 |
| 24. | Whitesville | 12.8% | 5.5%(+7.26)#24 | 7.6%(+5.14)#2,568 |
| 25. | Marion | 12.7% | 5.5%(+7.18)#25 | 7.6%(+5.06)#2,597 |
| 26. | Glencoe | 12.5% | 5.5%(+6.97)#26 | 7.6%(+4.85)#2,681 |
| 27. | Russell | 12.3% | 5.5%(+6.75)#27 | 7.6%(+4.63)#2,785 |
| 28. | Hollyvilla | 12.2% | 5.5%(+6.72)#28 | 7.6%(+4.60)#2,796 |
| 29. | Crescent Springs | 12.1% | 5.5%(+6.54)#29 | 7.6%(+4.42)#2,862 |
| 30. | St Mary | 12.0% | 5.5%(+6.47)#30 | 7.6%(+4.35)#2,892 |
| 31. | Rineyville | 11.7% | 5.5%(+6.16)#31 | 7.6%(+4.04)#3,041 |
| 32. | Worthington Hills | 11.6% | 5.5%(+6.11)#32 | 7.6%(+3.99)#3,059 |
| 33. | Crestwood | 11.3% | 5.5%(+5.75)#33 | 7.6%(+3.63)#3,236 |
| 34. | Houston Acres | 10.8% | 5.5%(+5.29)#34 | 7.6%(+3.17)#3,509 |
| 35. | West Buechel | 10.7% | 5.5%(+5.16)#35 | 7.6%(+3.04)#3,594 |
| 36. | Crab Orchard | 10.5% | 5.5%(+5.00)#36 | 7.6%(+2.88)#3,693 |
| 37. | Upton | 10.5% | 5.5%(+5.00)#37 | 7.6%(+2.88)#3,698 |
| 38. | New Castle | 10.4% | 5.5%(+4.89)#38 | 7.6%(+2.77)#3,776 |
| 39. | Mackville | 10.3% | 5.5%(+4.82)#39 | 7.6%(+2.70)#3,835 |
| 40. | Elk Creek | 10.2% | 5.5%(+4.71)#40 | 7.6%(+2.59)#3,912 |
| 41. | Broeck Pointe | 10.2% | 5.5%(+4.71)#41 | 7.6%(+2.59)#3,914 |
| 42. | Russell Springs | 10.1% | 5.5%(+4.57)#42 | 7.6%(+2.45)#4,011 |
| 43. | Centertown | 10.0% | 5.5%(+4.47)#43 | 7.6%(+2.35)#4,080 |
| 44. | Trenton | 10.0% | 5.5%(+4.47)#44 | 7.6%(+2.35)#4,085 |
| 45. | Heritage Creek | 10.0% | 5.5%(+4.42)#45 | 7.6%(+2.30)#4,127 |
| 46. | Beaver Dam | 9.9% | 5.5%(+4.34)#46 | 7.6%(+2.21)#4,198 |
| 47. | Green Spring | 9.9% | 5.5%(+4.33)#47 | 7.6%(+2.21)#4,204 |
| 48. | Burkesville | 9.7% | 5.5%(+4.20)#48 | 7.6%(+2.07)#4,301 |
| 49. | Douglass Hills | 9.6% | 5.5%(+4.12)#49 | 7.6%(+2.00)#4,352 |
| 50. | Hardin | 9.5% | 5.5%(+4.00)#50 | 7.6%(+1.88)#4,447 |
| 51. | Hendron | 9.5% | 5.5%(+3.97)#51 | 7.6%(+1.85)#4,480 |
| 52. | Middletown | 9.3% | 5.5%(+3.81)#52 | 7.6%(+1.69)#4,603 |
| 53. | Brandenburg | 9.3% | 5.5%(+3.78)#53 | 7.6%(+1.65)#4,631 |
| 54. | Pewee Valley | 9.2% | 5.5%(+3.72)#54 | 7.6%(+1.60)#4,680 |
| 55. | Smiths Grove | 9.1% | 5.5%(+3.56)#55 | 7.6%(+1.44)#4,801 |
| 56. | Mount Olivet | 9.1% | 5.5%(+3.56)#56 | 7.6%(+1.44)#4,820 |
| 57. | Taylorsville | 8.9% | 5.5%(+3.42)#57 | 7.6%(+1.30)#4,988 |
| 58. | Forest Hills | 8.9% | 5.5%(+3.42)#58 | 7.6%(+1.30)#4,989 |
| 59. | Worthington | 8.8% | 5.5%(+3.32)#59 | 7.6%(+1.20)#5,074 |
| 60. | Louisa | 8.8% | 5.5%(+3.29)#60 | 7.6%(+1.17)#5,107 |
| 61. | Glenview | 8.3% | 5.5%(+2.79)#61 | 7.6%(+0.666)#5,603 |
| 62. | Highland Heights | 8.3% | 5.5%(+2.76)#62 | 7.6%(+0.639)#5,632 |
| 63. | Francisville | 8.3% | 5.5%(+2.74)#63 | 7.6%(+0.622)#5,644 |
| 64. | Independence | 8.1% | 5.5%(+2.56)#64 | 7.6%(+0.442)#5,853 |
| 65. | Old Brownsboro Place | 8.1% | 5.5%(+2.52)#65 | 7.6%(+0.403)#5,903 |
| 66. | Strathmoor Village | 7.9% | 5.5%(+2.39)#66 | 7.6%(+0.273)#6,067 |
| 67. | Verona | 7.8% | 5.5%(+2.30)#67 | 7.6%(+0.179)#6,182 |
| 68. | Coldstream | 7.8% | 5.5%(+2.26)#68 | 7.6%(+0.141)#6,221 |
| 69. | Lexington | 7.8% | 5.5%(+2.23)#69 | 7.6%(+0.109)#6,266 |
| 70. | Oak Grove | 7.7% | 5.5%(+2.17)#70 | 7.6%(+0.045)#6,332 |
| 71. | St Regis Park | 7.7% | 5.5%(+2.17)#71 | 7.6%(+0.045)#6,338 |
| 72. | Seneca Gardens | 7.6% | 5.5%(+2.06)#72 | 7.6%(-0.056)#6,487 |
| 73. | Wilder | 7.6% | 5.5%(+2.06)#73 | 7.6%(-0.062)#6,496 |
| 74. | Jeffersontown | 7.6% | 5.5%(+2.03)#74 | 7.6%(-0.091)#6,528 |
| 75. | Wildwood | 7.5% | 5.5%(+2.02)#75 | 7.6%(-0.100)#6,542 |
| 76. | Morganfield | 7.5% | 5.5%(+1.95)#76 | 7.6%(-0.173)#6,629 |
| 77. | Murray Hill | 7.5% | 5.5%(+1.93)#77 | 7.6%(-0.191)#6,649 |
| 78. | Radcliff | 7.4% | 5.5%(+1.90)#78 | 7.6%(-0.218)#6,675 |
| 79. | Ferguson | 7.3% | 5.5%(+1.79)#79 | 7.6%(-0.330)#6,830 |
| 80. | Bellefonte | 7.3% | 5.5%(+1.77)#80 | 7.6%(-0.348)#6,861 |
| 81. | Prospect | 7.3% | 5.5%(+1.74)#81 | 7.6%(-0.380)#6,899 |
| 82. | Wellington | 7.3% | 5.5%(+1.73)#82 | 7.6%(-0.389)#6,913 |
| 83. | Crestview Hills | 7.2% | 5.5%(+1.72)#83 | 7.6%(-0.400)#6,921 |
| 84. | Richlawn | 7.2% | 5.5%(+1.72)#84 | 7.6%(-0.401)#6,929 |
| 85. | Midway | 7.2% | 5.5%(+1.70)#85 | 7.6%(-0.416)#6,944 |
| 86. | Camargo | 7.1% | 5.5%(+1.62)#86 | 7.6%(-0.505)#7,063 |
| 87. | Brownsboro Farm | 7.1% | 5.5%(+1.54)#87 | 7.6%(-0.577)#7,184 |
| 88. | Hebron Estates | 7.1% | 5.5%(+1.52)#88 | 7.6%(-0.596)#7,203 |
| 89. | Pembroke | 7.0% | 5.5%(+1.50)#89 | 7.6%(-0.620)#7,230 |
| 90. | Burgin | 7.0% | 5.5%(+1.45)#90 | 7.6%(-0.671)#7,301 |
| 91. | Florence | 7.0% | 5.5%(+1.44)#91 | 7.6%(-0.685)#7,324 |
| 92. | Woodland Hills | 6.8% | 5.5%(+1.32)#92 | 7.6%(-0.803)#7,488 |
| 93. | Creekside | 6.8% | 5.5%(+1.25)#93 | 7.6%(-0.868)#7,586 |
| 94. | Cambridge | 6.8% | 5.5%(+1.25)#94 | 7.6%(-0.868)#7,588 |
| 95. | Hebron | 6.7% | 5.5%(+1.20)#95 | 7.6%(-0.925)#7,657 |
| 96. | Stanford | 6.7% | 5.5%(+1.14)#96 | 7.6%(-0.981)#7,720 |
| 97. | Dawson Springs | 6.7% | 5.5%(+1.14)#97 | 7.6%(-0.981)#7,724 |
| 98. | Corydon | 6.7% | 5.5%(+1.14)#98 | 7.6%(-0.981)#7,735 |
| 99. | Ten Broeck | 6.7% | 5.5%(+1.14)#99 | 7.6%(-0.981)#7,760 |
| 100. | Tompkinsville | 6.6% | 5.5%(+1.11)#100 | 7.6%(-1.01)#7,791 |
Common Questions
What are the Top 10 Cities with the Highest Percentage of Population with a Degree in Engineering in Kentucky?
Top 10 Cities with the Highest Percentage of Population with a Degree in Engineering in Kentucky are:
#1
87.5%
#2
46.5%
#3
36.7%
#4
30.8%
#5
28.8%
#6
26.9%
#7
22.2%
#8
21.4%
#9
19.6%
#10
18.5%
What city has the Highest Percentage of Population with a Degree in Engineering in Kentucky?
Dover has the Highest Percentage of Population with a Degree in Engineering in Kentucky with 87.5%.
What is the Percentage of Population with a Degree in Engineering in the State of Kentucky?
Percentage of Population with a Degree in Engineering in Kentucky is 5.5%.
What is the Percentage of Population with a Degree in Engineering in the United States?
Percentage of Population with a Degree in Engineering in the United States is 7.6%.