Green Acres, CA Map & Demographics
Green Acres Map
Green Acres Overview
$21,040
PER CAPITA INCOME
$89,091
AVG FAMILY INCOME
$68,972
AVG HOUSEHOLD INCOME
0.35
INEQUALITY / GINI INDEX
3,023
TOTAL POPULATION
1,186
MALE POPULATION
1,837
FEMALE POPULATION
64.56
MALES / 100 FEMALES
154.89
FEMALES / 100 MALES
31.5
MEDIAN AGE
5.6
AVG FAMILY SIZE
3.8
AVG HOUSEHOLD SIZE
1,436
LABOR FORCE [ PEOPLE ]
66.1%
PERCENT IN LABOR FORCE
15.1%
UNEMPLOYMENT RATE
Income in Green Acres
Income Overview in Green Acres
Per Capita Income in Green Acres is $21,040, while median incomes of families and households are $89,091 and $68,972 respectively.
| Characteristic | Number | Measure |
| Per Capita Income | 3,023 | $21,040 |
| Median Family Income | 450 | $89,091 |
| Mean Family Income | 450 | $91,903 |
| Median Household Income | 803 | $68,972 |
| Mean Household Income | 803 | $76,511 |
| Income Deficit | 450 | $0 |
| Wage / Income Gap (%) | 3,023 | 0.00% |
| Wage / Income Gap ($) | 3,023 | 100.00¢ per $1 |
| Gini / Inequality Index | 3,023 | 0.35 |
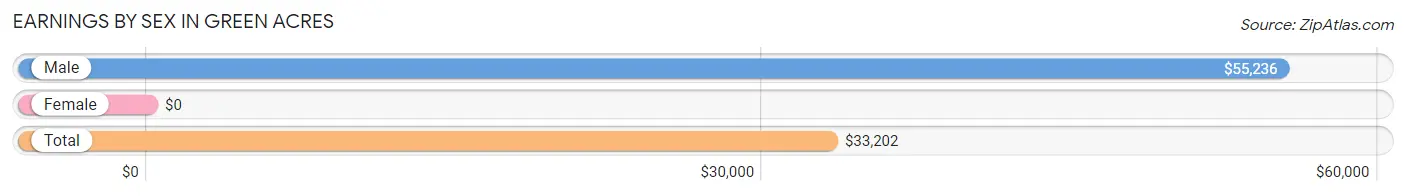
Earnings by Sex in Green Acres
| Sex | Number | Average Earnings |
| Male | 611 (42.4%) | $55,236 |
| Female | 831 (57.6%) | $0 |
| Total | 1,442 (100.0%) | $33,202 |
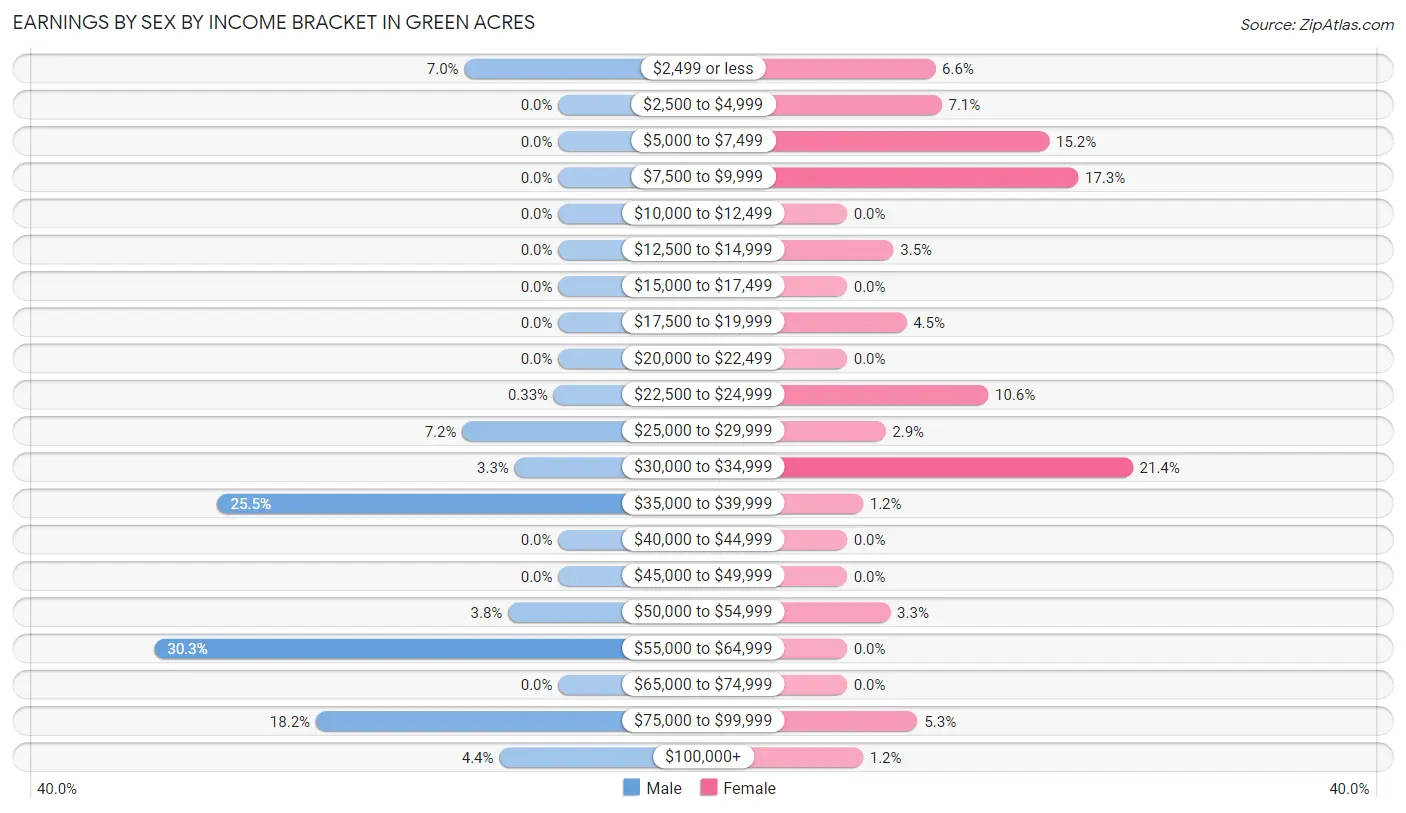
Earnings by Sex by Income Bracket in Green Acres
The most common earnings brackets in Green Acres are $55,000 to $64,999 for men (185 | 30.3%) and $30,000 to $34,999 for women (178 | 21.4%).
| Income | Male | Female |
| $2,499 or less | 43 (7.0%) | 55 (6.6%) |
| $2,500 to $4,999 | 0 (0.0%) | 59 (7.1%) |
| $5,000 to $7,499 | 0 (0.0%) | 126 (15.2%) |
| $7,500 to $9,999 | 0 (0.0%) | 144 (17.3%) |
| $10,000 to $12,499 | 0 (0.0%) | 0 (0.0%) |
| $12,500 to $14,999 | 0 (0.0%) | 29 (3.5%) |
| $15,000 to $17,499 | 0 (0.0%) | 0 (0.0%) |
| $17,500 to $19,999 | 0 (0.0%) | 37 (4.4%) |
| $20,000 to $22,499 | 0 (0.0%) | 0 (0.0%) |
| $22,500 to $24,999 | 2 (0.3%) | 88 (10.6%) |
| $25,000 to $29,999 | 44 (7.2%) | 24 (2.9%) |
| $30,000 to $34,999 | 20 (3.3%) | 178 (21.4%) |
| $35,000 to $39,999 | 156 (25.5%) | 10 (1.2%) |
| $40,000 to $44,999 | 0 (0.0%) | 0 (0.0%) |
| $45,000 to $49,999 | 0 (0.0%) | 0 (0.0%) |
| $50,000 to $54,999 | 23 (3.8%) | 27 (3.3%) |
| $55,000 to $64,999 | 185 (30.3%) | 0 (0.0%) |
| $65,000 to $74,999 | 0 (0.0%) | 0 (0.0%) |
| $75,000 to $99,999 | 111 (18.2%) | 44 (5.3%) |
| $100,000+ | 27 (4.4%) | 10 (1.2%) |
| Total | 611 (100.0%) | 831 (100.0%) |
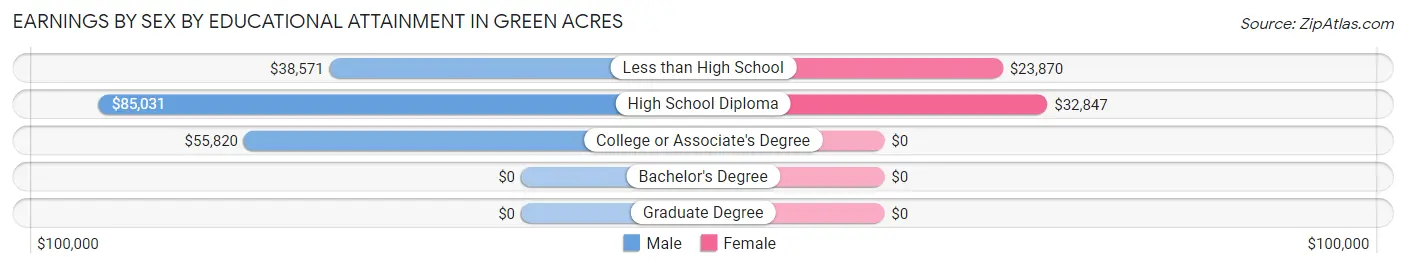
Earnings by Sex by Educational Attainment in Green Acres
Average earnings in Green Acres are $55,581 for men and $23,722 for women, a difference of 57.3%. Men with an educational attainment of high school diploma enjoy the highest average annual earnings of $85,031, while those with less than high school education earn the least with $38,571. Women with an educational attainment of high school diploma earn the most with the average annual earnings of $32,847, while those with less than high school education have the smallest earnings of $23,870.
| Educational Attainment | Male Income | Female Income |
| Less than High School | $38,571 | $23,870 |
| High School Diploma | $85,031 | $32,847 |
| College or Associate's Degree | $55,820 | $0 |
| Bachelor's Degree | - | - |
| Graduate Degree | - | - |
| Total | $55,581 | $23,722 |
Family Income in Green Acres
Family Income Brackets in Green Acres
According to the Green Acres family income data, there are 192 families falling into the $100,000 to $149,999 income range, which is the most common income bracket and makes up 42.7% of all families.
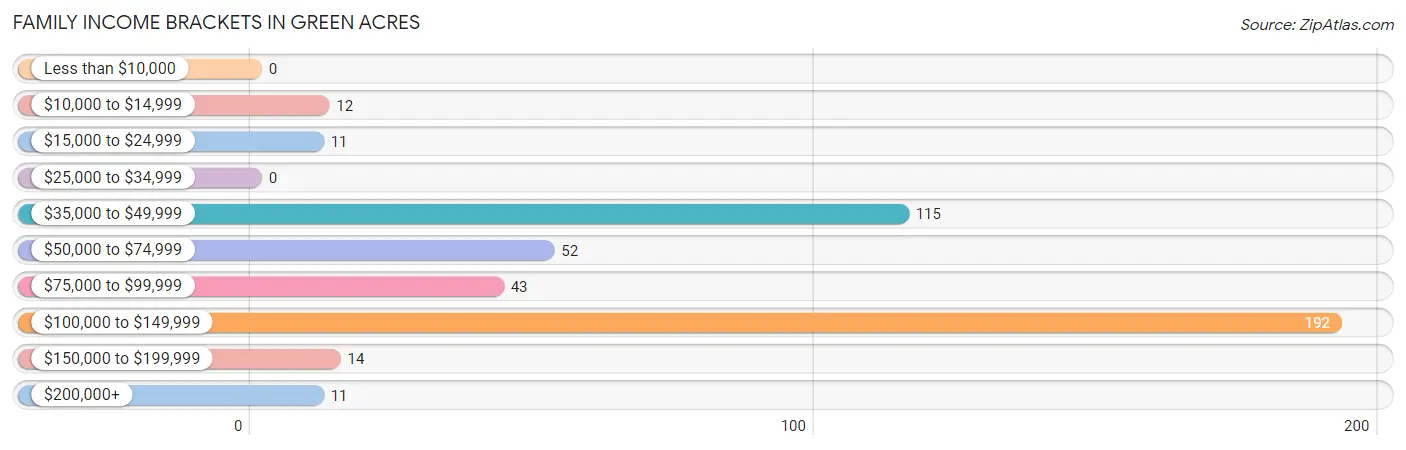
| Income Bracket | # Families | % Families |
| Less than $10,000 | 0 | 0.0% |
| $10,000 to $14,999 | 12 | 2.7% |
| $15,000 to $24,999 | 11 | 2.4% |
| $25,000 to $34,999 | 0 | 0.0% |
| $35,000 to $49,999 | 115 | 25.6% |
| $50,000 to $74,999 | 52 | 11.6% |
| $75,000 to $99,999 | 43 | 9.6% |
| $100,000 to $149,999 | 192 | 42.7% |
| $150,000 to $199,999 | 14 | 3.1% |
| $200,000+ | 11 | 2.4% |
Family Income by Famaliy Size in Green Acres
7+ person families (165 | 36.7%) account for the highest median family income in Green Acres with $123,363 per family, while 2-person families (55 | 12.2%) have the highest median income of $44,062 per family member.
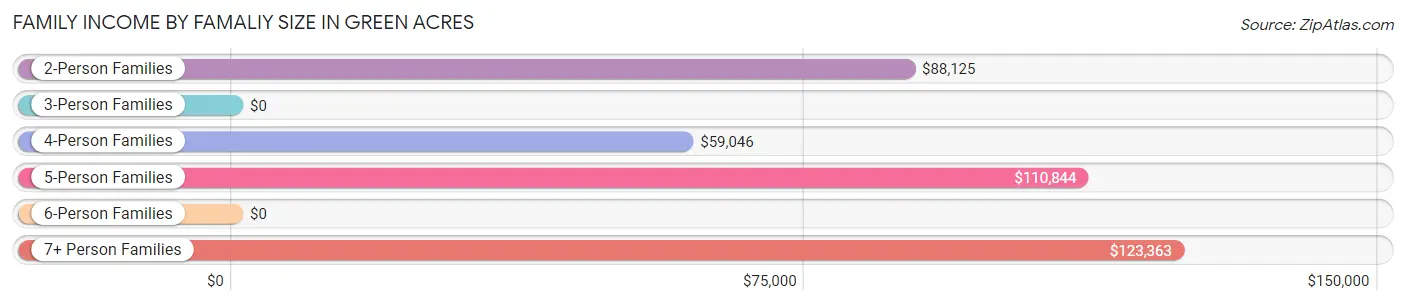
| Income Bracket | # Families | Median Income |
| 2-Person Families | 55 (12.2%) | $88,125 |
| 3-Person Families | 50 (11.1%) | $0 |
| 4-Person Families | 89 (19.8%) | $59,046 |
| 5-Person Families | 91 (20.2%) | $110,844 |
| 6-Person Families | 0 (0.0%) | $0 |
| 7+ Person Families | 165 (36.7%) | $123,363 |
| Total | 450 (100.0%) | $89,091 |
Family Income by Number of Earners in Green Acres
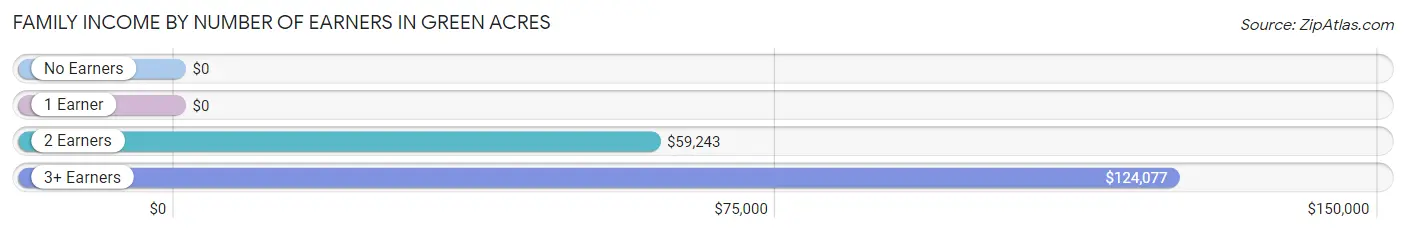
| Number of Earners | # Families | Median Income |
| No Earners | 22 (4.9%) | $0 |
| 1 Earner | 112 (24.9%) | $0 |
| 2 Earners | 157 (34.9%) | $59,243 |
| 3+ Earners | 159 (35.3%) | $124,077 |
| Total | 450 (100.0%) | $89,091 |
Household Income in Green Acres
Household Income Brackets in Green Acres
With 210 households falling in the category, the $50,000 to $74,999 income range is the most frequent in Green Acres, accounting for 26.2% of all households.
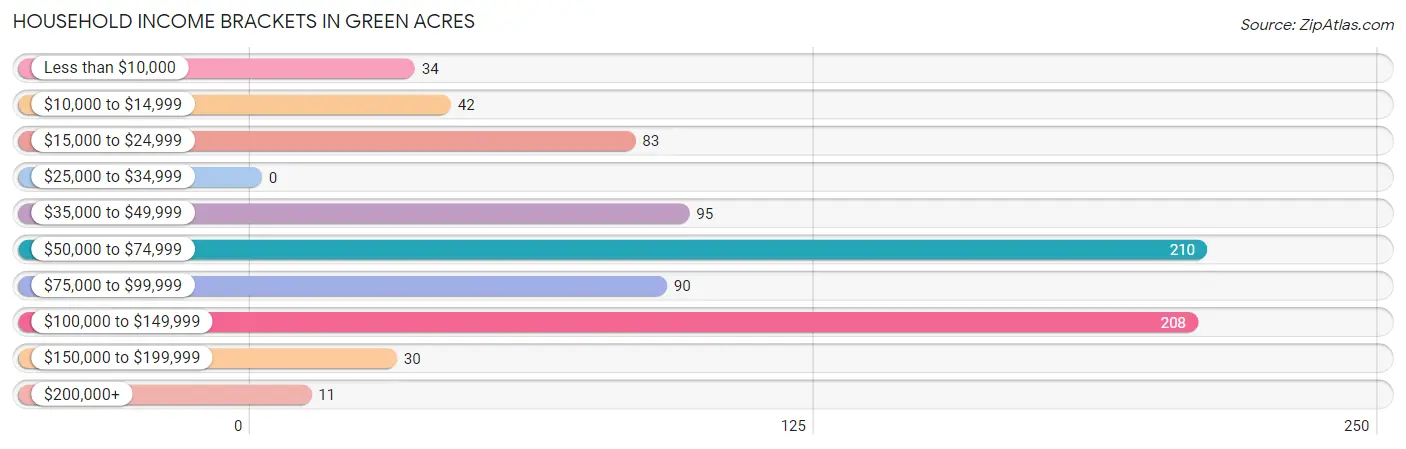
| Income Bracket | # Households | % Households |
| Less than $10,000 | 34 | 4.2% |
| $10,000 to $14,999 | 42 | 5.2% |
| $15,000 to $24,999 | 83 | 10.3% |
| $25,000 to $34,999 | 0 | 0.0% |
| $35,000 to $49,999 | 95 | 11.8% |
| $50,000 to $74,999 | 210 | 26.2% |
| $75,000 to $99,999 | 90 | 11.2% |
| $100,000 to $149,999 | 208 | 25.9% |
| $150,000 to $199,999 | 30 | 3.7% |
| $200,000+ | 11 | 1.4% |
Household Income by Householder Age in Green Acres
The median household income in Green Acres is $68,972, with the highest median household income of $122,679 found in the 25 to 44 years age bracket for the primary householder. A total of 300 households (37.4%) fall into this category.
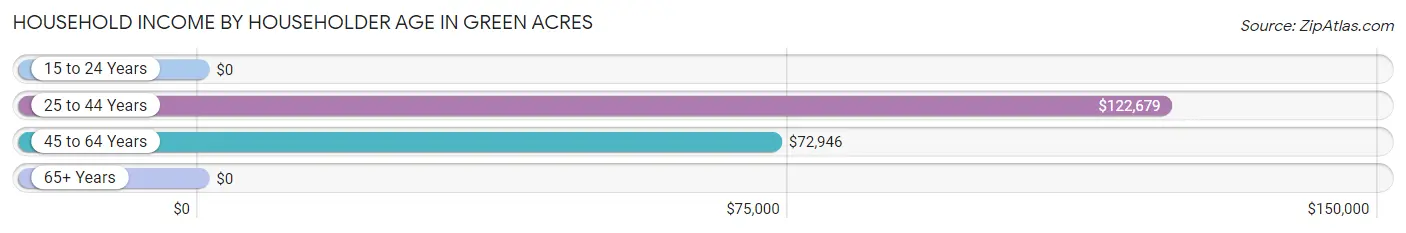
| Income Bracket | # Households | Median Income |
| 15 to 24 Years | 0 (0.0%) | $0 |
| 25 to 44 Years | 300 (37.4%) | $122,679 |
| 45 to 64 Years | 255 (31.8%) | $72,946 |
| 65+ Years | 248 (30.9%) | $0 |
| Total | 803 (100.0%) | $68,972 |
Poverty in Green Acres
Income Below Poverty by Sex and Age in Green Acres
With 10.6% poverty level for males and 9.6% for females among the residents of Green Acres, 15 year old males and 75 year old and over females are the most vulnerable to poverty, with 27 males (100.0%) and 28 females (59.6%) in their respective age groups living below the poverty level.
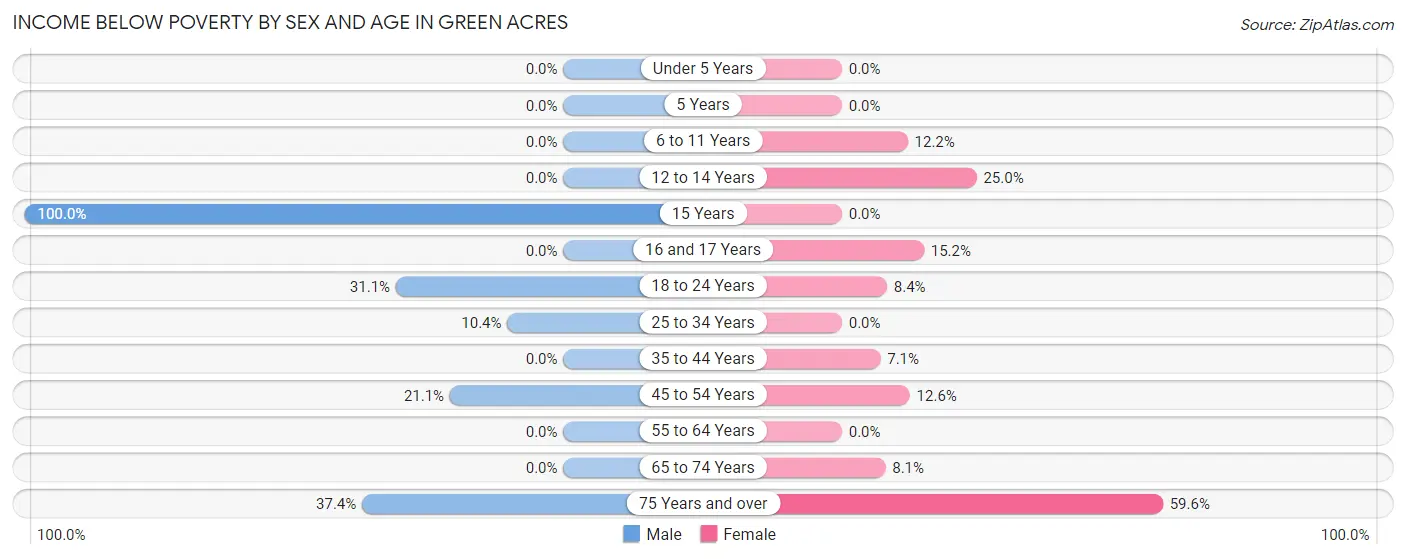
| Age Bracket | Male | Female |
| Under 5 Years | 0 (0.0%) | 0 (0.0%) |
| 5 Years | 0 (0.0%) | 0 (0.0%) |
| 6 to 11 Years | 0 (0.0%) | 21 (12.2%) |
| 12 to 14 Years | 0 (0.0%) | 33 (25.0%) |
| 15 Years | 27 (100.0%) | 0 (0.0%) |
| 16 and 17 Years | 0 (0.0%) | 14 (15.2%) |
| 18 to 24 Years | 23 (31.1%) | 22 (8.4%) |
| 25 to 34 Years | 24 (10.4%) | 0 (0.0%) |
| 35 to 44 Years | 0 (0.0%) | 11 (7.1%) |
| 45 to 54 Years | 20 (21.0%) | 33 (12.6%) |
| 55 to 64 Years | 0 (0.0%) | 0 (0.0%) |
| 65 to 74 Years | 0 (0.0%) | 13 (8.1%) |
| 75 Years and over | 31 (37.3%) | 28 (59.6%) |
| Total | 125 (10.6%) | 175 (9.6%) |
Income Above Poverty by Sex and Age in Green Acres
According to the poverty statistics in Green Acres, males aged under 5 years and females aged under 5 years are the age groups that are most secure financially, with 100.0% of males and 100.0% of females in these age groups living above the poverty line.
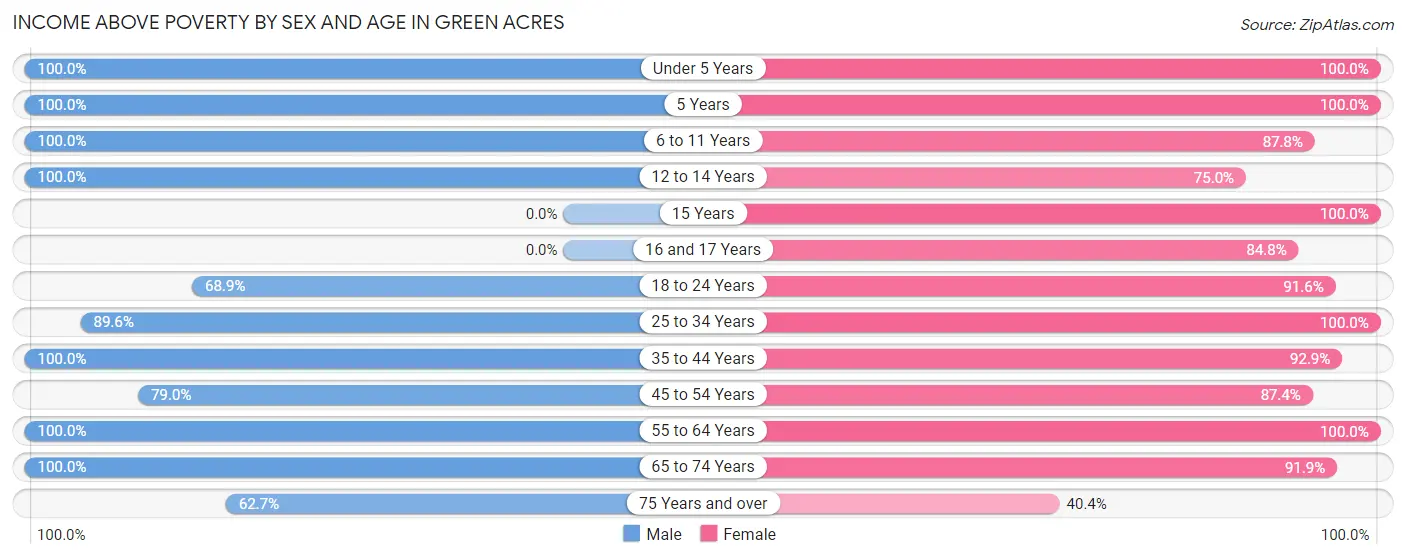
| Age Bracket | Male | Female |
| Under 5 Years | 313 (100.0%) | 77 (100.0%) |
| 5 Years | 38 (100.0%) | 46 (100.0%) |
| 6 to 11 Years | 13 (100.0%) | 151 (87.8%) |
| 12 to 14 Years | 19 (100.0%) | 99 (75.0%) |
| 15 Years | 0 (0.0%) | 12 (100.0%) |
| 16 and 17 Years | 0 (0.0%) | 78 (84.8%) |
| 18 to 24 Years | 51 (68.9%) | 241 (91.6%) |
| 25 to 34 Years | 207 (89.6%) | 222 (100.0%) |
| 35 to 44 Years | 55 (100.0%) | 143 (92.9%) |
| 45 to 54 Years | 75 (78.9%) | 229 (87.4%) |
| 55 to 64 Years | 234 (100.0%) | 193 (100.0%) |
| 65 to 74 Years | 2 (100.0%) | 148 (91.9%) |
| 75 Years and over | 52 (62.6%) | 19 (40.4%) |
| Total | 1,059 (89.4%) | 1,658 (90.4%) |
Income Below Poverty Among Married-Couple Families in Green Acres
The poverty statistics for married-couple families in Green Acres show that 3.9% or 12 of the total 307 families live below the poverty line. Families with no children have the highest poverty rate of 19.4%, comprising of 12 families. On the other hand, families with 1 or 2 children have the lowest poverty rate of 0.0%, which includes 0 families.
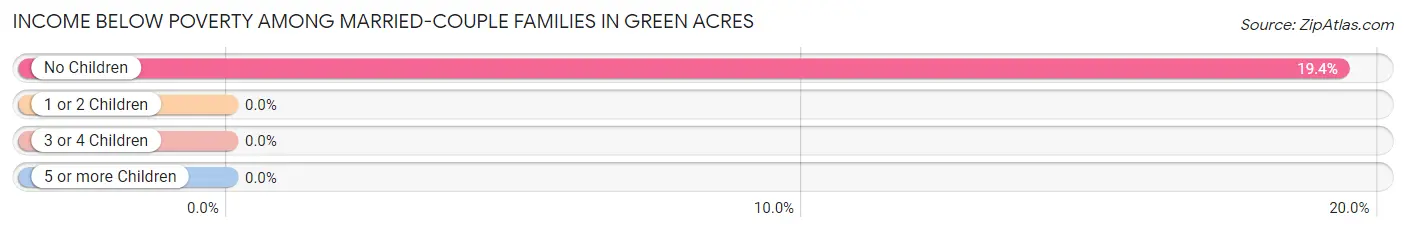
| Children | Above Poverty | Below Poverty |
| No Children | 50 (80.6%) | 12 (19.4%) |
| 1 or 2 Children | 65 (100.0%) | 0 (0.0%) |
| 3 or 4 Children | 180 (100.0%) | 0 (0.0%) |
| 5 or more Children | 0 (0.0%) | 0 (0.0%) |
| Total | 295 (96.1%) | 12 (3.9%) |
Income Below Poverty Among Single-Parent Households in Green Acres
According to the poverty data in Green Acres, 80.0% or 20 single-father households and 9.3% or 11 single-mother households are living below the poverty line. Among single-father households, those with 3 or 4 children have the highest poverty rate, with 20 households (100.0%) experiencing poverty. Likewise, among single-mother households, those with 3 or 4 children have the highest poverty rate, with 11 households (100.0%) falling below the poverty line.
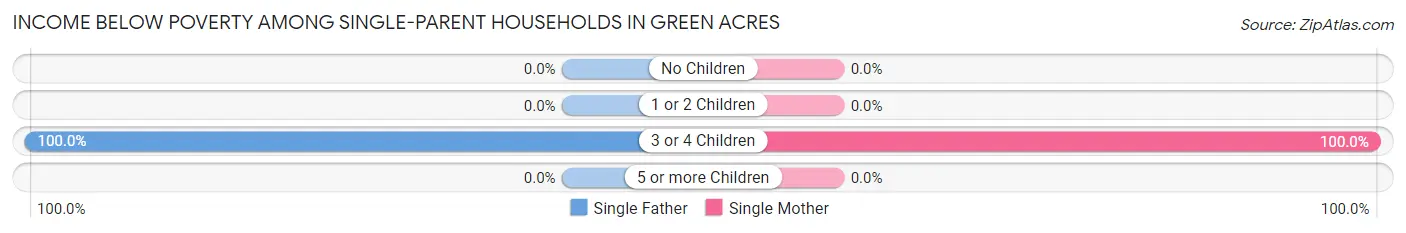
| Children | Single Father | Single Mother |
| No Children | 0 (0.0%) | 0 (0.0%) |
| 1 or 2 Children | 0 (0.0%) | 0 (0.0%) |
| 3 or 4 Children | 20 (100.0%) | 11 (100.0%) |
| 5 or more Children | 0 (0.0%) | 0 (0.0%) |
| Total | 20 (80.0%) | 11 (9.3%) |
Income Below Poverty Among Married-Couple vs Single-Parent Households in Green Acres
The poverty data for Green Acres shows that 12 of the married-couple family households (3.9%) and 31 of the single-parent households (21.7%) are living below the poverty level. Within the married-couple family households, those with no children have the highest poverty rate, with 12 households (19.4%) falling below the poverty line. Among the single-parent households, those with 3 or 4 children have the highest poverty rate, with 31 household (100.0%) living below poverty.
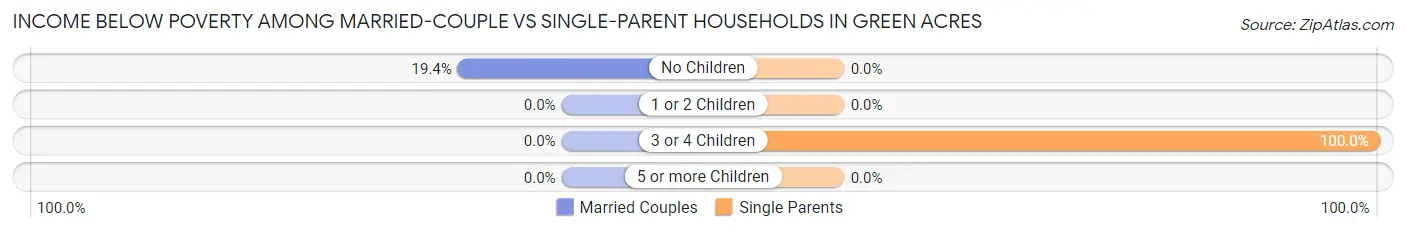
| Children | Married-Couple Families | Single-Parent Households |
| No Children | 12 (19.4%) | 0 (0.0%) |
| 1 or 2 Children | 0 (0.0%) | 0 (0.0%) |
| 3 or 4 Children | 0 (0.0%) | 31 (100.0%) |
| 5 or more Children | 0 (0.0%) | 0 (0.0%) |
| Total | 12 (3.9%) | 31 (21.7%) |
Race in Green Acres
The most populous races in Green Acres are Hispanic or Latino (2,316 | 76.6%), Some other Race (1,728 | 57.2%), and White / Caucasian (1,052 | 34.8%).
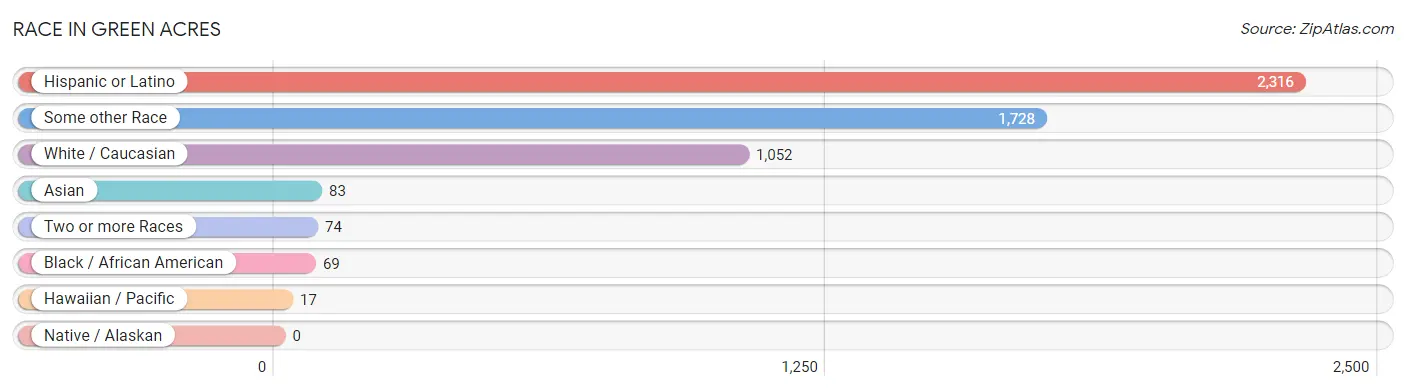
| Race | # Population | % Population |
| Asian | 83 | 2.8% |
| Black / African American | 69 | 2.3% |
| Hawaiian / Pacific | 17 | 0.6% |
| Hispanic or Latino | 2,316 | 76.6% |
| Native / Alaskan | 0 | 0.0% |
| White / Caucasian | 1,052 | 34.8% |
| Two or more Races | 74 | 2.5% |
| Some other Race | 1,728 | 57.2% |
| Total | 3,023 | 100.0% |
Ancestry in Green Acres
The most populous ancestries reported in Green Acres are Mexican (2,284 | 75.5%), German (99 | 3.3%), Korean (82 | 2.7%), Irish (55 | 1.8%), and Welsh (44 | 1.5%), together accounting for 84.8% of all Green Acres residents.
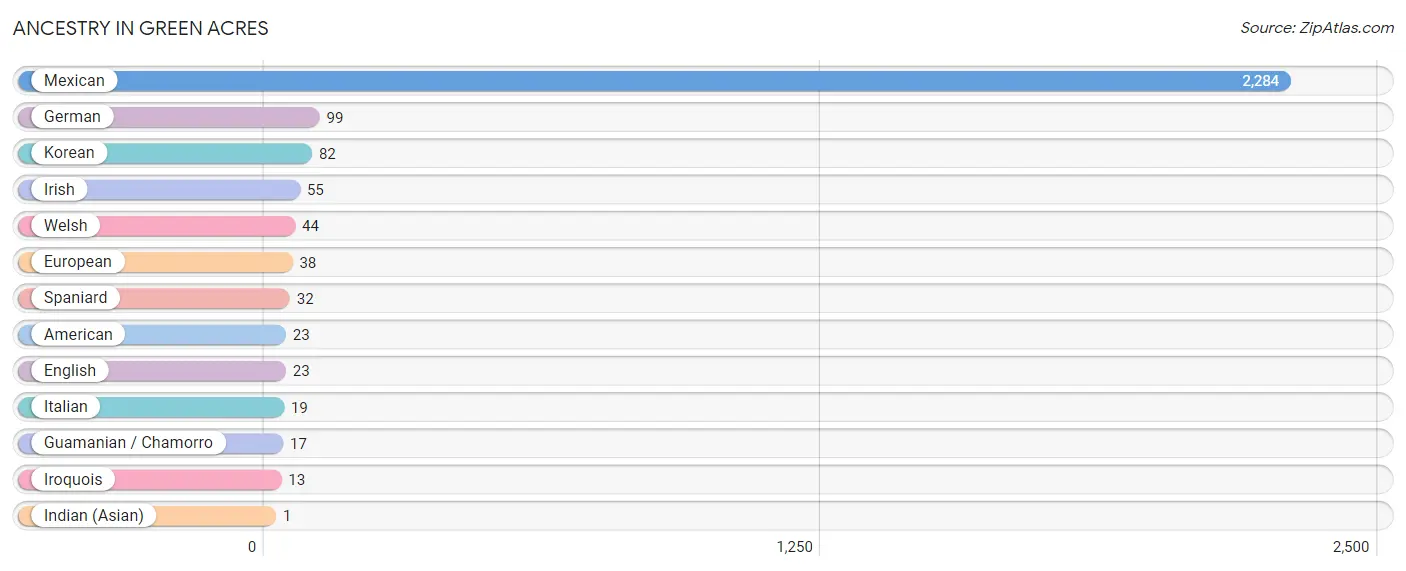
| Ancestry | # Population | % Population |
| American | 23 | 0.8% |
| English | 23 | 0.8% |
| European | 38 | 1.3% |
| German | 99 | 3.3% |
| Guamanian / Chamorro | 17 | 0.6% |
| Indian (Asian) | 1 | 0.0% |
| Irish | 55 | 1.8% |
| Iroquois | 13 | 0.4% |
| Italian | 19 | 0.6% |
| Korean | 82 | 2.7% |
| Mexican | 2,284 | 75.5% |
| Spaniard | 32 | 1.1% |
| Welsh | 44 | 1.5% | View All 13 Rows |
Immigrants in Green Acres
The most numerous immigrant groups reported in Green Acres came from Central America (538 | 17.8%), Latin America (538 | 17.8%), Mexico (538 | 17.8%), Europe (19 | 0.6%), and Italy (19 | 0.6%), together accounting for 54.7% of all Green Acres residents.
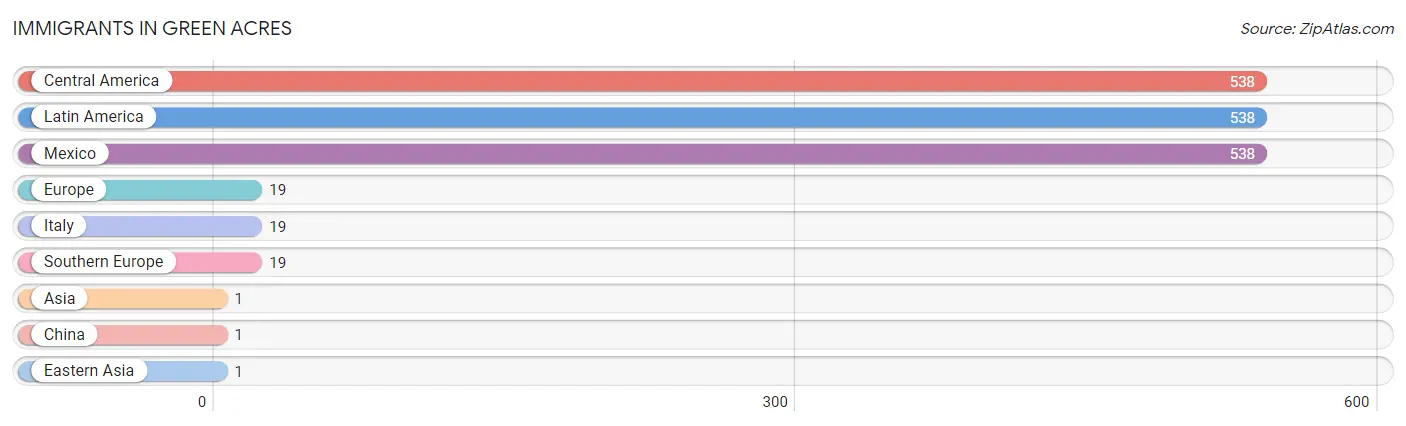
| Immigration Origin | # Population | % Population |
| Asia | 1 | 0.0% |
| Central America | 538 | 17.8% |
| China | 1 | 0.0% |
| Eastern Asia | 1 | 0.0% |
| Europe | 19 | 0.6% |
| Italy | 19 | 0.6% |
| Latin America | 538 | 17.8% |
| Mexico | 538 | 17.8% |
| Southern Europe | 19 | 0.6% | View All 9 Rows |
Sex and Age in Green Acres
Sex and Age in Green Acres
The most populous age groups in Green Acres are Under 5 Years (313 | 26.4%) for men and 20 to 24 Years (232 | 12.6%) for women.
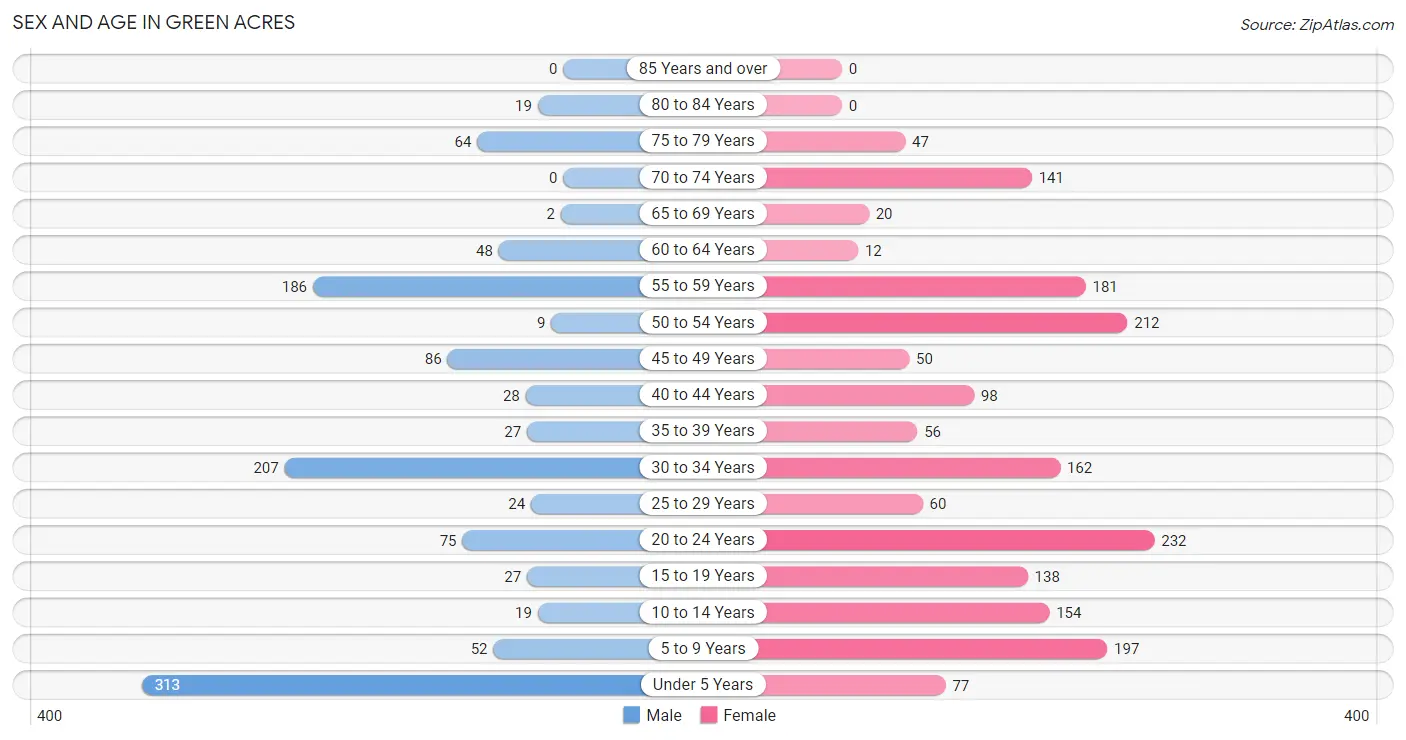
| Age Bracket | Male | Female |
| Under 5 Years | 313 (26.4%) | 77 (4.2%) |
| 5 to 9 Years | 52 (4.4%) | 197 (10.7%) |
| 10 to 14 Years | 19 (1.6%) | 154 (8.4%) |
| 15 to 19 Years | 27 (2.3%) | 138 (7.5%) |
| 20 to 24 Years | 75 (6.3%) | 232 (12.6%) |
| 25 to 29 Years | 24 (2.0%) | 60 (3.3%) |
| 30 to 34 Years | 207 (17.4%) | 162 (8.8%) |
| 35 to 39 Years | 27 (2.3%) | 56 (3.0%) |
| 40 to 44 Years | 28 (2.4%) | 98 (5.3%) |
| 45 to 49 Years | 86 (7.2%) | 50 (2.7%) |
| 50 to 54 Years | 9 (0.8%) | 212 (11.5%) |
| 55 to 59 Years | 186 (15.7%) | 181 (9.9%) |
| 60 to 64 Years | 48 (4.1%) | 12 (0.6%) |
| 65 to 69 Years | 2 (0.2%) | 20 (1.1%) |
| 70 to 74 Years | 0 (0.0%) | 141 (7.7%) |
| 75 to 79 Years | 64 (5.4%) | 47 (2.6%) |
| 80 to 84 Years | 19 (1.6%) | 0 (0.0%) |
| 85 Years and over | 0 (0.0%) | 0 (0.0%) |
| Total | 1,186 (100.0%) | 1,837 (100.0%) |
Families and Households in Green Acres
Median Family Size in Green Acres
The median family size in Green Acres is 5.56 persons per family, with single male/father families (25 | 5.6%) accounting for the largest median family size of 8 persons per family. On the other hand, single female/mother families (118 | 26.2%) represent the smallest median family size with 4.25 persons per family.
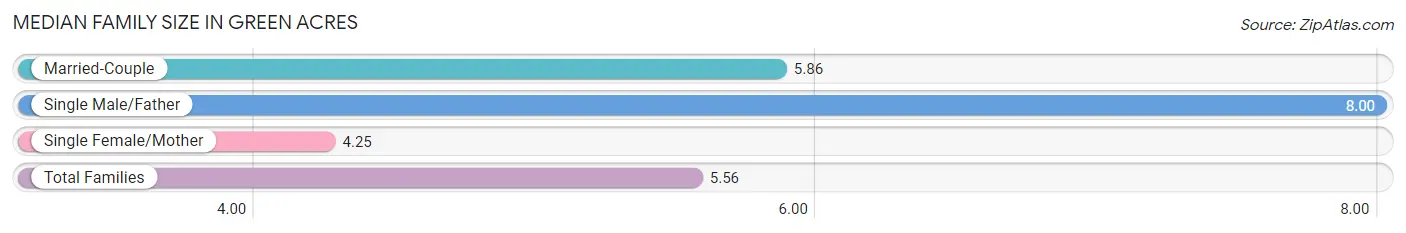
| Family Type | # Families | Family Size |
| Married-Couple | 307 (68.2%) | 5.86 |
| Single Male/Father | 25 (5.6%) | 8.00 |
| Single Female/Mother | 118 (26.2%) | 4.25 |
| Total Families | 450 (100.0%) | 5.56 |
Median Household Size in Green Acres
The median household size in Green Acres is 3.76 persons per household, with single male/father households (25 | 3.1%) accounting for the largest median household size of 8.72 persons per household. non-family households (353 | 44.0%) represent the smallest median household size with 1.35 persons per household.
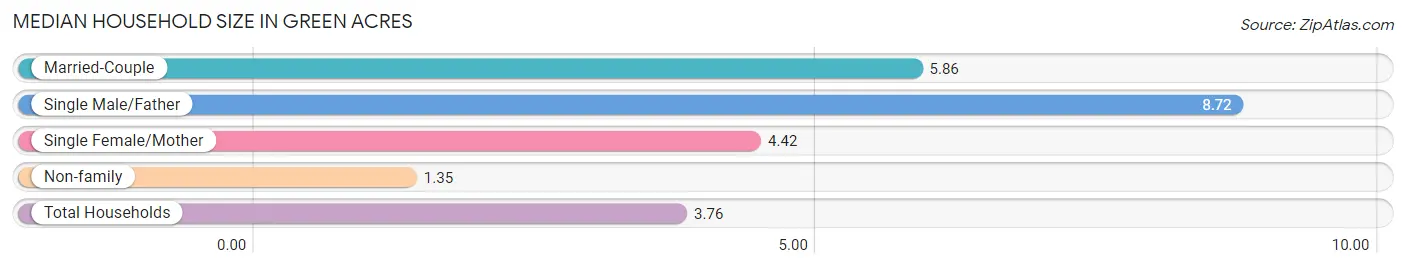
| Household Type | # Households | Household Size |
| Married-Couple | 307 (38.2%) | 5.86 |
| Single Male/Father | 25 (3.1%) | 8.72 |
| Single Female/Mother | 118 (14.7%) | 4.42 |
| Non-family | 353 (44.0%) | 1.35 |
| Total Households | 803 (100.0%) | 3.76 |
Household Size by Marriage Status in Green Acres
Out of a total of 803 households in Green Acres, 450 (56.0%) are family households, while 353 (44.0%) are nonfamily households. The most numerous type of family households are 7+ person households, comprising 165, and the most common type of nonfamily households are 1-person households, comprising 234.
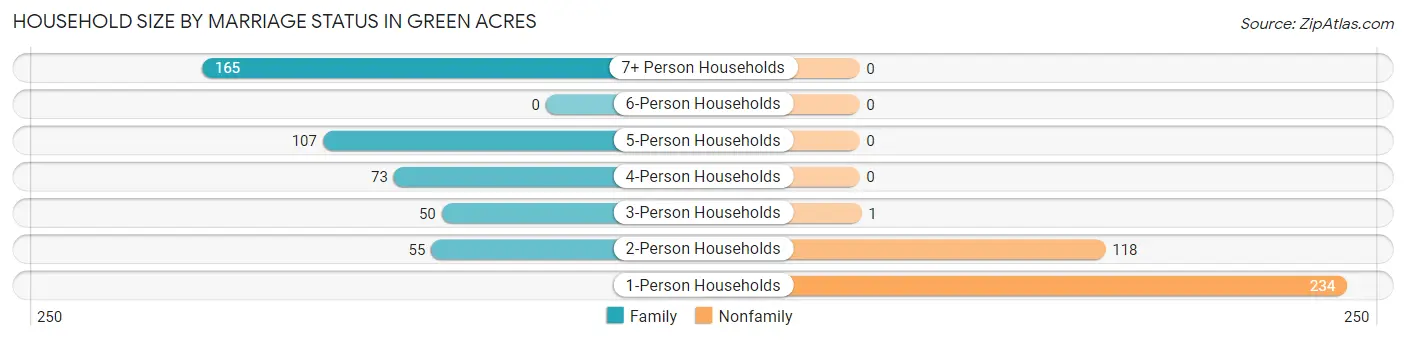
| Household Size | Family Households | Nonfamily Households |
| 1-Person Households | - | 234 (29.1%) |
| 2-Person Households | 55 (6.9%) | 118 (14.7%) |
| 3-Person Households | 50 (6.2%) | 1 (0.1%) |
| 4-Person Households | 73 (9.1%) | 0 (0.0%) |
| 5-Person Households | 107 (13.3%) | 0 (0.0%) |
| 6-Person Households | 0 (0.0%) | 0 (0.0%) |
| 7+ Person Households | 165 (20.5%) | 0 (0.0%) |
| Total | 450 (56.0%) | 353 (44.0%) |
Female Fertility in Green Acres
Fertility by Age in Green Acres
Average fertility rate in Green Acres is 69.0 births per 1,000 women. Women in the age bracket of 35 to 50 years have the highest fertility rate with 93.0 births per 1,000 women. Women in the age bracket of 20 to 34 years acount for 65.4% of all women with births.
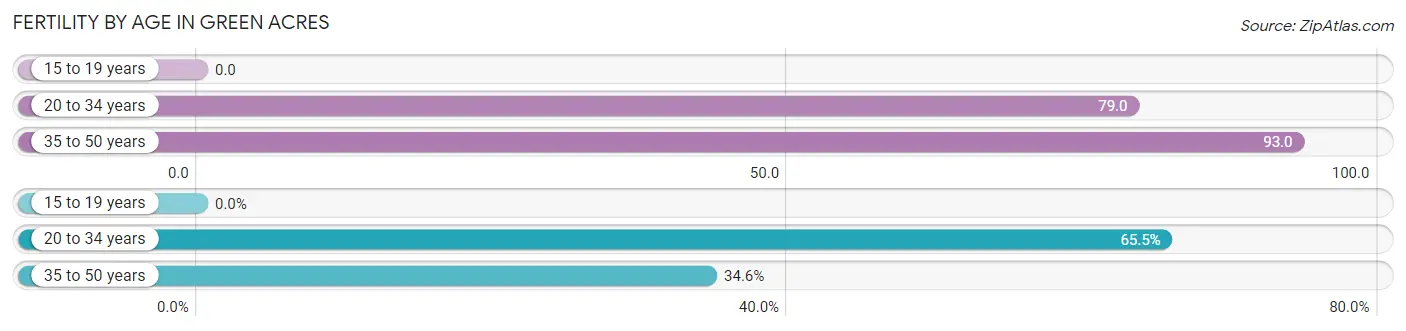
| Age Bracket | Women with Births | Births / 1,000 Women |
| 15 to 19 years | 0 (0.0%) | 0.0 |
| 20 to 34 years | 36 (65.4%) | 79.0 |
| 35 to 50 years | 19 (34.5%) | 93.0 |
| Total | 55 (100.0%) | 69.0 |
Fertility by Age by Marriage Status in Green Acres
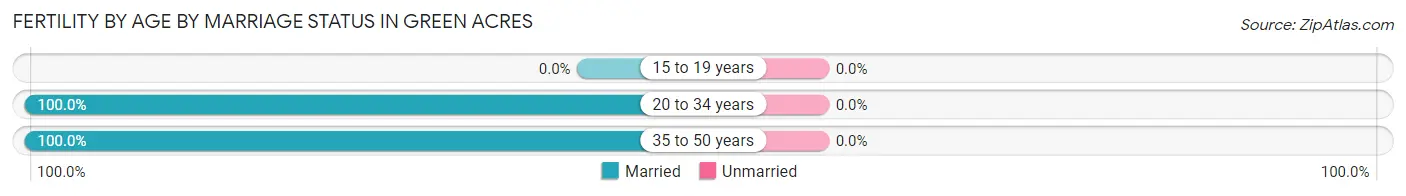
| Age Bracket | Married | Unmarried |
| 15 to 19 years | 0 (0.0%) | 0 (0.0%) |
| 20 to 34 years | 36 (100.0%) | 0 (0.0%) |
| 35 to 50 years | 19 (100.0%) | 0 (0.0%) |
| Total | 55 (100.0%) | 0 (0.0%) |
Fertility by Education in Green Acres
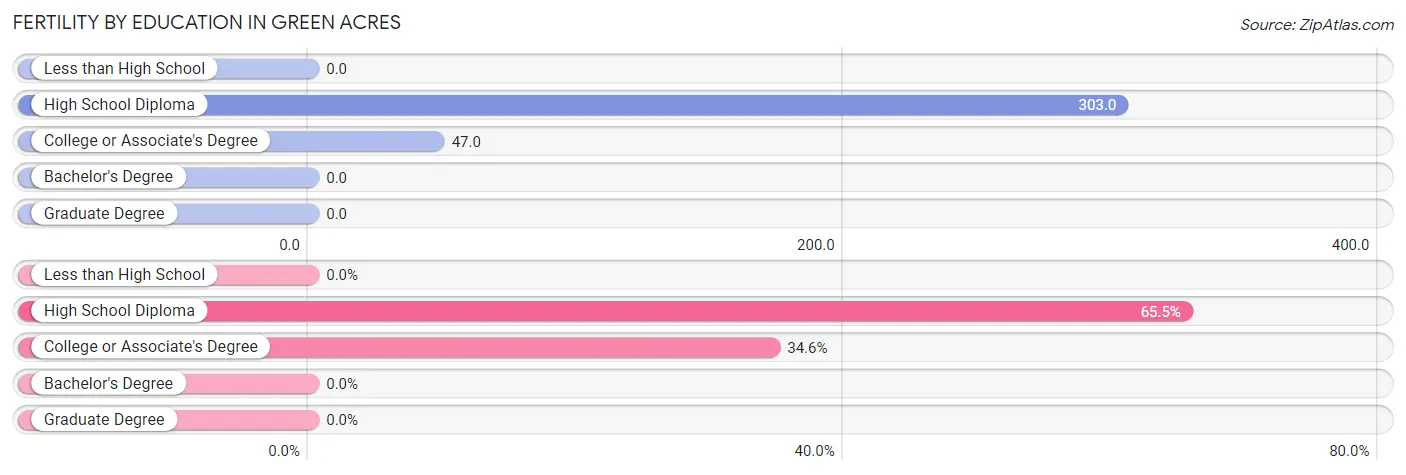
| Educational Attainment | Women with Births | Births / 1,000 Women |
| Less than High School | 0 (0.0%) | 0.0 |
| High School Diploma | 36 (65.4%) | 303.0 |
| College or Associate's Degree | 19 (34.5%) | 47.0 |
| Bachelor's Degree | 0 (0.0%) | 0.0 |
| Graduate Degree | 0 (0.0%) | 0.0 |
| Total | 55 (100.0%) | 69.0 |
Fertility by Education by Marriage Status in Green Acres
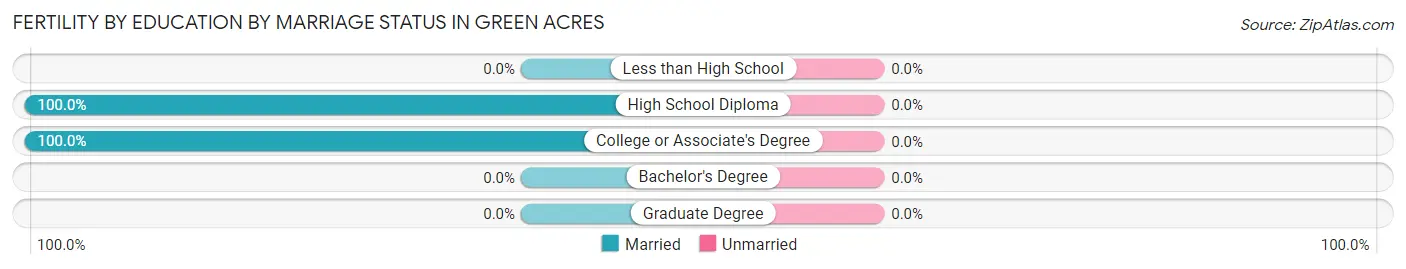
| Educational Attainment | Married | Unmarried |
| Less than High School | 0 (0.0%) | 0 (0.0%) |
| High School Diploma | 36 (100.0%) | 0 (0.0%) |
| College or Associate's Degree | 19 (100.0%) | 0 (0.0%) |
| Bachelor's Degree | 0 (0.0%) | 0 (0.0%) |
| Graduate Degree | 0 (0.0%) | 0 (0.0%) |
| Total | 55 (100.0%) | 0 (0.0%) |
Employment Characteristics in Green Acres
Employment by Class of Employer in Green Acres
Among the 1,197 employed individuals in Green Acres, private company employees (998 | 83.4%), self-employed (incorporated) (44 | 3.7%), and not-for-profit organizations (44 | 3.7%) make up the most common classes of employment.
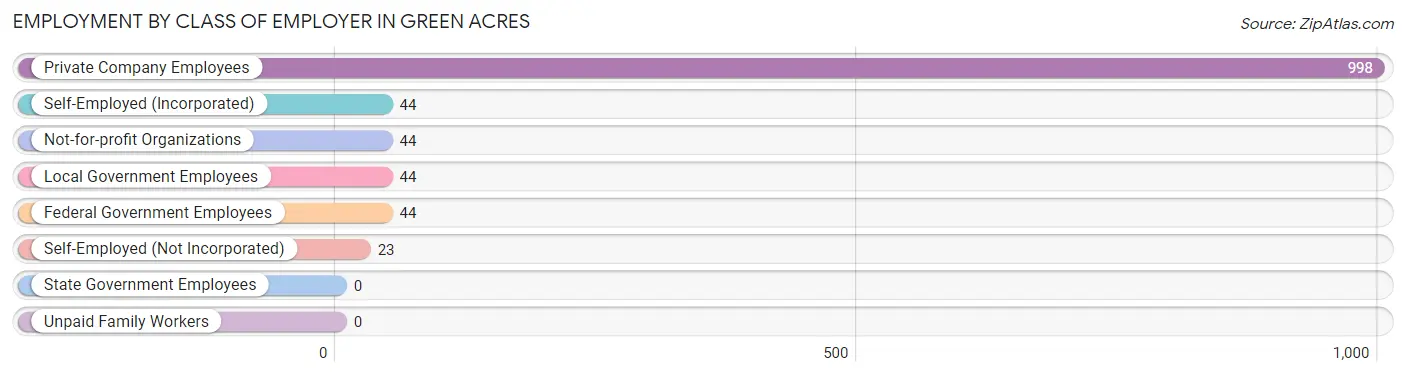
| Employer Class | # Employees | % Employees |
| Private Company Employees | 998 | 83.4% |
| Self-Employed (Incorporated) | 44 | 3.7% |
| Self-Employed (Not Incorporated) | 23 | 1.9% |
| Not-for-profit Organizations | 44 | 3.7% |
| Local Government Employees | 44 | 3.7% |
| State Government Employees | 0 | 0.0% |
| Federal Government Employees | 44 | 3.7% |
| Unpaid Family Workers | 0 | 0.0% |
| Total | 1,197 | 100.0% |
Employment Status by Age in Green Acres
According to the labor force statistics for Green Acres, out of the total population over 16 years of age (2,172), 66.1% or 1,436 individuals are in the labor force, with 15.1% or 217 of them unemployed. The age group with the highest labor force participation rate is 30 to 34 years, with 95.7% or 353 individuals in the labor force. Within the labor force, the 55 to 59 years age range has the highest percentage of unemployed individuals, with 35.3% or 122 of them being unemployed.
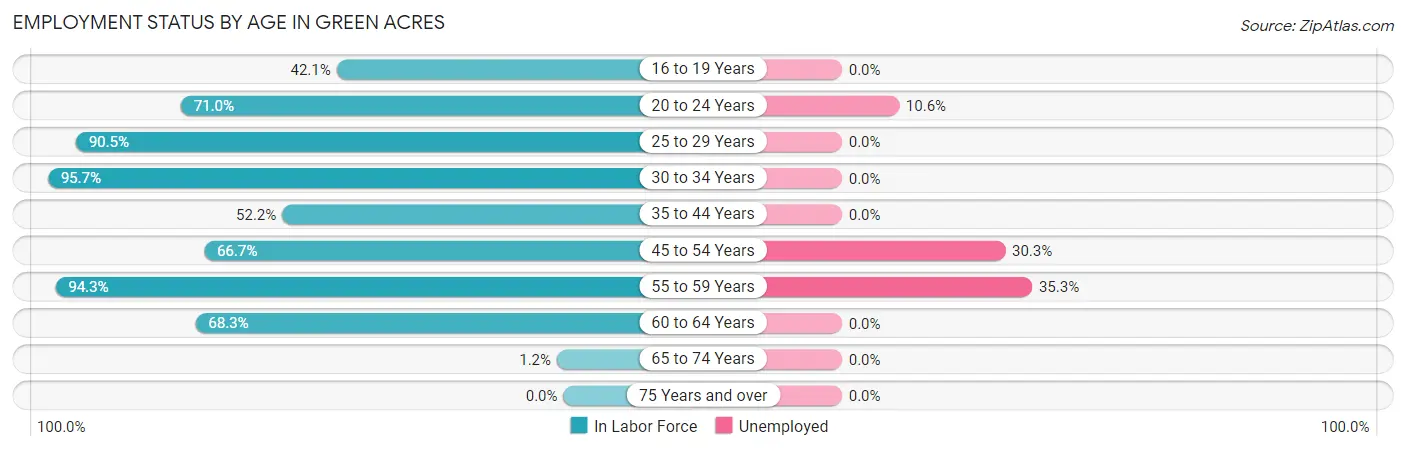
| Age Bracket | In Labor Force | Unemployed |
| 16 to 19 Years | 53 (42.1%) | 0 (0.0%) |
| 20 to 24 Years | 218 (71.0%) | 23 (10.6%) |
| 25 to 29 Years | 76 (90.5%) | 0 (0.0%) |
| 30 to 34 Years | 353 (95.7%) | 0 (0.0%) |
| 35 to 44 Years | 109 (52.2%) | 0 (0.0%) |
| 45 to 54 Years | 238 (66.7%) | 72 (30.3%) |
| 55 to 59 Years | 346 (94.3%) | 122 (35.3%) |
| 60 to 64 Years | 41 (68.3%) | 0 (0.0%) |
| 65 to 74 Years | 2 (1.2%) | 0 (0.0%) |
| 75 Years and over | 0 (0.0%) | 0 (0.0%) |
| Total | 1,436 (66.1%) | 217 (15.1%) |
Employment Status by Educational Attainment in Green Acres
According to labor force statistics for Green Acres, 80.4% of individuals (1,163) out of the total population between 25 and 64 years of age (1,446) are in the labor force, with 16.7% or 194 of them being unemployed. The group with the highest labor force participation rate are those with the educational attainment of college / associate degree, with 97.2% or 494 individuals in the labor force. Within the labor force, individuals with less than high school education have the highest percentage of unemployment, with 33.1% or 140 of them being unemployed.
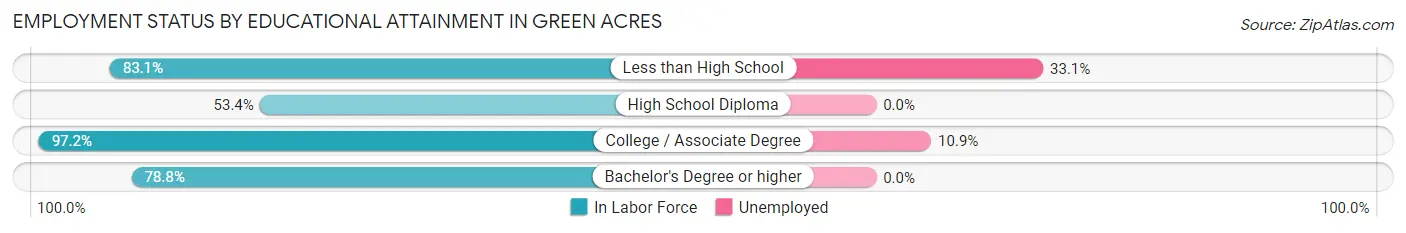
| Educational Attainment | In Labor Force | Unemployed |
| Less than High School | 423 (83.1%) | 168 (33.1%) |
| High School Diploma | 194 (53.4%) | 0 (0.0%) |
| College / Associate Degree | 494 (97.2%) | 55 (10.9%) |
| Bachelor's Degree or higher | 52 (78.8%) | 0 (0.0%) |
| Total | 1,163 (80.4%) | 241 (16.7%) |
Employment Occupations by Sex in Green Acres
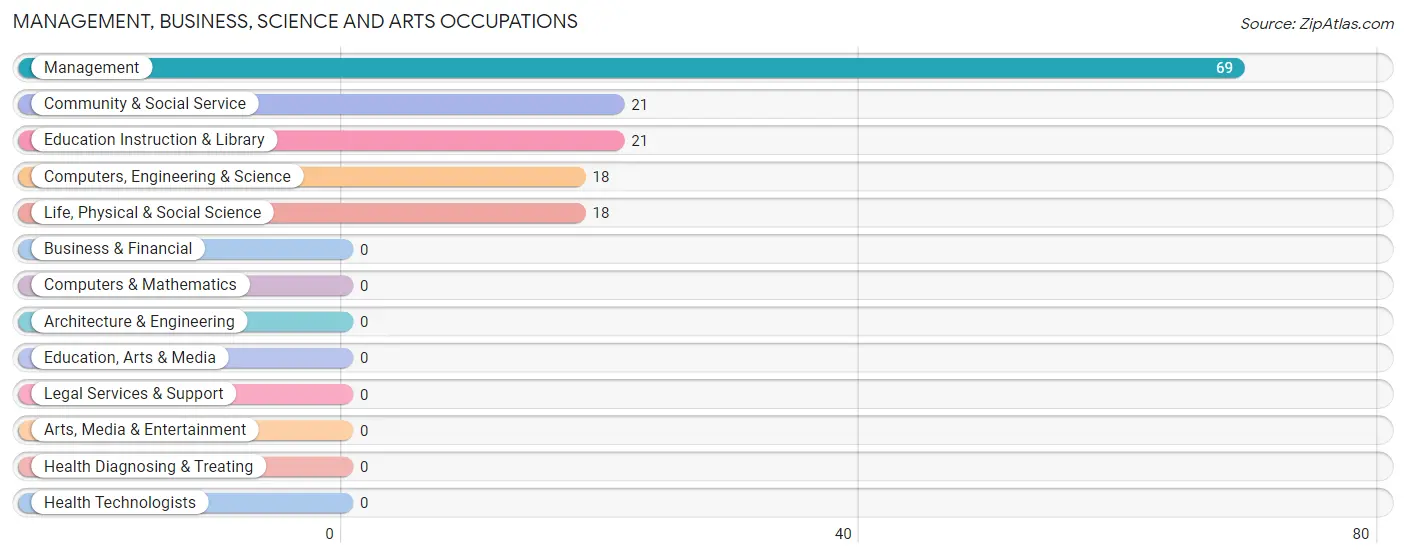
Management, Business, Science and Arts Occupations
The most common Management, Business, Science and Arts occupations in Green Acres are Management (69 | 5.7%), Community & Social Service (21 | 1.7%), Education Instruction & Library (21 | 1.7%), Computers, Engineering & Science (18 | 1.5%), and Life, Physical & Social Science (18 | 1.5%).
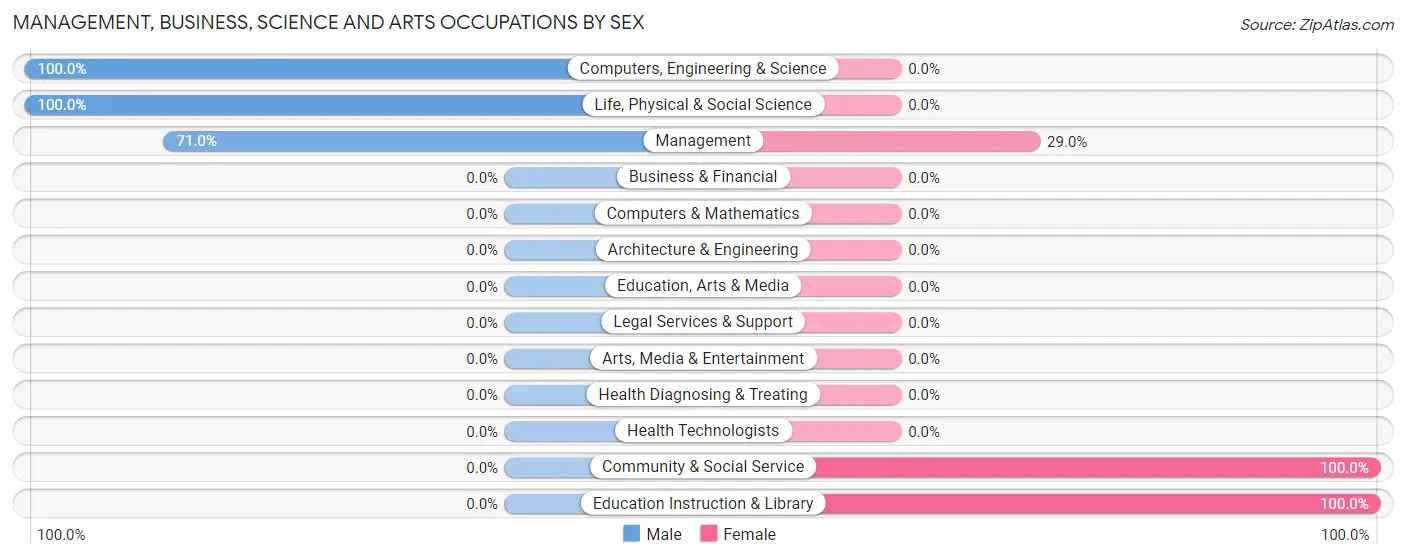
Management, Business, Science and Arts Occupations by Sex
Within the Management, Business, Science and Arts occupations in Green Acres, the most male-oriented occupations are Computers, Engineering & Science (100.0%), Life, Physical & Social Science (100.0%), and Management (71.0%), while the most female-oriented occupations are Community & Social Service (100.0%), Education Instruction & Library (100.0%), and Management (29.0%).
| Occupation | Male | Female |
| Management | 49 (71.0%) | 20 (29.0%) |
| Business & Financial | 0 (0.0%) | 0 (0.0%) |
| Computers, Engineering & Science | 18 (100.0%) | 0 (0.0%) |
| Computers & Mathematics | 0 (0.0%) | 0 (0.0%) |
| Architecture & Engineering | 0 (0.0%) | 0 (0.0%) |
| Life, Physical & Social Science | 18 (100.0%) | 0 (0.0%) |
| Community & Social Service | 0 (0.0%) | 21 (100.0%) |
| Education, Arts & Media | 0 (0.0%) | 0 (0.0%) |
| Legal Services & Support | 0 (0.0%) | 0 (0.0%) |
| Education Instruction & Library | 0 (0.0%) | 21 (100.0%) |
| Arts, Media & Entertainment | 0 (0.0%) | 0 (0.0%) |
| Health Diagnosing & Treating | 0 (0.0%) | 0 (0.0%) |
| Health Technologists | 0 (0.0%) | 0 (0.0%) |
| Total (Category) | 67 (62.0%) | 41 (38.0%) |
| Total (Overall) | 592 (48.6%) | 627 (51.4%) |
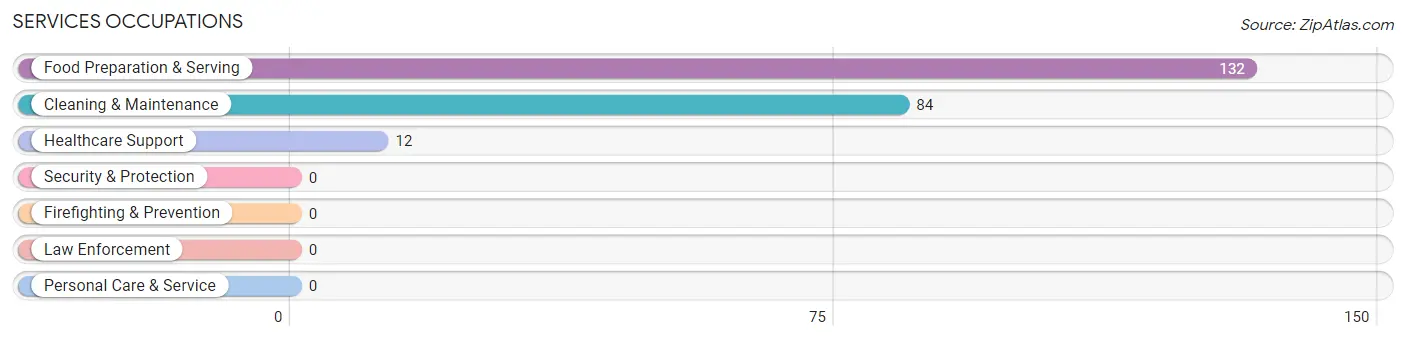
Services Occupations
The most common Services occupations in Green Acres are Food Preparation & Serving (132 | 10.8%), Cleaning & Maintenance (84 | 6.9%), and Healthcare Support (12 | 1.0%).
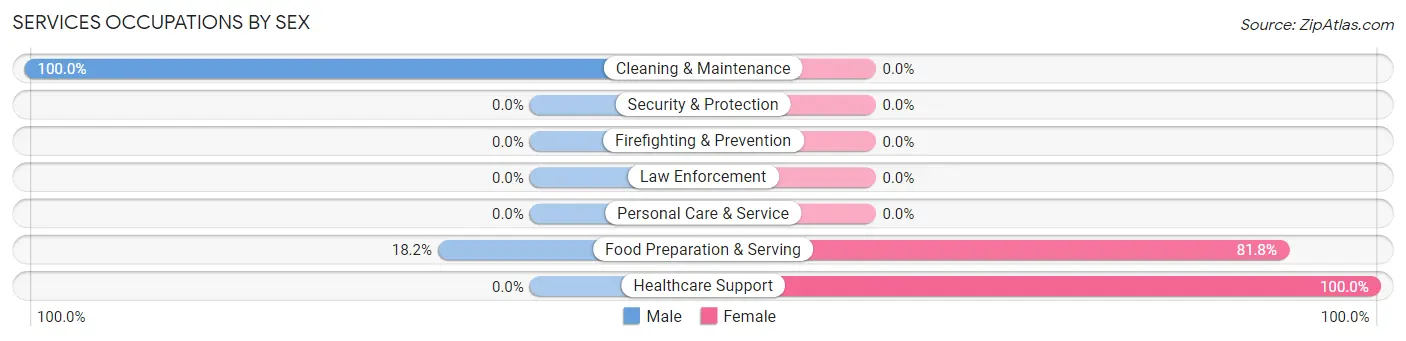
Services Occupations by Sex
Within the Services occupations in Green Acres, the most male-oriented occupations are Cleaning & Maintenance (100.0%), and Food Preparation & Serving (18.2%), while the most female-oriented occupations are Healthcare Support (100.0%), and Food Preparation & Serving (81.8%).
| Occupation | Male | Female |
| Healthcare Support | 0 (0.0%) | 12 (100.0%) |
| Security & Protection | 0 (0.0%) | 0 (0.0%) |
| Firefighting & Prevention | 0 (0.0%) | 0 (0.0%) |
| Law Enforcement | 0 (0.0%) | 0 (0.0%) |
| Food Preparation & Serving | 24 (18.2%) | 108 (81.8%) |
| Cleaning & Maintenance | 84 (100.0%) | 0 (0.0%) |
| Personal Care & Service | 0 (0.0%) | 0 (0.0%) |
| Total (Category) | 108 (47.4%) | 120 (52.6%) |
| Total (Overall) | 592 (48.6%) | 627 (51.4%) |
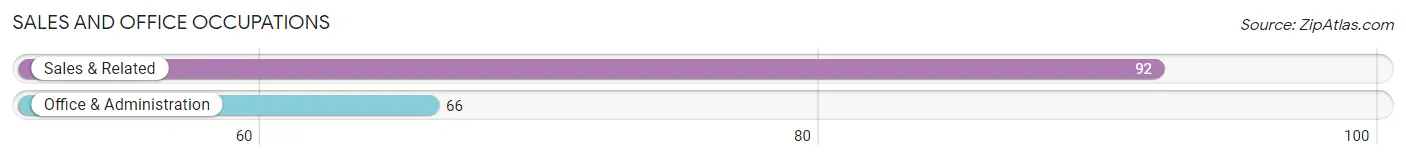
Sales and Office Occupations
The most common Sales and Office occupations in Green Acres are Sales & Related (92 | 7.5%), and Office & Administration (66 | 5.4%).
Sales and Office Occupations by Sex
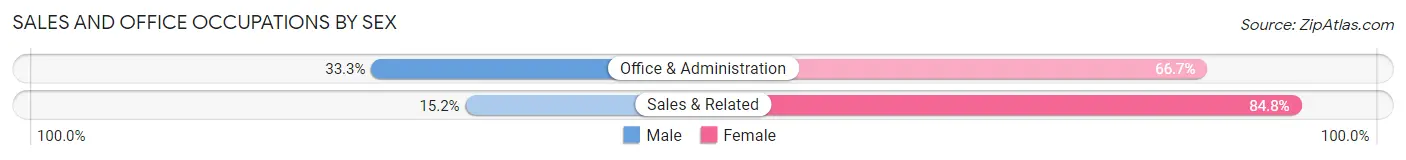
| Occupation | Male | Female |
| Sales & Related | 14 (15.2%) | 78 (84.8%) |
| Office & Administration | 22 (33.3%) | 44 (66.7%) |
| Total (Category) | 36 (22.8%) | 122 (77.2%) |
| Total (Overall) | 592 (48.6%) | 627 (51.4%) |
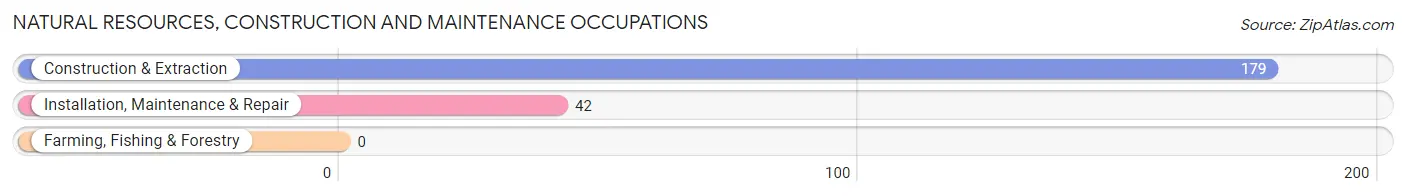
Natural Resources, Construction and Maintenance Occupations
The most common Natural Resources, Construction and Maintenance occupations in Green Acres are Construction & Extraction (179 | 14.7%), and Installation, Maintenance & Repair (42 | 3.5%).
Natural Resources, Construction and Maintenance Occupations by Sex
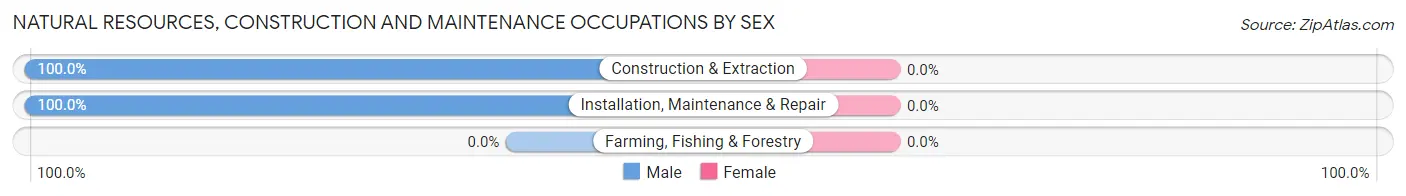
| Occupation | Male | Female |
| Farming, Fishing & Forestry | 0 (0.0%) | 0 (0.0%) |
| Construction & Extraction | 179 (100.0%) | 0 (0.0%) |
| Installation, Maintenance & Repair | 42 (100.0%) | 0 (0.0%) |
| Total (Category) | 221 (100.0%) | 0 (0.0%) |
| Total (Overall) | 592 (48.6%) | 627 (51.4%) |
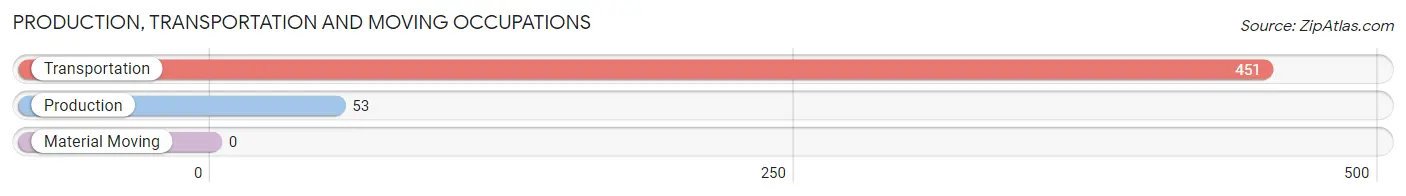
Production, Transportation and Moving Occupations
The most common Production, Transportation and Moving occupations in Green Acres are Transportation (451 | 37.0%), and Production (53 | 4.3%).
Production, Transportation and Moving Occupations by Sex
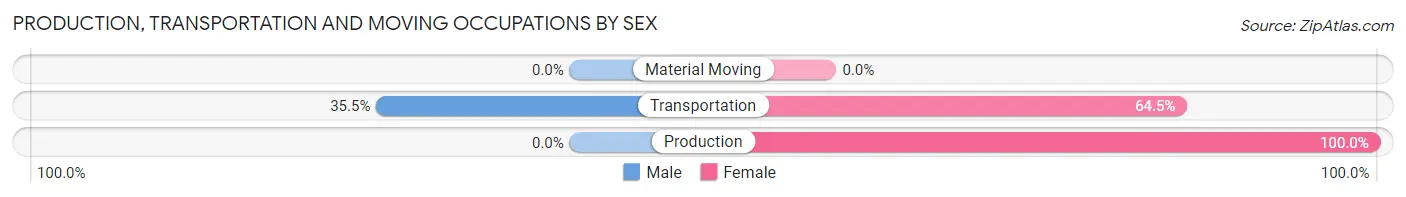
| Occupation | Male | Female |
| Production | 0 (0.0%) | 53 (100.0%) |
| Transportation | 160 (35.5%) | 291 (64.5%) |
| Material Moving | 0 (0.0%) | 0 (0.0%) |
| Total (Category) | 160 (31.8%) | 344 (68.2%) |
| Total (Overall) | 592 (48.6%) | 627 (51.4%) |
Employment Industries by Sex in Green Acres
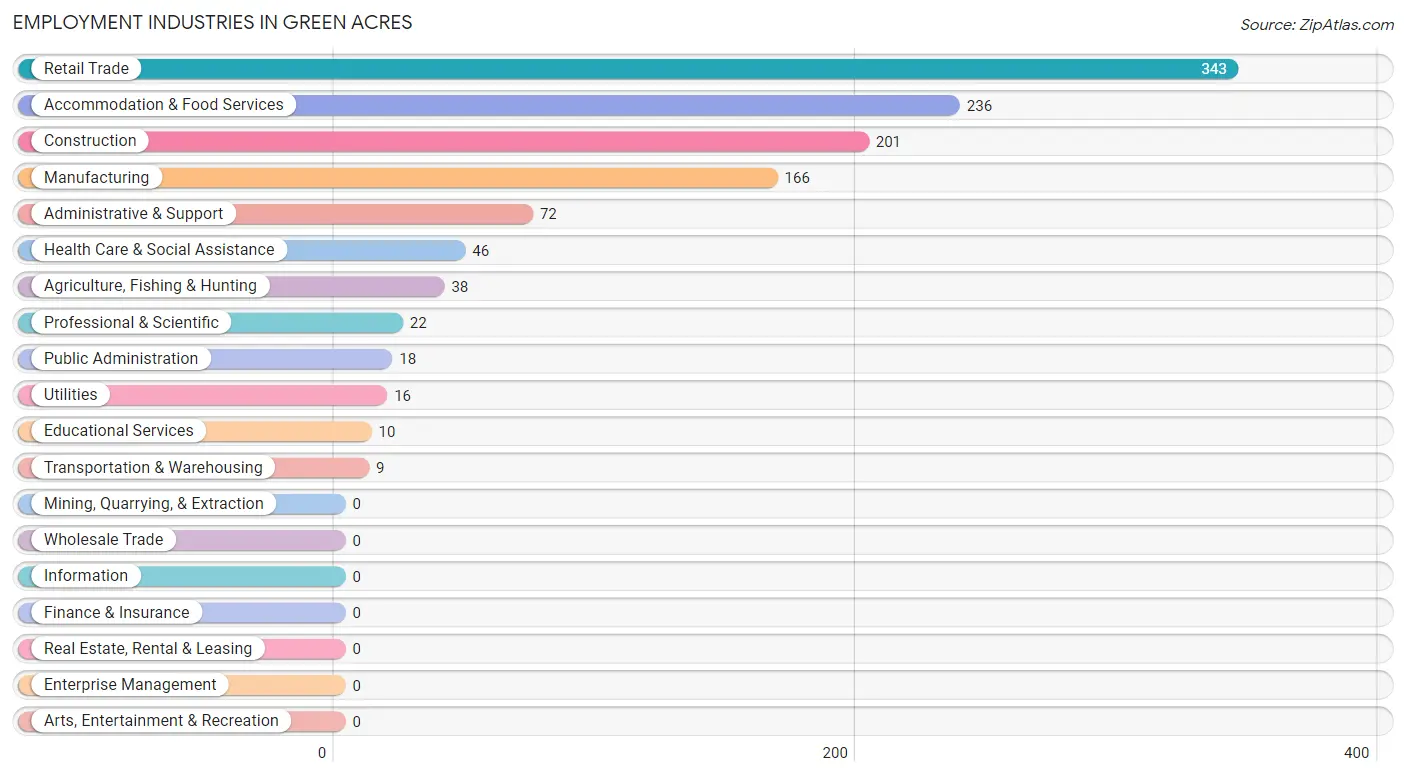
Employment Industries in Green Acres
The major employment industries in Green Acres include Retail Trade (343 | 28.1%), Accommodation & Food Services (236 | 19.4%), Construction (201 | 16.5%), Manufacturing (166 | 13.6%), and Administrative & Support (72 | 5.9%).
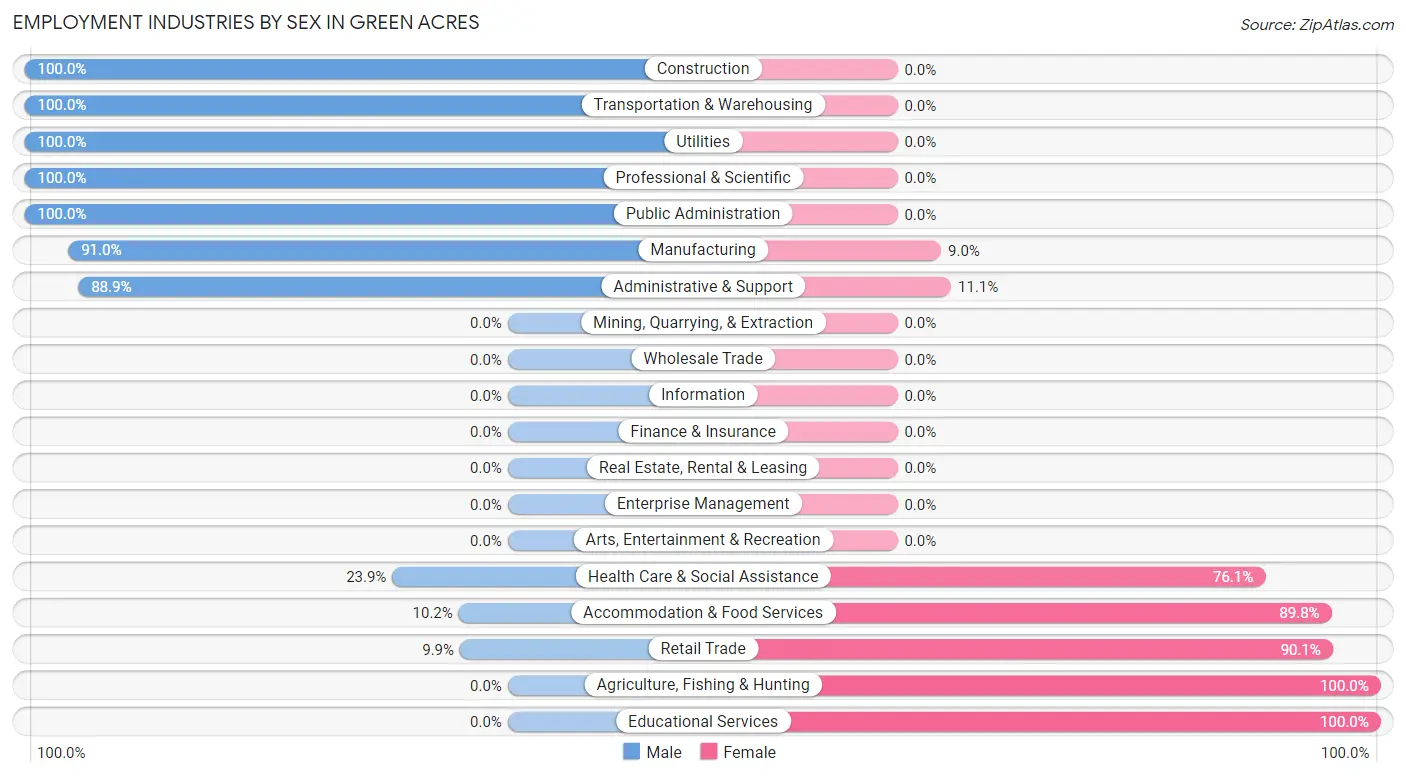
Employment Industries by Sex in Green Acres
The Green Acres industries that see more men than women are Construction (100.0%), Transportation & Warehousing (100.0%), and Utilities (100.0%), whereas the industries that tend to have a higher number of women are Agriculture, Fishing & Hunting (100.0%), Educational Services (100.0%), and Retail Trade (90.1%).
| Industry | Male | Female |
| Agriculture, Fishing & Hunting | 0 (0.0%) | 38 (100.0%) |
| Mining, Quarrying, & Extraction | 0 (0.0%) | 0 (0.0%) |
| Construction | 201 (100.0%) | 0 (0.0%) |
| Manufacturing | 151 (91.0%) | 15 (9.0%) |
| Wholesale Trade | 0 (0.0%) | 0 (0.0%) |
| Retail Trade | 34 (9.9%) | 309 (90.1%) |
| Transportation & Warehousing | 9 (100.0%) | 0 (0.0%) |
| Utilities | 16 (100.0%) | 0 (0.0%) |
| Information | 0 (0.0%) | 0 (0.0%) |
| Finance & Insurance | 0 (0.0%) | 0 (0.0%) |
| Real Estate, Rental & Leasing | 0 (0.0%) | 0 (0.0%) |
| Professional & Scientific | 22 (100.0%) | 0 (0.0%) |
| Enterprise Management | 0 (0.0%) | 0 (0.0%) |
| Administrative & Support | 64 (88.9%) | 8 (11.1%) |
| Educational Services | 0 (0.0%) | 10 (100.0%) |
| Health Care & Social Assistance | 11 (23.9%) | 35 (76.1%) |
| Arts, Entertainment & Recreation | 0 (0.0%) | 0 (0.0%) |
| Accommodation & Food Services | 24 (10.2%) | 212 (89.8%) |
| Public Administration | 18 (100.0%) | 0 (0.0%) |
| Total | 592 (48.6%) | 627 (51.4%) |
Education in Green Acres
School Enrollment in Green Acres
The most common levels of schooling among the 588 students in Green Acres are high school (199 | 33.8%), elementary school (165 | 28.1%), and middle school (134 | 22.8%).
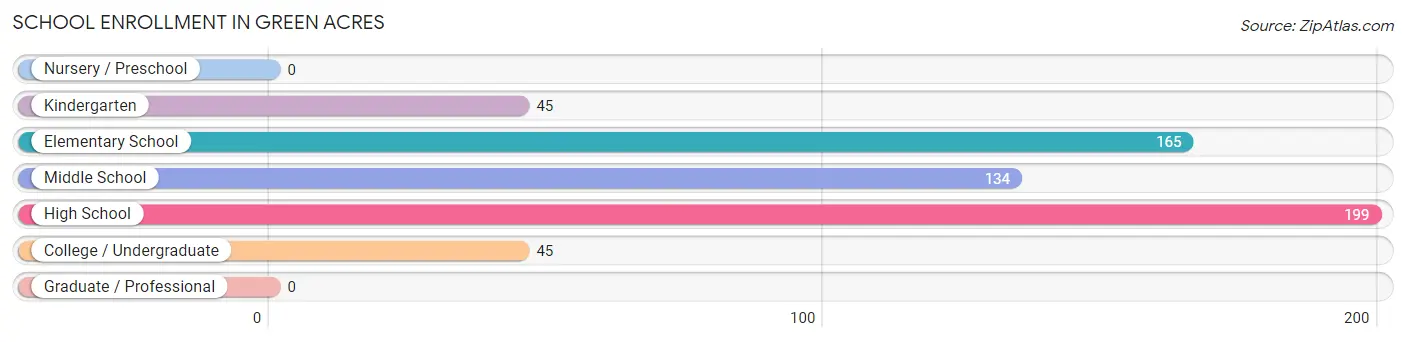
| School Level | # Students | % Students |
| Nursery / Preschool | 0 | 0.0% |
| Kindergarten | 45 | 7.6% |
| Elementary School | 165 | 28.1% |
| Middle School | 134 | 22.8% |
| High School | 199 | 33.8% |
| College / Undergraduate | 45 | 7.6% |
| Graduate / Professional | 0 | 0.0% |
| Total | 588 | 100.0% |
School Enrollment by Age by Funding Source in Green Acres
Out of a total of 588 students who are enrolled in schools in Green Acres, 142 (24.1%) attend a private institution, while the remaining 446 (75.9%) are enrolled in public schools. The age group of 5 to 9 year old has the highest likelihood of being enrolled in private schools, with 130 (64.0% in the age bracket) enrolled. Conversely, the age group of 3 to 4 year olds has the lowest likelihood of being enrolled in a private school, with 7 (100.0% in the age bracket) attending a public institution.
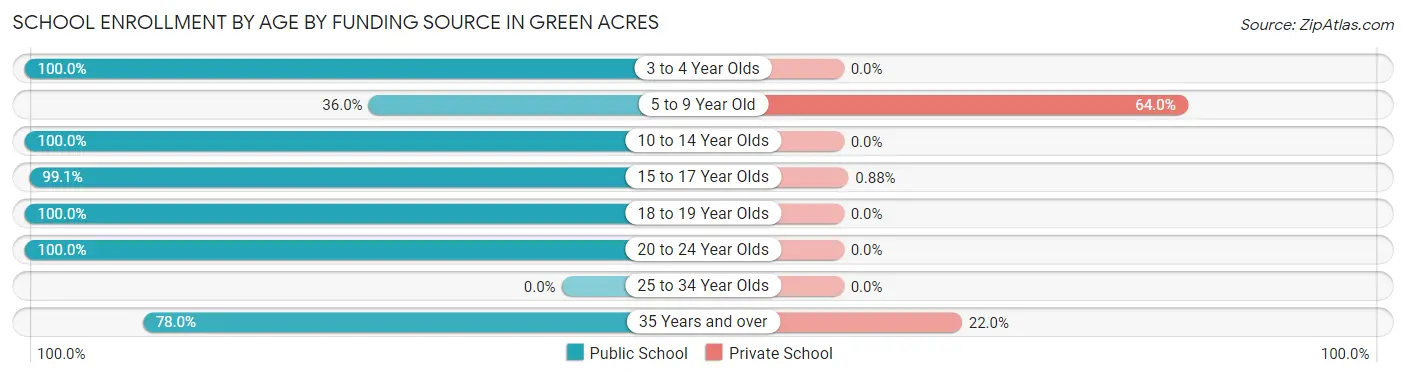
| Age Bracket | Public School | Private School |
| 3 to 4 Year Olds | 7 (100.0%) | 0 (0.0%) |
| 5 to 9 Year Old | 73 (36.0%) | 130 (64.0%) |
| 10 to 14 Year Olds | 173 (100.0%) | 0 (0.0%) |
| 15 to 17 Year Olds | 112 (99.1%) | 1 (0.9%) |
| 18 to 19 Year Olds | 20 (100.0%) | 0 (0.0%) |
| 20 to 24 Year Olds | 22 (100.0%) | 0 (0.0%) |
| 25 to 34 Year Olds | 0 (0.0%) | 0 (0.0%) |
| 35 Years and over | 39 (78.0%) | 11 (22.0%) |
| Total | 446 (75.9%) | 142 (24.1%) |
Educational Attainment by Field of Study in Green Acres
Business (31 | 30.4%), engineering (26 | 25.5%), psychology (18 | 17.6%), bio, nature & agricultural (14 | 13.7%), and arts & humanities (10 | 9.8%) are the most common fields of study among 102 individuals in Green Acres who have obtained a bachelor's degree or higher.
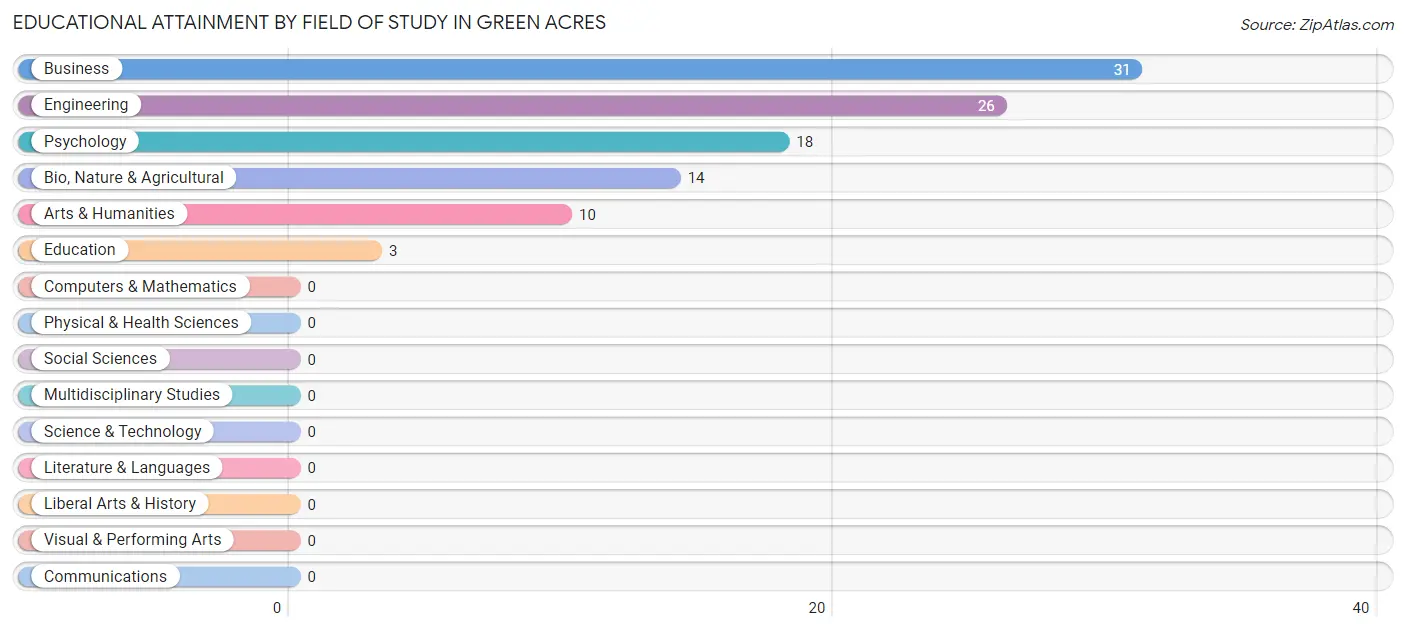
| Field of Study | # Graduates | % Graduates |
| Computers & Mathematics | 0 | 0.0% |
| Bio, Nature & Agricultural | 14 | 13.7% |
| Physical & Health Sciences | 0 | 0.0% |
| Psychology | 18 | 17.6% |
| Social Sciences | 0 | 0.0% |
| Engineering | 26 | 25.5% |
| Multidisciplinary Studies | 0 | 0.0% |
| Science & Technology | 0 | 0.0% |
| Business | 31 | 30.4% |
| Education | 3 | 2.9% |
| Literature & Languages | 0 | 0.0% |
| Liberal Arts & History | 0 | 0.0% |
| Visual & Performing Arts | 0 | 0.0% |
| Communications | 0 | 0.0% |
| Arts & Humanities | 10 | 9.8% |
| Total | 102 | 100.0% |
Transportation & Commute in Green Acres
Vehicle Availability by Sex in Green Acres
The most prevalent vehicle ownership categories in Green Acres are males with 5 or more vehicles (323, accounting for 56.7%) and females with 5 or more vehicles (291, making up 51.5%).
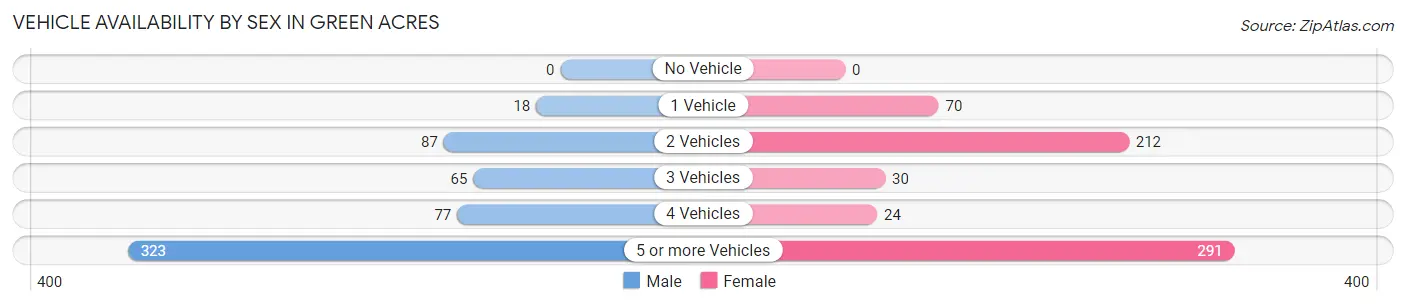
| Vehicles Available | Male | Female |
| No Vehicle | 0 (0.0%) | 0 (0.0%) |
| 1 Vehicle | 18 (3.2%) | 70 (11.2%) |
| 2 Vehicles | 87 (15.3%) | 212 (33.8%) |
| 3 Vehicles | 65 (11.4%) | 30 (4.8%) |
| 4 Vehicles | 77 (13.5%) | 24 (3.8%) |
| 5 or more Vehicles | 323 (56.7%) | 291 (46.4%) |
| Total | 570 (100.0%) | 627 (100.0%) |
Commute Time in Green Acres
The most frequently occuring commute durations in Green Acres are 45 to 59 minutes (335 commuters, 29.0%), 90 or more minutes (274 commuters, 23.8%), and 15 to 19 minutes (134 commuters, 11.6%).
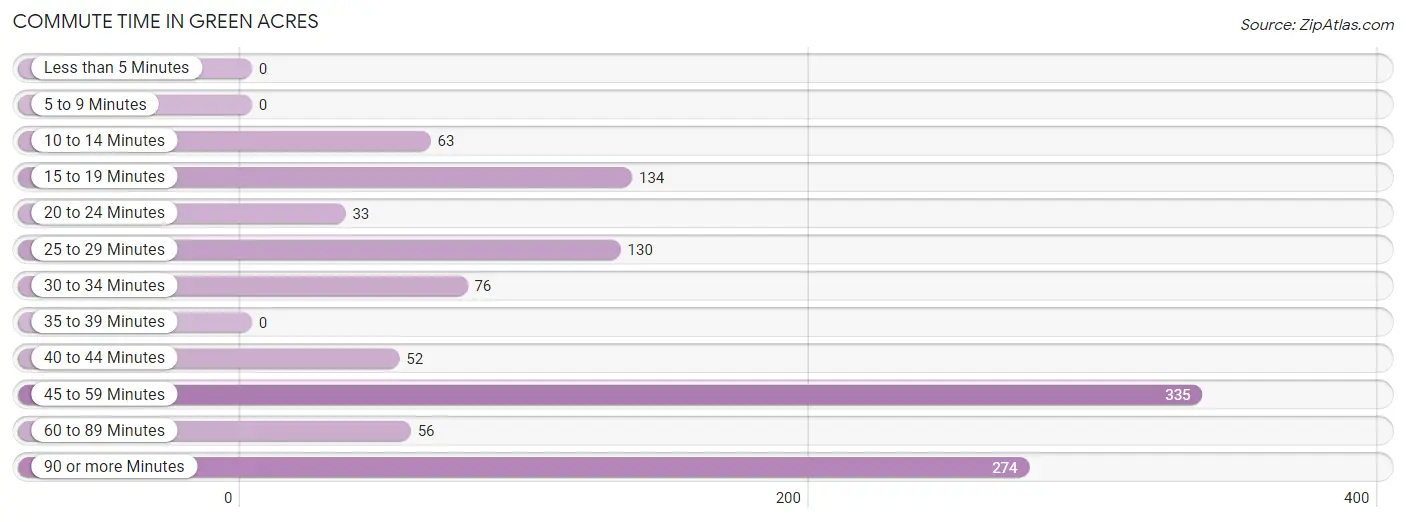
| Commute Time | # Commuters | % Commuters |
| Less than 5 Minutes | 0 | 0.0% |
| 5 to 9 Minutes | 0 | 0.0% |
| 10 to 14 Minutes | 63 | 5.5% |
| 15 to 19 Minutes | 134 | 11.6% |
| 20 to 24 Minutes | 33 | 2.9% |
| 25 to 29 Minutes | 130 | 11.3% |
| 30 to 34 Minutes | 76 | 6.6% |
| 35 to 39 Minutes | 0 | 0.0% |
| 40 to 44 Minutes | 52 | 4.5% |
| 45 to 59 Minutes | 335 | 29.0% |
| 60 to 89 Minutes | 56 | 4.9% |
| 90 or more Minutes | 274 | 23.8% |
Commute Time by Sex in Green Acres
The most common commute times in Green Acres are 90 or more minutes (256 commuters, 44.9%) for males and 45 to 59 minutes (270 commuters, 46.3%) for females.
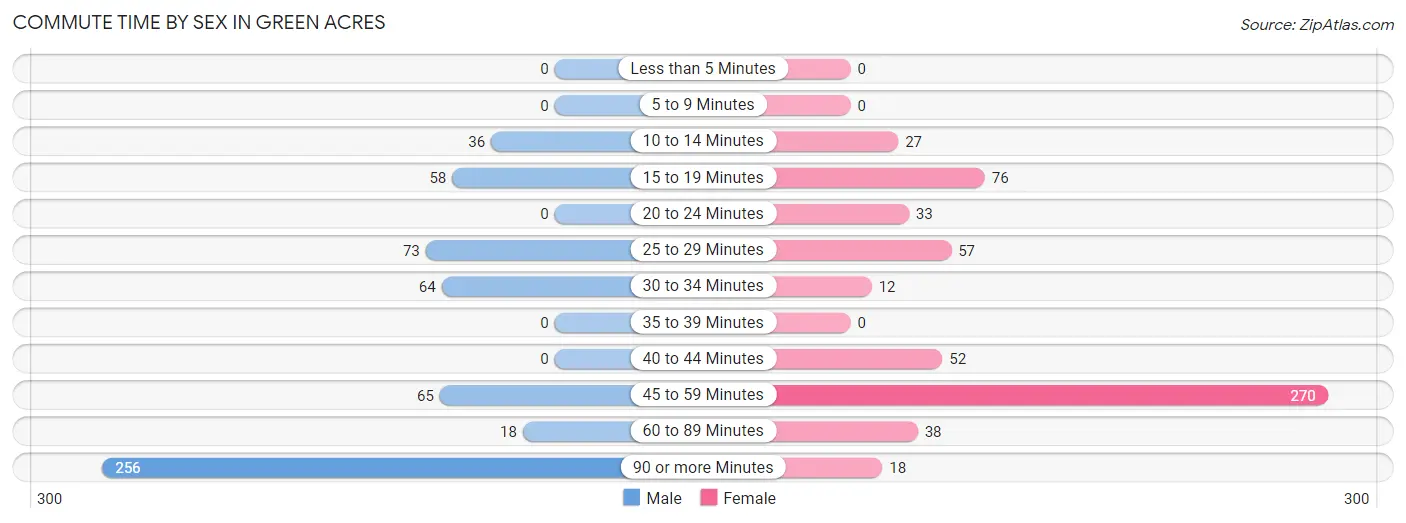
| Commute Time | Male | Female |
| Less than 5 Minutes | 0 (0.0%) | 0 (0.0%) |
| 5 to 9 Minutes | 0 (0.0%) | 0 (0.0%) |
| 10 to 14 Minutes | 36 (6.3%) | 27 (4.6%) |
| 15 to 19 Minutes | 58 (10.2%) | 76 (13.0%) |
| 20 to 24 Minutes | 0 (0.0%) | 33 (5.7%) |
| 25 to 29 Minutes | 73 (12.8%) | 57 (9.8%) |
| 30 to 34 Minutes | 64 (11.2%) | 12 (2.1%) |
| 35 to 39 Minutes | 0 (0.0%) | 0 (0.0%) |
| 40 to 44 Minutes | 0 (0.0%) | 52 (8.9%) |
| 45 to 59 Minutes | 65 (11.4%) | 270 (46.3%) |
| 60 to 89 Minutes | 18 (3.2%) | 38 (6.5%) |
| 90 or more Minutes | 256 (44.9%) | 18 (3.1%) |
Time of Departure to Work by Sex in Green Acres
The most frequent times of departure to work in Green Acres are 12:00 PM to 3:59 PM (175, 30.7%) for males and 10:00 AM to 10:59 AM (164, 28.1%) for females.
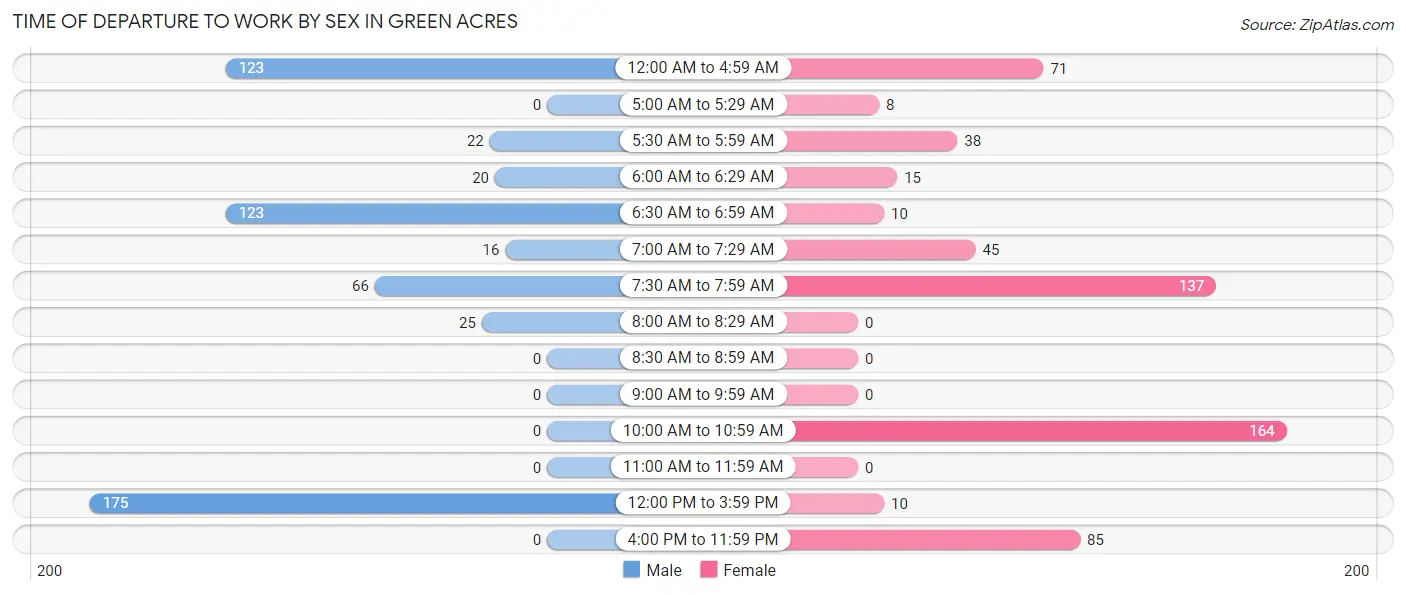
| Time of Departure | Male | Female |
| 12:00 AM to 4:59 AM | 123 (21.6%) | 71 (12.2%) |
| 5:00 AM to 5:29 AM | 0 (0.0%) | 8 (1.4%) |
| 5:30 AM to 5:59 AM | 22 (3.9%) | 38 (6.5%) |
| 6:00 AM to 6:29 AM | 20 (3.5%) | 15 (2.6%) |
| 6:30 AM to 6:59 AM | 123 (21.6%) | 10 (1.7%) |
| 7:00 AM to 7:29 AM | 16 (2.8%) | 45 (7.7%) |
| 7:30 AM to 7:59 AM | 66 (11.6%) | 137 (23.5%) |
| 8:00 AM to 8:29 AM | 25 (4.4%) | 0 (0.0%) |
| 8:30 AM to 8:59 AM | 0 (0.0%) | 0 (0.0%) |
| 9:00 AM to 9:59 AM | 0 (0.0%) | 0 (0.0%) |
| 10:00 AM to 10:59 AM | 0 (0.0%) | 164 (28.1%) |
| 11:00 AM to 11:59 AM | 0 (0.0%) | 0 (0.0%) |
| 12:00 PM to 3:59 PM | 175 (30.7%) | 10 (1.7%) |
| 4:00 PM to 11:59 PM | 0 (0.0%) | 85 (14.6%) |
| Total | 570 (100.0%) | 583 (100.0%) |
Housing Occupancy in Green Acres
Occupancy by Ownership in Green Acres
Of the total 803 dwellings in Green Acres, owner-occupied units account for 675 (84.1%), while renter-occupied units make up 128 (15.9%).
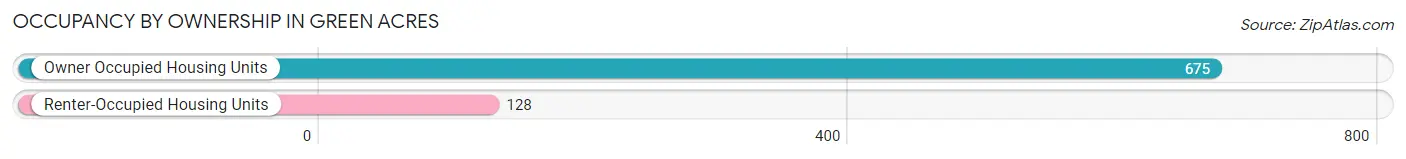
| Occupancy | # Housing Units | % Housing Units |
| Owner Occupied Housing Units | 675 | 84.1% |
| Renter-Occupied Housing Units | 128 | 15.9% |
| Total Occupied Housing Units | 803 | 100.0% |
Occupancy by Household Size in Green Acres
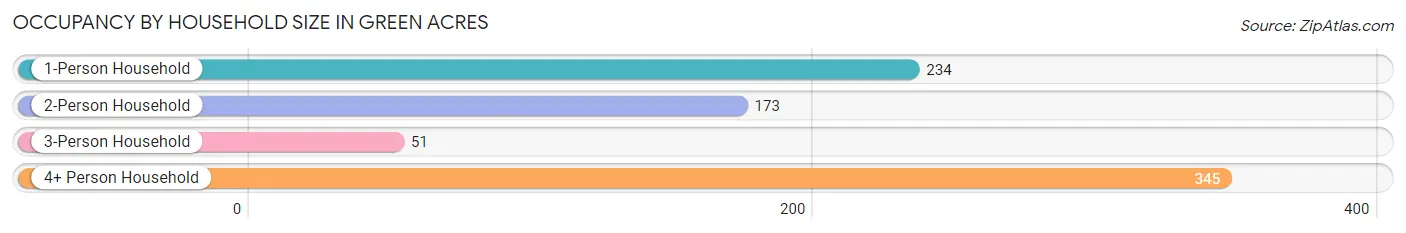
| Household Size | # Housing Units | % Housing Units |
| 1-Person Household | 234 | 29.1% |
| 2-Person Household | 173 | 21.5% |
| 3-Person Household | 51 | 6.4% |
| 4+ Person Household | 345 | 43.0% |
| Total Housing Units | 803 | 100.0% |
Occupancy by Ownership by Household Size in Green Acres
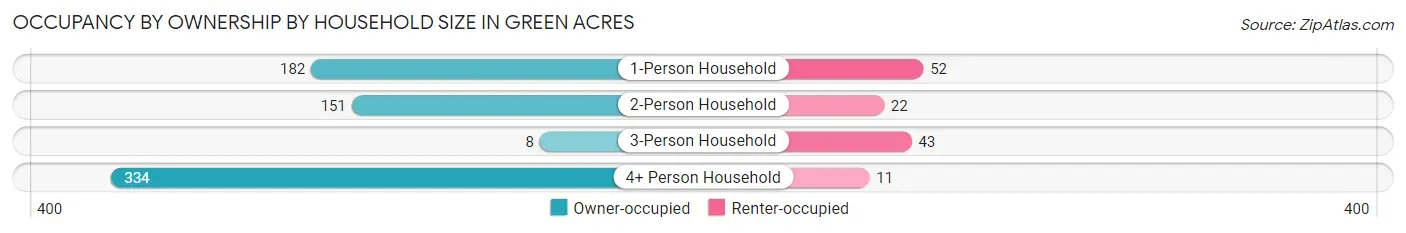
| Household Size | Owner-occupied | Renter-occupied |
| 1-Person Household | 182 (77.8%) | 52 (22.2%) |
| 2-Person Household | 151 (87.3%) | 22 (12.7%) |
| 3-Person Household | 8 (15.7%) | 43 (84.3%) |
| 4+ Person Household | 334 (96.8%) | 11 (3.2%) |
| Total Housing Units | 675 (84.1%) | 128 (15.9%) |
Occupancy by Educational Attainment in Green Acres
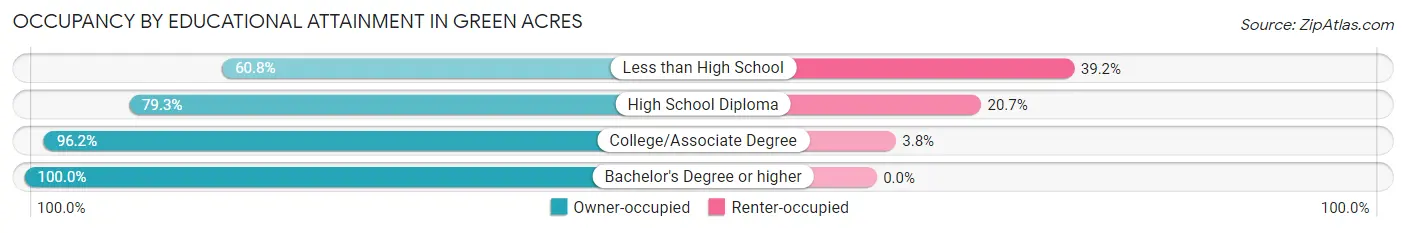
| Household Size | Owner-occupied | Renter-occupied |
| Less than High School | 90 (60.8%) | 58 (39.2%) |
| High School Diploma | 226 (79.3%) | 59 (20.7%) |
| College/Associate Degree | 278 (96.2%) | 11 (3.8%) |
| Bachelor's Degree or higher | 81 (100.0%) | 0 (0.0%) |
Occupancy by Age of Householder in Green Acres
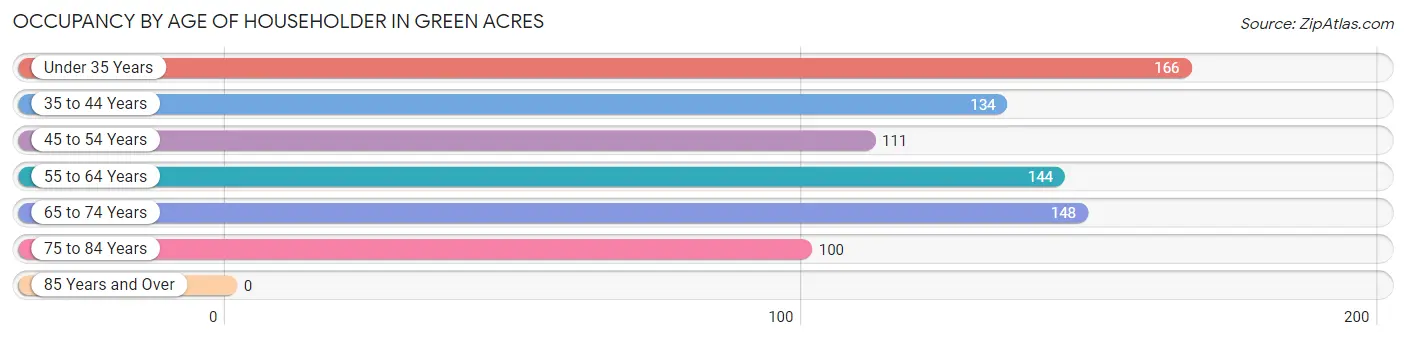
| Age Bracket | # Households | % Households |
| Under 35 Years | 166 | 20.7% |
| 35 to 44 Years | 134 | 16.7% |
| 45 to 54 Years | 111 | 13.8% |
| 55 to 64 Years | 144 | 17.9% |
| 65 to 74 Years | 148 | 18.4% |
| 75 to 84 Years | 100 | 12.4% |
| 85 Years and Over | 0 | 0.0% |
| Total | 803 | 100.0% |
Housing Finances in Green Acres
Median Income by Occupancy in Green Acres
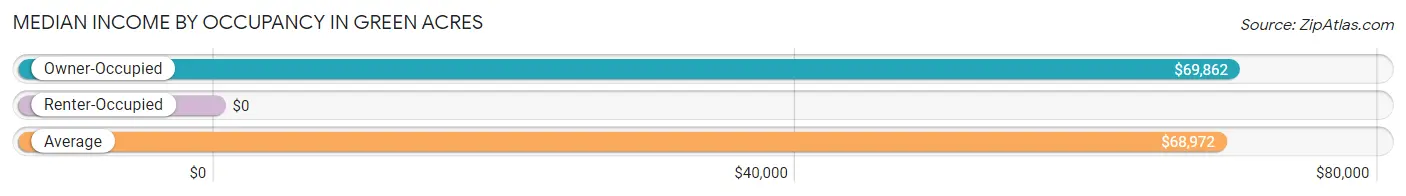
| Occupancy Type | # Households | Median Income |
| Owner-Occupied | 675 (84.1%) | $69,862 |
| Renter-Occupied | 128 (15.9%) | $0 |
| Average | 803 (100.0%) | $68,972 |
Occupancy by Householder Income Bracket in Green Acres
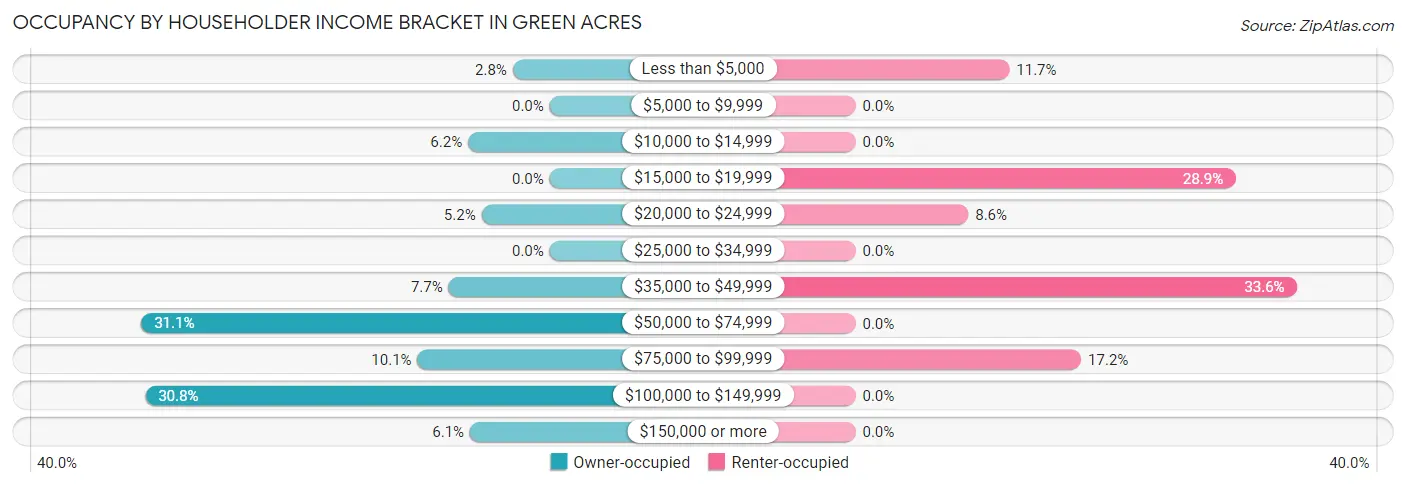
| Income Bracket | Owner-occupied | Renter-occupied |
| Less than $5,000 | 19 (2.8%) | 15 (11.7%) |
| $5,000 to $9,999 | 0 (0.0%) | 0 (0.0%) |
| $10,000 to $14,999 | 42 (6.2%) | 0 (0.0%) |
| $15,000 to $19,999 | 0 (0.0%) | 37 (28.9%) |
| $20,000 to $24,999 | 35 (5.2%) | 11 (8.6%) |
| $25,000 to $34,999 | 0 (0.0%) | 0 (0.0%) |
| $35,000 to $49,999 | 52 (7.7%) | 43 (33.6%) |
| $50,000 to $74,999 | 210 (31.1%) | 0 (0.0%) |
| $75,000 to $99,999 | 68 (10.1%) | 22 (17.2%) |
| $100,000 to $149,999 | 208 (30.8%) | 0 (0.0%) |
| $150,000 or more | 41 (6.1%) | 0 (0.0%) |
| Total | 675 (100.0%) | 128 (100.0%) |
Monthly Housing Cost Tiers in Green Acres
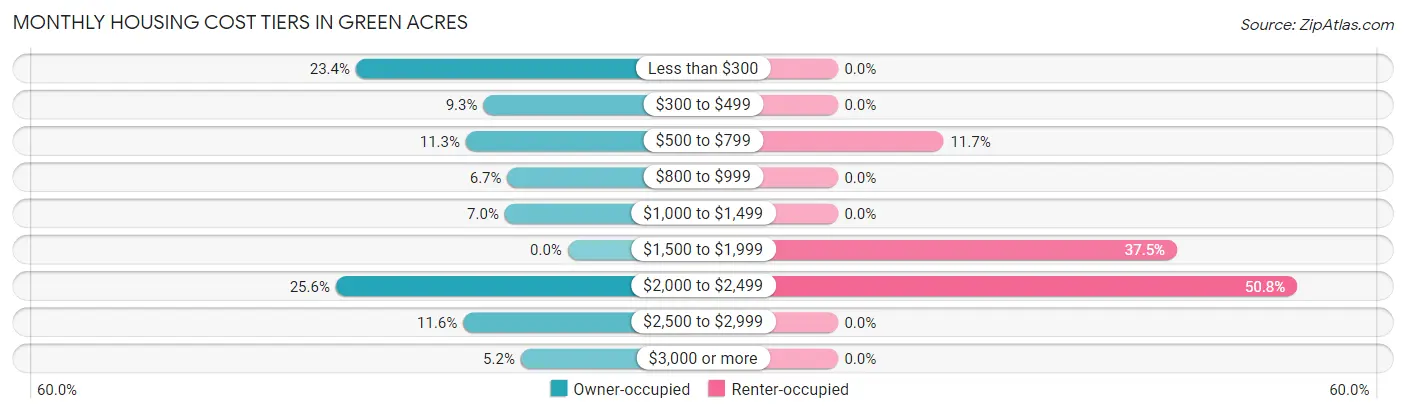
| Monthly Cost | Owner-occupied | Renter-occupied |
| Less than $300 | 158 (23.4%) | 0 (0.0%) |
| $300 to $499 | 63 (9.3%) | 0 (0.0%) |
| $500 to $799 | 76 (11.3%) | 15 (11.7%) |
| $800 to $999 | 45 (6.7%) | 0 (0.0%) |
| $1,000 to $1,499 | 47 (7.0%) | 0 (0.0%) |
| $1,500 to $1,999 | 0 (0.0%) | 48 (37.5%) |
| $2,000 to $2,499 | 173 (25.6%) | 65 (50.8%) |
| $2,500 to $2,999 | 78 (11.6%) | 0 (0.0%) |
| $3,000 or more | 35 (5.2%) | 0 (0.0%) |
| Total | 675 (100.0%) | 128 (100.0%) |
Physical Housing Characteristics in Green Acres
Housing Structures in Green Acres
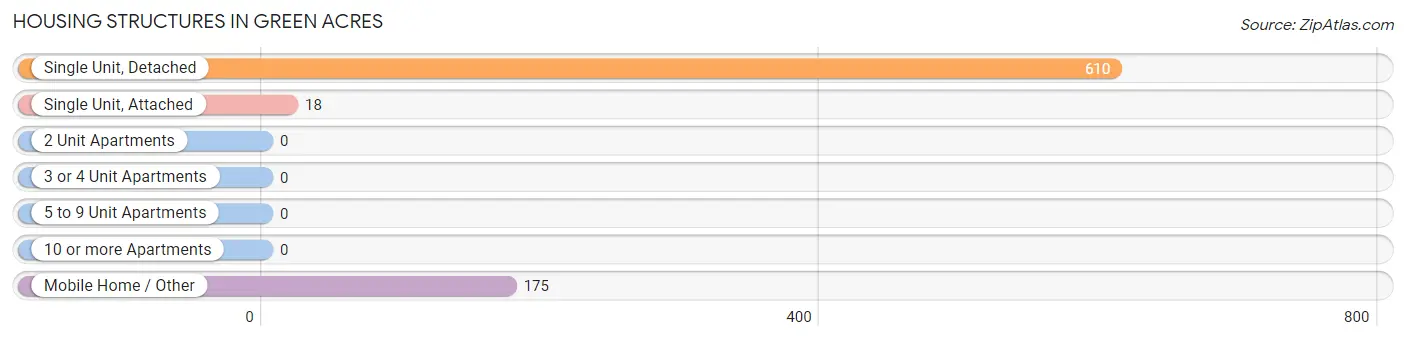
| Structure Type | # Housing Units | % Housing Units |
| Single Unit, Detached | 610 | 76.0% |
| Single Unit, Attached | 18 | 2.2% |
| 2 Unit Apartments | 0 | 0.0% |
| 3 or 4 Unit Apartments | 0 | 0.0% |
| 5 to 9 Unit Apartments | 0 | 0.0% |
| 10 or more Apartments | 0 | 0.0% |
| Mobile Home / Other | 175 | 21.8% |
| Total | 803 | 100.0% |
Housing Structures by Occupancy in Green Acres
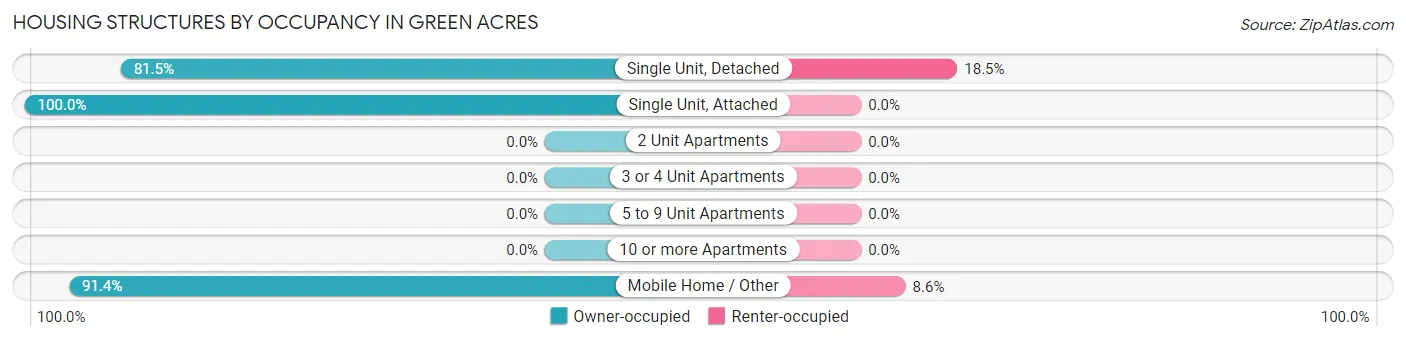
| Structure Type | Owner-occupied | Renter-occupied |
| Single Unit, Detached | 497 (81.5%) | 113 (18.5%) |
| Single Unit, Attached | 18 (100.0%) | 0 (0.0%) |
| 2 Unit Apartments | 0 (0.0%) | 0 (0.0%) |
| 3 or 4 Unit Apartments | 0 (0.0%) | 0 (0.0%) |
| 5 to 9 Unit Apartments | 0 (0.0%) | 0 (0.0%) |
| 10 or more Apartments | 0 (0.0%) | 0 (0.0%) |
| Mobile Home / Other | 160 (91.4%) | 15 (8.6%) |
| Total | 675 (84.1%) | 128 (15.9%) |
Housing Structures by Number of Rooms in Green Acres
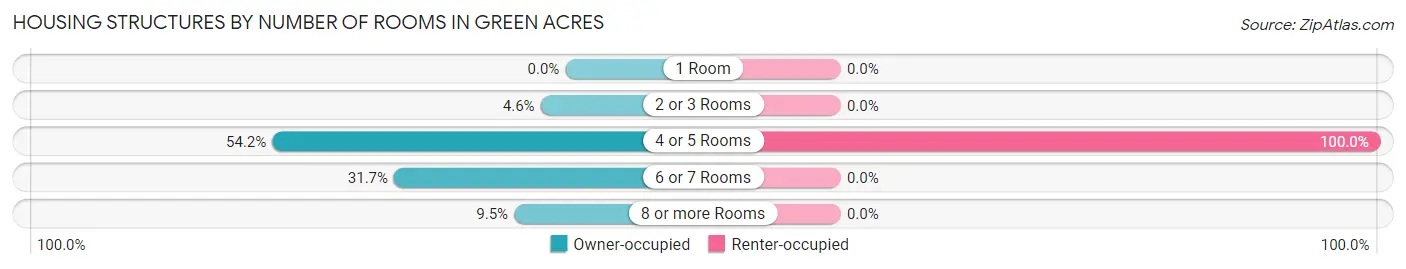
| Number of Rooms | Owner-occupied | Renter-occupied |
| 1 Room | 0 (0.0%) | 0 (0.0%) |
| 2 or 3 Rooms | 31 (4.6%) | 0 (0.0%) |
| 4 or 5 Rooms | 366 (54.2%) | 128 (100.0%) |
| 6 or 7 Rooms | 214 (31.7%) | 0 (0.0%) |
| 8 or more Rooms | 64 (9.5%) | 0 (0.0%) |
| Total | 675 (100.0%) | 128 (100.0%) |
Housing Structure by Heating Type in Green Acres
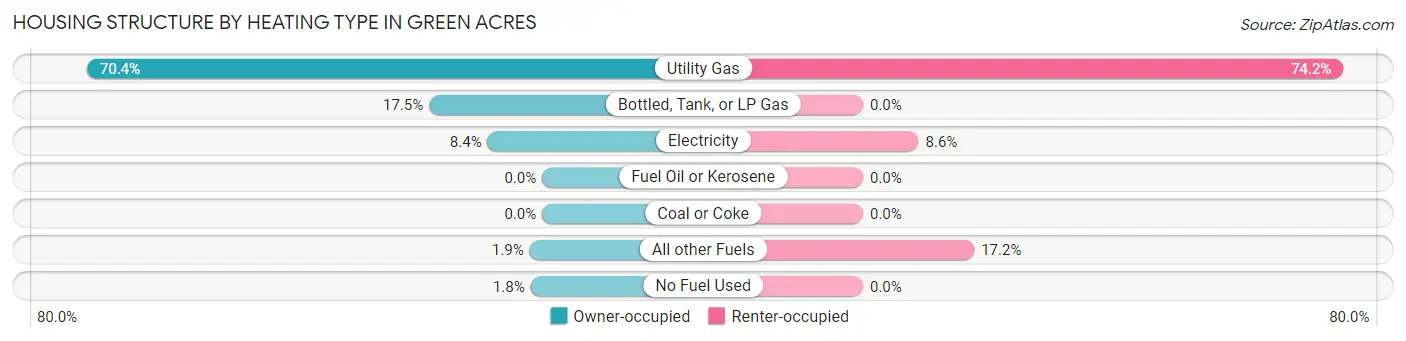
| Heating Type | Owner-occupied | Renter-occupied |
| Utility Gas | 475 (70.4%) | 95 (74.2%) |
| Bottled, Tank, or LP Gas | 118 (17.5%) | 0 (0.0%) |
| Electricity | 57 (8.4%) | 11 (8.6%) |
| Fuel Oil or Kerosene | 0 (0.0%) | 0 (0.0%) |
| Coal or Coke | 0 (0.0%) | 0 (0.0%) |
| All other Fuels | 13 (1.9%) | 22 (17.2%) |
| No Fuel Used | 12 (1.8%) | 0 (0.0%) |
| Total | 675 (100.0%) | 128 (100.0%) |
Household Vehicle Usage in Green Acres
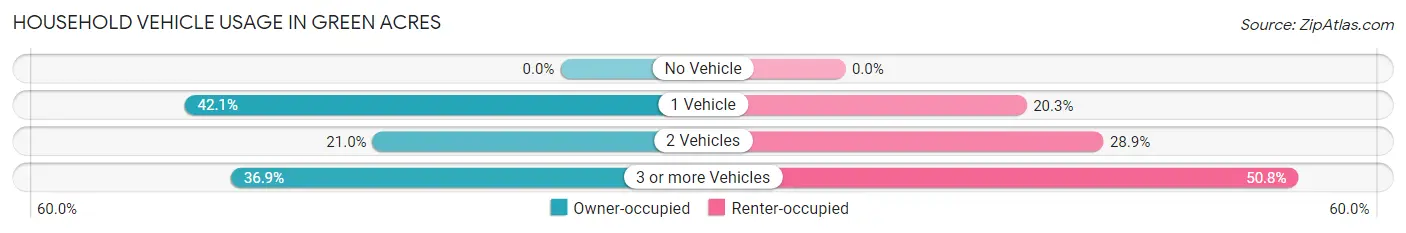
| Vehicles per Household | Owner-occupied | Renter-occupied |
| No Vehicle | 0 (0.0%) | 0 (0.0%) |
| 1 Vehicle | 284 (42.1%) | 26 (20.3%) |
| 2 Vehicles | 142 (21.0%) | 37 (28.9%) |
| 3 or more Vehicles | 249 (36.9%) | 65 (50.8%) |
| Total | 675 (100.0%) | 128 (100.0%) |
Real Estate & Mortgages in Green Acres
Real Estate and Mortgage Overview in Green Acres
| Characteristic | Without Mortgage | With Mortgage |
| Housing Units | 285 | 390 |
| Median Property Value | - | - |
| Median Household Income | $68,125 | $25 |
| Monthly Housing Costs | - | - |
| Real Estate Taxes | - | - |
Property Value by Mortgage Status in Green Acres
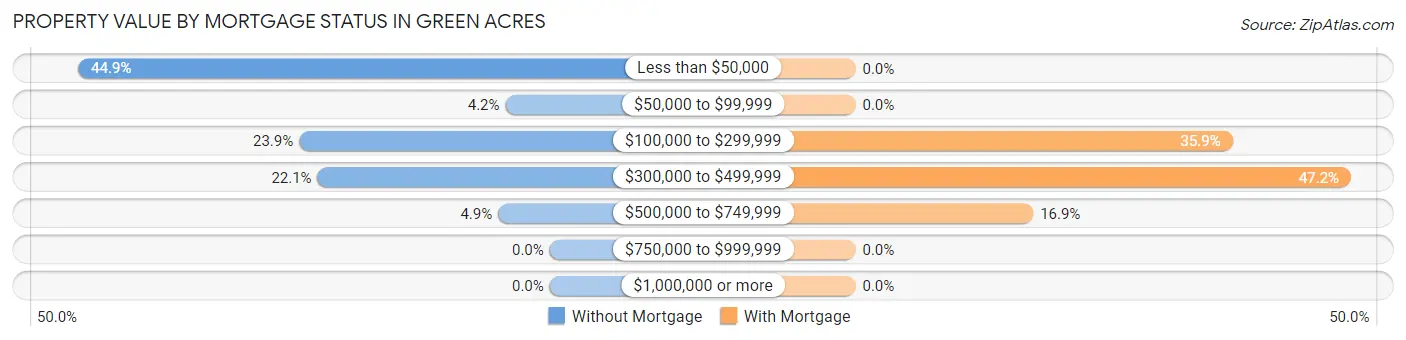
| Property Value | Without Mortgage | With Mortgage |
| Less than $50,000 | 128 (44.9%) | 0 (0.0%) |
| $50,000 to $99,999 | 12 (4.2%) | 0 (0.0%) |
| $100,000 to $299,999 | 68 (23.9%) | 140 (35.9%) |
| $300,000 to $499,999 | 63 (22.1%) | 184 (47.2%) |
| $500,000 to $749,999 | 14 (4.9%) | 66 (16.9%) |
| $750,000 to $999,999 | 0 (0.0%) | 0 (0.0%) |
| $1,000,000 or more | 0 (0.0%) | 0 (0.0%) |
| Total | 285 (100.0%) | 390 (100.0%) |
Household Income by Mortgage Status in Green Acres
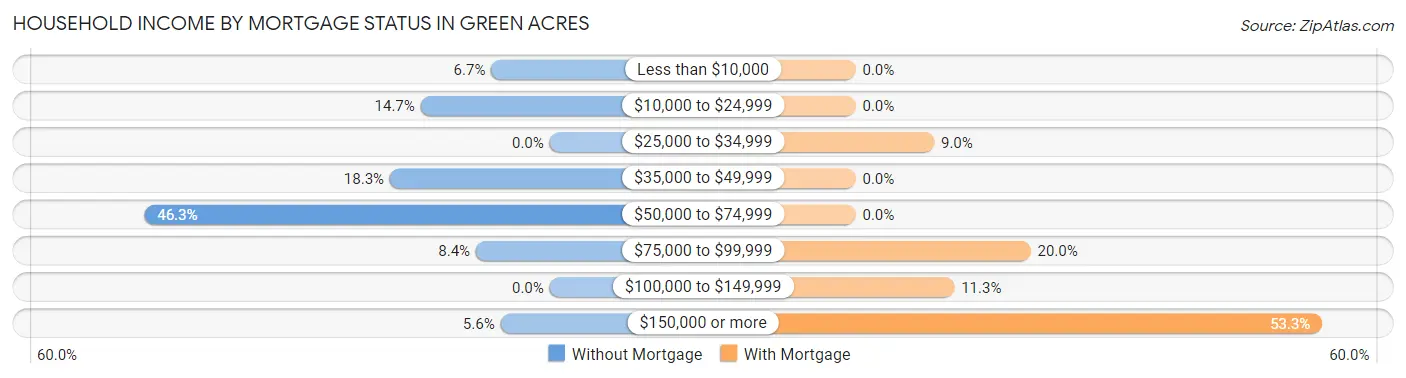
| Household Income | Without Mortgage | With Mortgage |
| Less than $10,000 | 19 (6.7%) | 0 (0.0%) |
| $10,000 to $24,999 | 42 (14.7%) | 0 (0.0%) |
| $25,000 to $34,999 | 0 (0.0%) | 35 (9.0%) |
| $35,000 to $49,999 | 52 (18.2%) | 0 (0.0%) |
| $50,000 to $74,999 | 132 (46.3%) | 0 (0.0%) |
| $75,000 to $99,999 | 24 (8.4%) | 78 (20.0%) |
| $100,000 to $149,999 | 0 (0.0%) | 44 (11.3%) |
| $150,000 or more | 16 (5.6%) | 208 (53.3%) |
| Total | 285 (100.0%) | 390 (100.0%) |
Property Value to Household Income Ratio in Green Acres
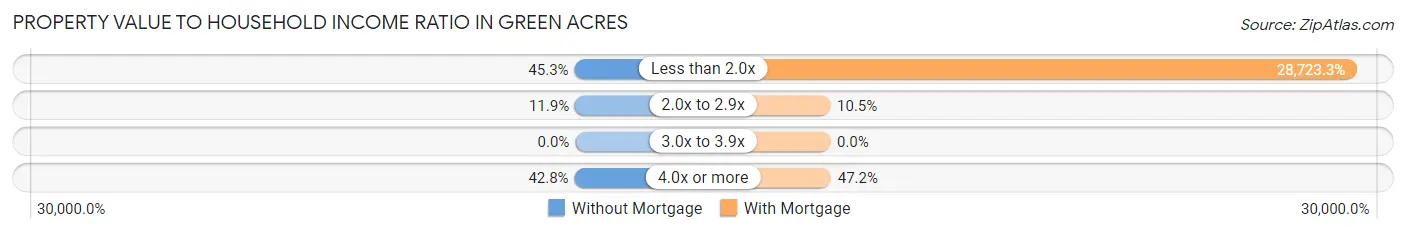
| Value-to-Income Ratio | Without Mortgage | With Mortgage |
| Less than 2.0x | 129 (45.3%) | 112,021 (28,723.3%) |
| 2.0x to 2.9x | 34 (11.9%) | 41 (10.5%) |
| 3.0x to 3.9x | 0 (0.0%) | 0 (0.0%) |
| 4.0x or more | 122 (42.8%) | 184 (47.2%) |
| Total | 285 (100.0%) | 390 (100.0%) |
Real Estate Taxes by Mortgage Status in Green Acres
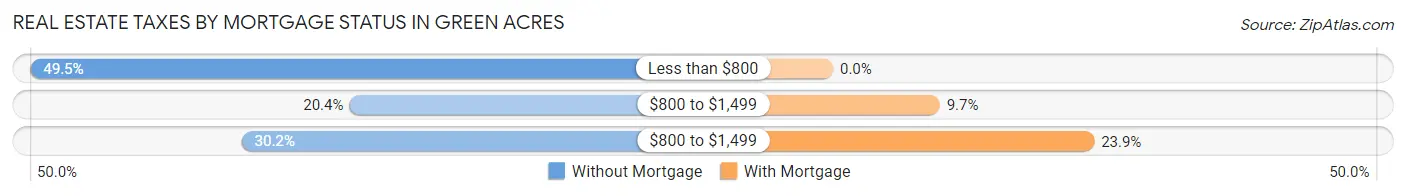
| Property Taxes | Without Mortgage | With Mortgage |
| Less than $800 | 141 (49.5%) | 0 (0.0%) |
| $800 to $1,499 | 58 (20.3%) | 38 (9.7%) |
| $800 to $1,499 | 86 (30.2%) | 93 (23.8%) |
| Total | 285 (100.0%) | 390 (100.0%) |
Health & Disability in Green Acres
Health Insurance Coverage by Age in Green Acres
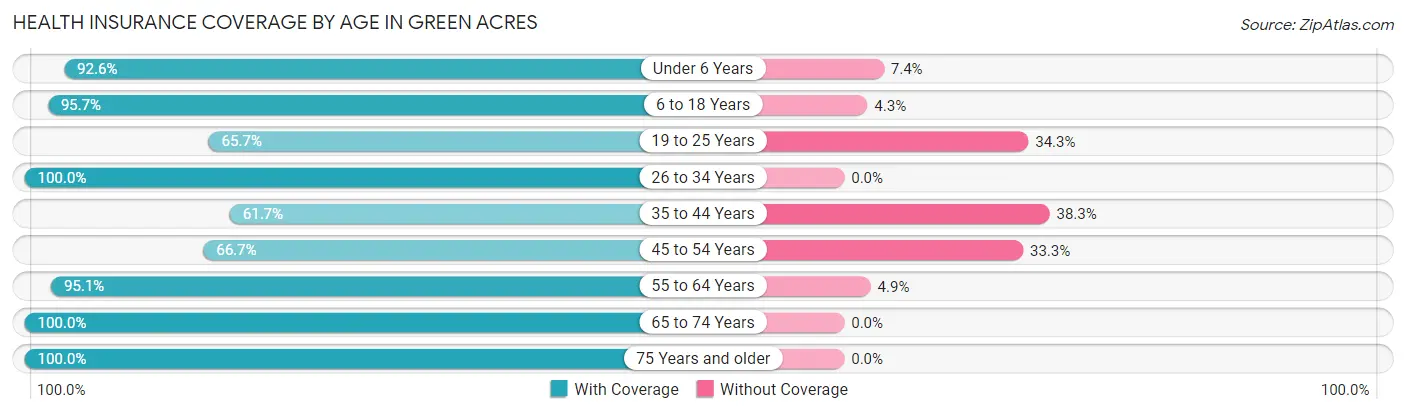
| Age Bracket | With Coverage | Without Coverage |
| Under 6 Years | 439 (92.6%) | 35 (7.4%) |
| 6 to 18 Years | 466 (95.7%) | 21 (4.3%) |
| 19 to 25 Years | 224 (65.7%) | 117 (34.3%) |
| 26 to 34 Years | 429 (100.0%) | 0 (0.0%) |
| 35 to 44 Years | 129 (61.7%) | 80 (38.3%) |
| 45 to 54 Years | 238 (66.7%) | 119 (33.3%) |
| 55 to 64 Years | 406 (95.1%) | 21 (4.9%) |
| 65 to 74 Years | 163 (100.0%) | 0 (0.0%) |
| 75 Years and older | 130 (100.0%) | 0 (0.0%) |
| Total | 2,624 (87.0%) | 393 (13.0%) |
Health Insurance Coverage by Citizenship Status in Green Acres
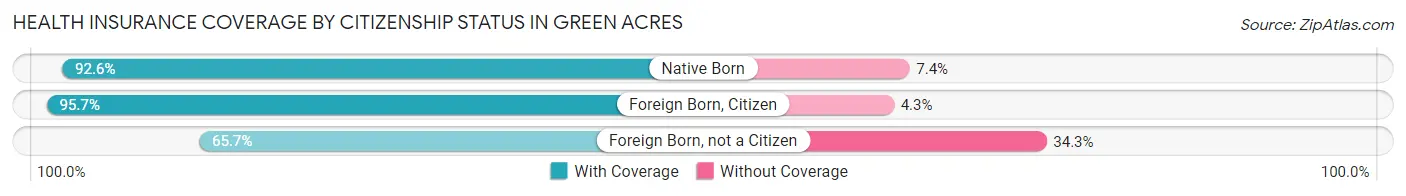
| Citizenship Status | With Coverage | Without Coverage |
| Native Born | 439 (92.6%) | 35 (7.4%) |
| Foreign Born, Citizen | 466 (95.7%) | 21 (4.3%) |
| Foreign Born, not a Citizen | 224 (65.7%) | 117 (34.3%) |
Health Insurance Coverage by Household Income in Green Acres
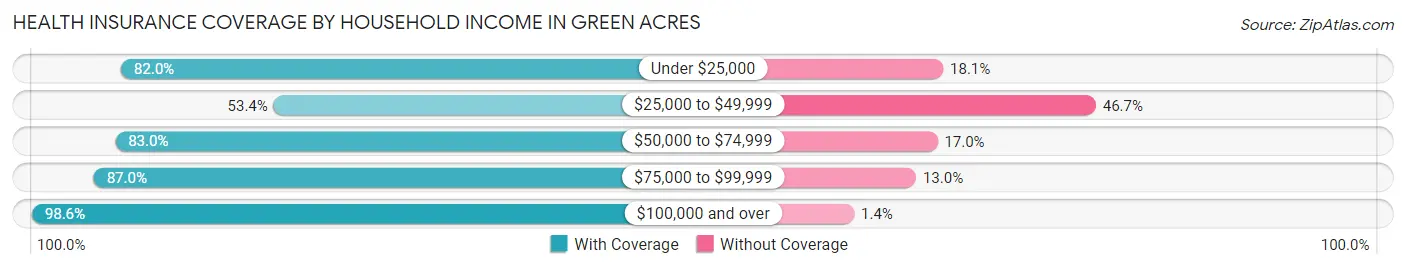
| Household Income | With Coverage | Without Coverage |
| Under $25,000 | 168 (82.0%) | 37 (18.0%) |
| $25,000 to $49,999 | 223 (53.3%) | 195 (46.7%) |
| $50,000 to $74,999 | 582 (83.0%) | 119 (17.0%) |
| $75,000 to $99,999 | 141 (87.0%) | 21 (13.0%) |
| $100,000 and over | 1,510 (98.6%) | 21 (1.4%) |
Public vs Private Health Insurance Coverage by Age in Green Acres
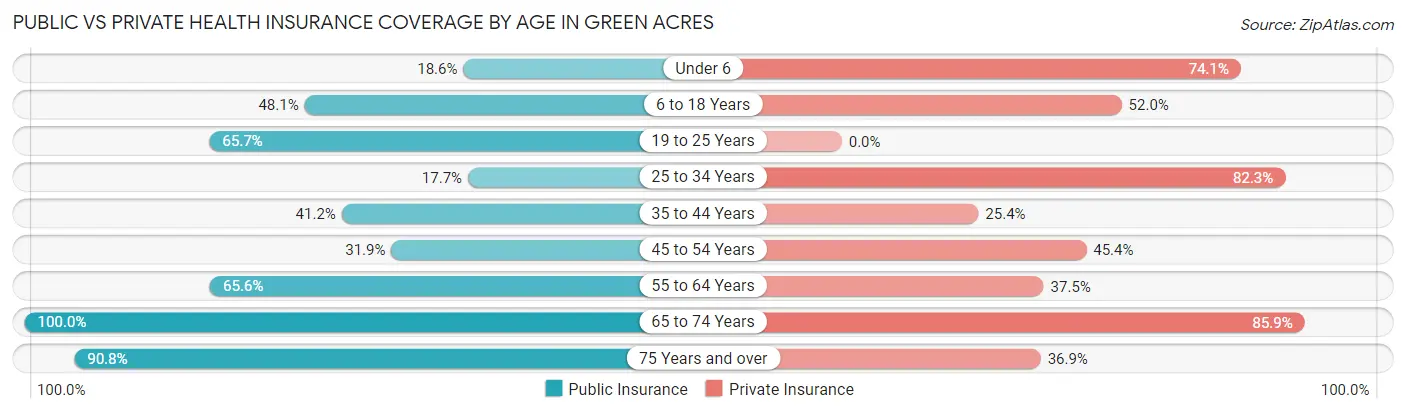
| Age Bracket | Public Insurance | Private Insurance |
| Under 6 | 88 (18.6%) | 351 (74.1%) |
| 6 to 18 Years | 234 (48.0%) | 253 (51.9%) |
| 19 to 25 Years | 224 (65.7%) | 0 (0.0%) |
| 25 to 34 Years | 76 (17.7%) | 353 (82.3%) |
| 35 to 44 Years | 86 (41.1%) | 53 (25.4%) |
| 45 to 54 Years | 114 (31.9%) | 162 (45.4%) |
| 55 to 64 Years | 280 (65.6%) | 160 (37.5%) |
| 65 to 74 Years | 163 (100.0%) | 140 (85.9%) |
| 75 Years and over | 118 (90.8%) | 48 (36.9%) |
| Total | 1,383 (45.8%) | 1,520 (50.4%) |
Disability Status by Sex by Age in Green Acres
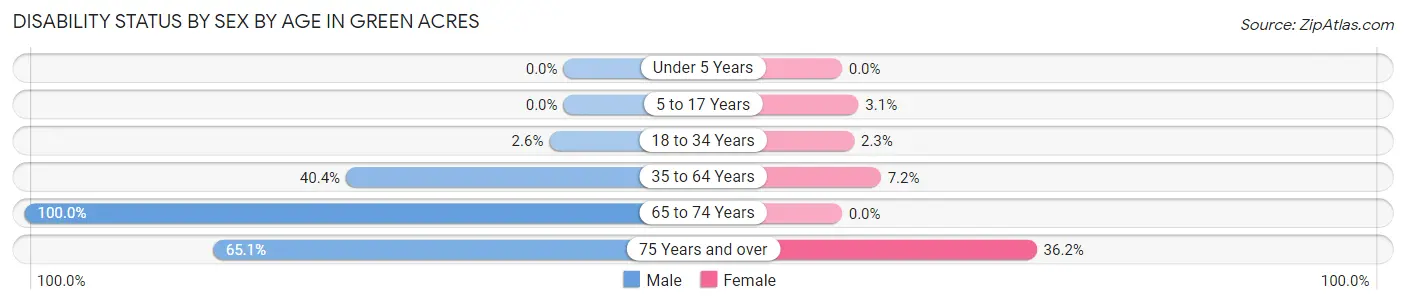
| Age Bracket | Male | Female |
| Under 5 Years | 0 (0.0%) | 0 (0.0%) |
| 5 to 17 Years | 0 (0.0%) | 14 (3.1%) |
| 18 to 34 Years | 8 (2.6%) | 11 (2.3%) |
| 35 to 64 Years | 155 (40.4%) | 44 (7.2%) |
| 65 to 74 Years | 2 (100.0%) | 0 (0.0%) |
| 75 Years and over | 54 (65.1%) | 17 (36.2%) |
Disability Class by Sex by Age in Green Acres
Disability Class: Hearing Difficulty
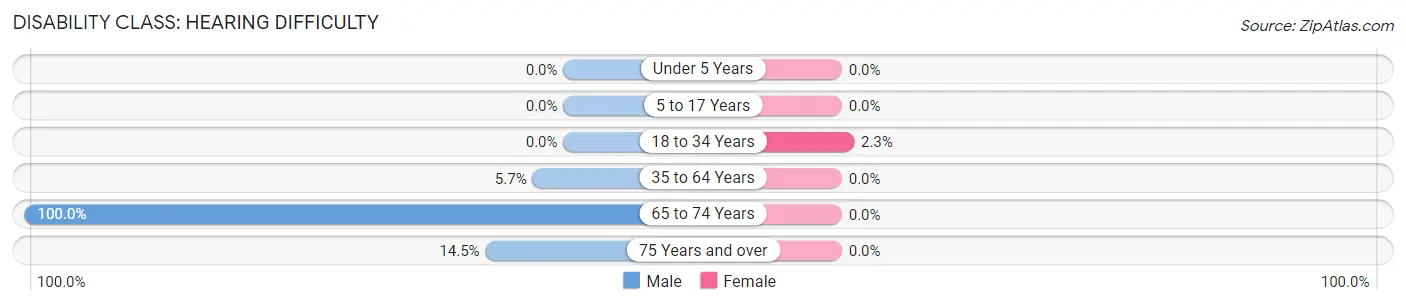
| Age Bracket | Male | Female |
| Under 5 Years | 0 (0.0%) | 0 (0.0%) |
| 5 to 17 Years | 0 (0.0%) | 0 (0.0%) |
| 18 to 34 Years | 0 (0.0%) | 11 (2.3%) |
| 35 to 64 Years | 22 (5.7%) | 0 (0.0%) |
| 65 to 74 Years | 2 (100.0%) | 0 (0.0%) |
| 75 Years and over | 12 (14.5%) | 0 (0.0%) |
Disability Class: Vision Difficulty
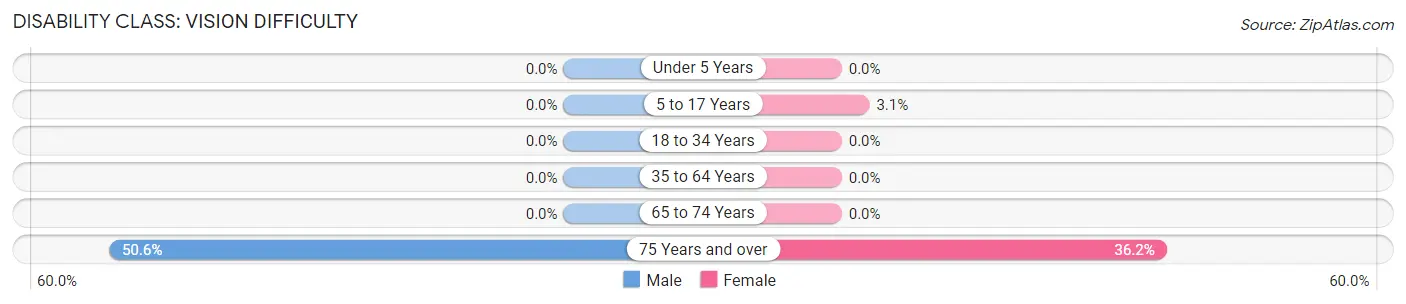
| Age Bracket | Male | Female |
| Under 5 Years | 0 (0.0%) | 0 (0.0%) |
| 5 to 17 Years | 0 (0.0%) | 14 (3.1%) |
| 18 to 34 Years | 0 (0.0%) | 0 (0.0%) |
| 35 to 64 Years | 0 (0.0%) | 0 (0.0%) |
| 65 to 74 Years | 0 (0.0%) | 0 (0.0%) |
| 75 Years and over | 42 (50.6%) | 17 (36.2%) |
Disability Class: Cognitive Difficulty
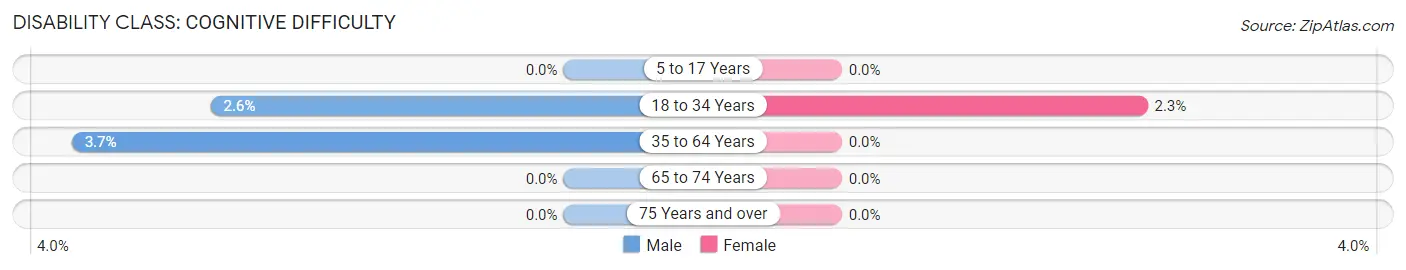
| Age Bracket | Male | Female |
| 5 to 17 Years | 0 (0.0%) | 0 (0.0%) |
| 18 to 34 Years | 8 (2.6%) | 11 (2.3%) |
| 35 to 64 Years | 14 (3.6%) | 0 (0.0%) |
| 65 to 74 Years | 0 (0.0%) | 0 (0.0%) |
| 75 Years and over | 0 (0.0%) | 0 (0.0%) |
Disability Class: Ambulatory Difficulty
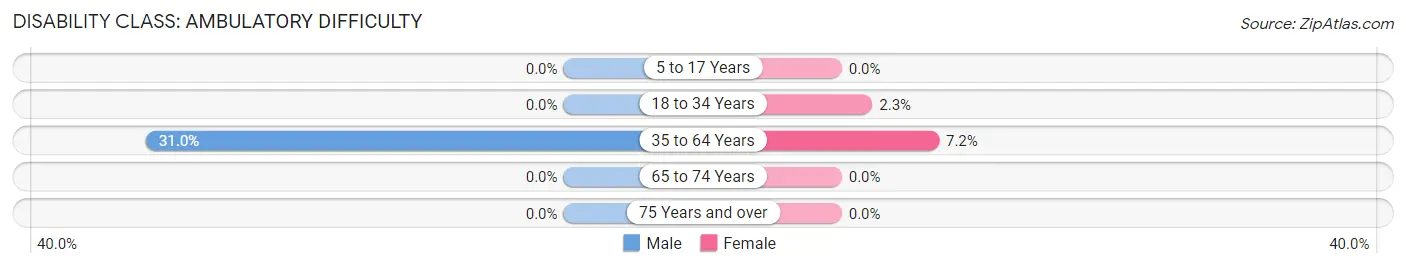
| Age Bracket | Male | Female |
| 5 to 17 Years | 0 (0.0%) | 0 (0.0%) |
| 18 to 34 Years | 0 (0.0%) | 11 (2.3%) |
| 35 to 64 Years | 119 (31.0%) | 44 (7.2%) |
| 65 to 74 Years | 0 (0.0%) | 0 (0.0%) |
| 75 Years and over | 0 (0.0%) | 0 (0.0%) |
Disability Class: Self-Care Difficulty
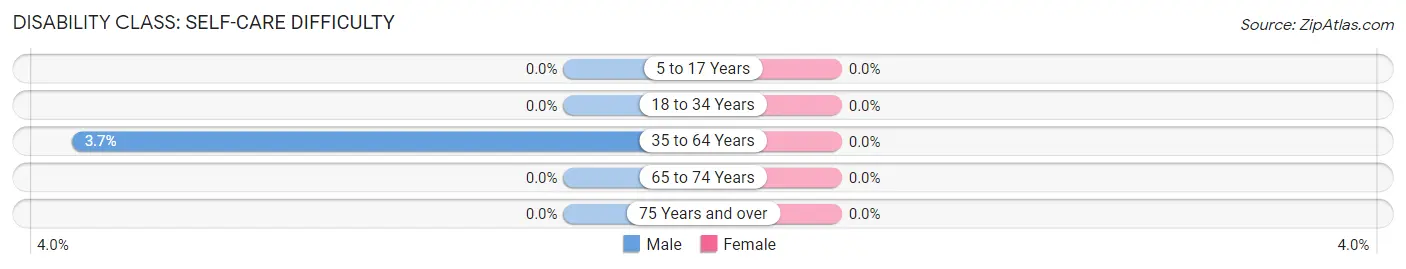
| Age Bracket | Male | Female |
| 5 to 17 Years | 0 (0.0%) | 0 (0.0%) |
| 18 to 34 Years | 0 (0.0%) | 0 (0.0%) |
| 35 to 64 Years | 14 (3.6%) | 0 (0.0%) |
| 65 to 74 Years | 0 (0.0%) | 0 (0.0%) |
| 75 Years and over | 0 (0.0%) | 0 (0.0%) |
Technology Access in Green Acres
Computing Device Access in Green Acres
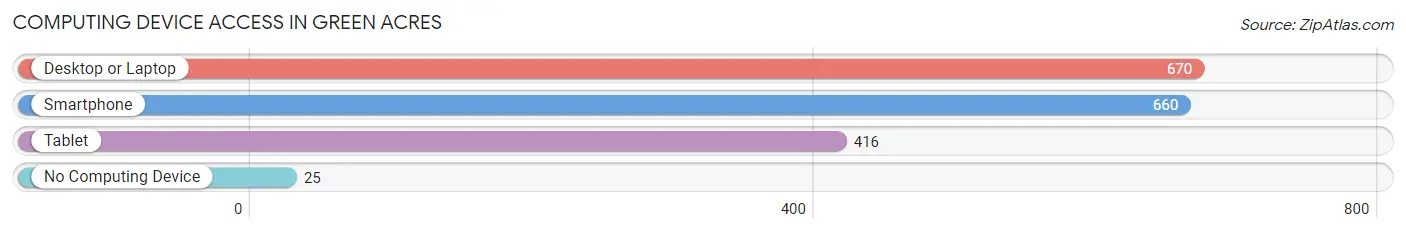
| Device Type | # Households | % Households |
| Desktop or Laptop | 670 | 83.4% |
| Smartphone | 660 | 82.2% |
| Tablet | 416 | 51.8% |
| No Computing Device | 25 | 3.1% |
| Total | 803 | 100.0% |
Internet Access in Green Acres
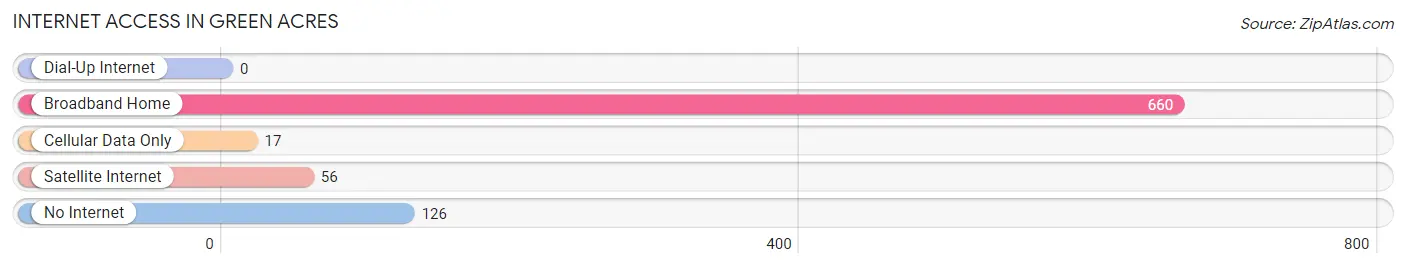
| Internet Type | # Households | % Households |
| Dial-Up Internet | 0 | 0.0% |
| Broadband Home | 660 | 82.2% |
| Cellular Data Only | 17 | 2.1% |
| Satellite Internet | 56 | 7.0% |
| No Internet | 126 | 15.7% |
| Total | 803 | 100.0% |
Green Acres Summary
Green Acres is a small, unincorporated community located in the San Joaquin Valley of California. It is situated in the foothills of the Sierra Nevada Mountains, approximately 30 miles east of Fresno. The community is home to a population of approximately 1,000 people, and is known for its rural atmosphere and agricultural production.
History
Green Acres was first settled in the late 1800s by a group of German immigrants. The settlers were attracted to the area due to its fertile soil and mild climate. The community was originally known as “Germantown”, but the name was changed to Green Acres in the early 1900s.
The community grew slowly over the years, and by the 1950s it had become a thriving agricultural center. The area was known for its production of citrus fruits, grapes, and other crops. In the 1960s, the community began to experience a population boom as more people moved to the area in search of employment opportunities.
Geography
Green Acres is located in the San Joaquin Valley of California, approximately 30 miles east of Fresno. The community is situated in the foothills of the Sierra Nevada Mountains, and is surrounded by rolling hills and farmland. The climate in the area is mild, with hot summers and cool winters.
Economy
Green Acres is primarily an agricultural community, and the local economy is heavily dependent on farming and ranching. The area is known for its production of citrus fruits, grapes, and other crops. In addition, the community is home to several small businesses, including restaurants, shops, and other services.
Demographics
As of the 2010 census, the population of Green Acres was 1,000. The racial makeup of the community was 75.2% White, 0.7% African American, 0.3% Native American, 0.2% Asian, 0.1% Pacific Islander, and 23.5% from other races. The median household income was $37,500, and the median age was 37.
Conclusion
Green Acres is a small, unincorporated community located in the San Joaquin Valley of California. It is known for its rural atmosphere and agricultural production, and is home to a population of approximately 1,000 people. The local economy is heavily dependent on farming and ranching, and the area is known for its production of citrus fruits, grapes, and other crops. The racial makeup of the community is diverse, and the median household income is $37,500.
Common Questions
What is Per Capita Income in Green Acres?
Per Capita income in Green Acres is $21,040.
What is the Median Family Income in Green Acres?
Median Family Income in Green Acres is $89,091.
What is the Median Household income in Green Acres?
Median Household Income in Green Acres is $68,972.
What is Inequality or Gini Index in Green Acres?
Inequality or Gini Index in Green Acres is 0.35.
What is the Total Population of Green Acres?
Total Population of Green Acres is 3,023.
What is the Total Male Population of Green Acres?
Total Male Population of Green Acres is 1,186.
What is the Total Female Population of Green Acres?
Total Female Population of Green Acres is 1,837.
What is the Ratio of Males per 100 Females in Green Acres?
There are 64.56 Males per 100 Females in Green Acres.
What is the Ratio of Females per 100 Males in Green Acres?
There are 154.89 Females per 100 Males in Green Acres.
What is the Median Population Age in Green Acres?
Median Population Age in Green Acres is 31.5 Years.
What is the Average Family Size in Green Acres
Average Family Size in Green Acres is 5.6 People.
What is the Average Household Size in Green Acres
Average Household Size in Green Acres is 3.8 People.
How Large is the Labor Force in Green Acres?
There are 1,436 People in the Labor Forcein in Green Acres.
What is the Percentage of People in the Labor Force in Green Acres?
66.1% of People are in the Labor Force in Green Acres.
What is the Unemployment Rate in Green Acres?
Unemployment Rate in Green Acres is 15.1%.