Cities with the Highest Percentage of Population with a Degree in Engineering in the United States
RELATED REPORTS & OPTIONS
Engineering
United States
Compare Cities
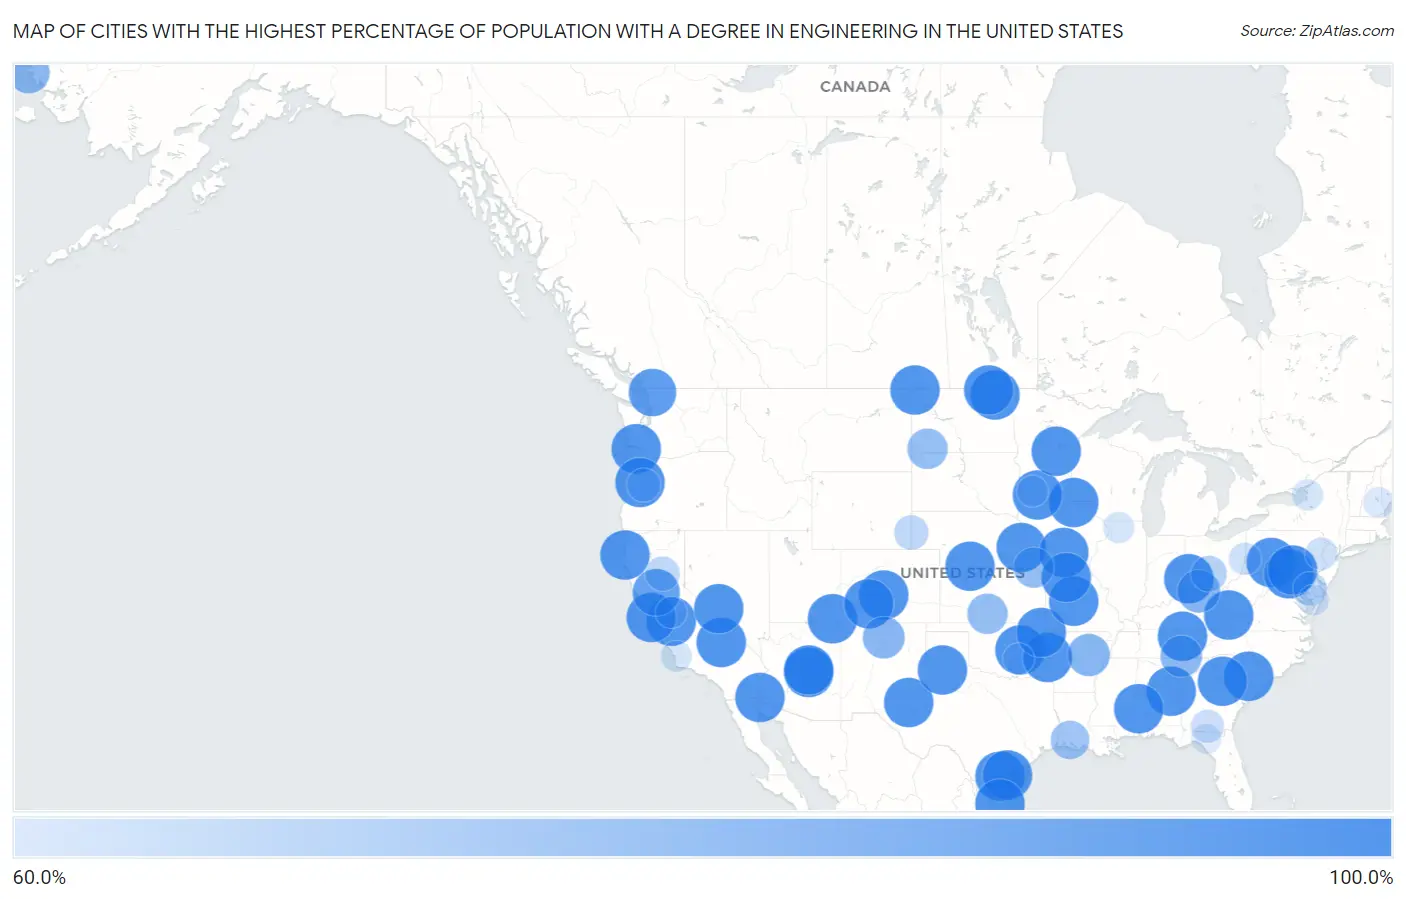
Map of Cities with the Highest Percentage of Population with a Degree in Engineering in the United States
0.0%
100.0%
Cities with the Highest Percentage of Population with a Degree in Engineering in the United States
| City | % Graduates | vs State | vs National | |
| 1. | Fairfield University | 100.0% | 7.4%(+92.6)#1 | 7.6%(+92.4)#1 |
| 2. | Livingston Wheeler | 100.0% | 7.6%(+92.4)#1 | 7.6%(+92.4)#2 |
| 3. | Williamsdale | 100.0% | 7.4%(+92.6)#1 | 7.6%(+92.4)#3 |
| 4. | Grimsley | 100.0% | 6.2%(+93.8)#1 | 7.6%(+92.4)#4 |
| 5. | Red Rock | 100.0% | 9.5%(+90.5)#1 | 7.6%(+92.4)#5 |
| 6. | Fields Landing | 100.0% | 9.9%(+90.1)#1 | 7.6%(+92.4)#6 |
| 7. | Pownal | 100.0% | 5.3%(+94.7)#1 | 7.6%(+92.4)#7 |
| 8. | Round Valley | 100.0% | 8.0%(+92.0)#1 | 7.6%(+92.4)#8 |
| 9. | Sandy Hollow Escondidas | 100.0% | 9.5%(+90.5)#2 | 7.6%(+92.4)#9 |
| 10. | Westport | 100.0% | 7.0%(+93.0)#1 | 7.6%(+92.4)#10 |
| 11. | St Michael | 100.0% | 6.7%(+93.3)#1 | 7.6%(+92.4)#11 |
| 12. | Tradewinds | 100.0% | 9.5%(+90.5)#3 | 7.6%(+92.4)#12 |
| 13. | Wall Lane | 100.0% | 8.0%(+92.0)#2 | 7.6%(+92.4)#13 |
| 14. | Reynoldsville | 100.0% | 5.0%(+95.0)#1 | 7.6%(+92.4)#14 |
| 15. | Volta | 100.0% | 9.9%(+90.1)#2 | 7.6%(+92.4)#15 |
| 16. | Adams Lake | 100.0% | 6.6%(+93.4)#1 | 7.6%(+92.4)#16 |
| 17. | Brimfield | 100.0% | 6.6%(+93.4)#2 | 7.6%(+92.4)#17 |
| 18. | Liberty Mills | 100.0% | 6.6%(+93.4)#3 | 7.6%(+92.4)#18 |
| 19. | Homewood Canyon | 100.0% | 9.9%(+90.1)#3 | 7.6%(+92.4)#19 |
| 20. | Silver Peak | 100.0% | 6.9%(+93.1)#1 | 7.6%(+92.4)#20 |
| 21. | Hypericum | 100.0% | 9.9%(+90.1)#4 | 7.6%(+92.4)#21 |
| 22. | Mulberry | 100.0% | 7.0%(+93.0)#1 | 7.6%(+92.4)#22 |
| 23. | Perkins | 100.0% | 5.6%(+94.4)#1 | 7.6%(+92.4)#23 |
| 24. | Osnabrock | 100.0% | 5.2%(+94.8)#1 | 7.6%(+92.4)#24 |
| 25. | Shedd | 100.0% | 7.0%(+93.0)#2 | 7.6%(+92.4)#25 |
| 26. | Castle | 100.0% | 5.4%(+94.6)#1 | 7.6%(+92.4)#26 |
| 27. | Billtown | 100.0% | 6.6%(+93.4)#4 | 7.6%(+92.4)#27 |
| 28. | Ratamosa | 100.0% | 9.5%(+90.5)#4 | 7.6%(+92.4)#28 |
| 29. | Freedom Acres | 100.0% | 8.0%(+92.0)#3 | 7.6%(+92.4)#29 |
| 30. | Monroe | 100.0% | 5.4%(+94.6)#2 | 7.6%(+92.4)#30 |
| 31. | Drowning Creek | 100.0% | 5.4%(+94.6)#3 | 7.6%(+92.4)#31 |
| 32. | Roderfield | 100.0% | 5.0%(+95.0)#2 | 7.6%(+92.4)#32 |
| 33. | Greensburg | 100.0% | 7.7%(+92.3)#1 | 7.6%(+92.4)#33 |
| 34. | Edmonson | 100.0% | 9.5%(+90.5)#5 | 7.6%(+92.4)#34 |
| 35. | Colcord | 100.0% | 5.0%(+95.0)#3 | 7.6%(+92.4)#35 |
| 36. | Loma Mar | 100.0% | 9.9%(+90.1)#5 | 7.6%(+92.4)#36 |
| 37. | Bergland | 100.0% | 10.0%(+90.0)#1 | 7.6%(+92.4)#37 |
| 38. | Smeltertown | 100.0% | 8.3%(+91.7)#1 | 7.6%(+92.4)#38 |
| 39. | Table Rock | 100.0% | 6.7%(+93.3)#2 | 7.6%(+92.4)#39 |
| 40. | Mcintire | 100.0% | 5.6%(+94.4)#1 | 7.6%(+92.4)#40 |
| 41. | Wann | 100.0% | 4.2%(+95.8)#1 | 7.6%(+92.4)#41 |
| 42. | Tselakai Dezza | 100.0% | 6.8%(+93.2)#1 | 7.6%(+92.4)#42 |
| 43. | Goldville | 100.0% | 7.7%(+92.3)#1 | 7.6%(+92.4)#43 |
| 44. | Clarks Hill | 100.0% | 7.0%(+93.0)#2 | 7.6%(+92.4)#44 |
| 45. | Naubinway | 100.0% | 10.0%(+90.0)#2 | 7.6%(+92.4)#45 |
| 46. | Bagnell | 100.0% | 5.6%(+94.4)#2 | 7.6%(+92.4)#46 |
| 47. | Putnam | 100.0% | 7.7%(+92.3)#2 | 7.6%(+92.4)#47 |
| 48. | Canyon Creek | 100.0% | 5.5%(+94.5)#1 | 7.6%(+92.4)#48 |
| 49. | New Lisbon | 100.0% | 6.6%(+93.4)#5 | 7.6%(+92.4)#49 |
| 50. | Fortuna | 100.0% | 5.2%(+94.8)#2 | 7.6%(+92.4)#50 |
| 51. | Canoe Creek | 100.0% | 6.7%(+93.3)#3 | 7.6%(+92.4)#51 |
| 52. | Bolivar | 100.0% | 4.7%(+95.3)#1 | 7.6%(+92.4)#52 |
| 53. | Wilder | 100.0% | 6.3%(+93.7)#1 | 7.6%(+92.4)#53 |
| 54. | Millerton | 100.0% | 5.6%(+94.4)#2 | 7.6%(+92.4)#54 |
| 55. | Hendley | 100.0% | 4.2%(+95.8)#2 | 7.6%(+92.4)#55 |
| 56. | Hillman | 100.0% | 6.3%(+93.7)#2 | 7.6%(+92.4)#56 |
| 57. | Cathedral | 100.0% | 8.3%(+91.7)#2 | 7.6%(+92.4)#57 |
| 58. | Triplett | 100.0% | 5.6%(+94.4)#3 | 7.6%(+92.4)#58 |
| 59. | Wales | 100.0% | 5.2%(+94.8)#3 | 7.6%(+92.4)#59 |
| 60. | Deming | 96.4% | 9.8%(+86.5)#1 | 7.6%(+88.7)#60 |
| 61. | Madison | 95.7% | 9.9%(+85.7)#6 | 7.6%(+88.0)#61 |
| 62. | Dover | 87.5% | 5.5%(+82.0)#1 | 7.6%(+79.9)#62 |
| 63. | West Point | 86.7% | 4.7%(+82.0)#1 | 7.6%(+79.0)#63 |
| 64. | Canova | 86.1% | 7.6%(+78.5)#2 | 7.6%(+78.4)#64 |
| 65. | Hooper Bay | 85.7% | 7.2%(+78.5)#1 | 7.6%(+78.1)#65 |
| 66. | Ooltewah | 85.4% | 6.2%(+79.2)#2 | 7.6%(+77.8)#66 |
| 67. | Solsberry | 84.4% | 6.6%(+77.8)#6 | 7.6%(+76.8)#67 |
| 68. | Rulo | 83.3% | 4.2%(+79.1)#3 | 7.6%(+75.7)#68 |
| 69. | Sawyer | 83.3% | 5.8%(+77.5)#1 | 7.6%(+75.7)#69 |
| 70. | Reeder | 83.3% | 5.2%(+78.1)#4 | 7.6%(+75.7)#70 |
| 71. | John Sevier | 82.4% | 6.2%(+76.2)#3 | 7.6%(+74.7)#71 |
| 72. | Eagle Creek | 81.2% | 6.7%(+74.5)#4 | 7.6%(+73.6)#72 |
| 73. | Cambria | 81.0% | 10.0%(+70.9)#3 | 7.6%(+73.3)#73 |
| 74. | Hayes | 80.0% | 6.2%(+73.8)#1 | 7.6%(+72.4)#74 |
| 75. | Oak Ridge Town Cooke County | 80.0% | 9.5%(+70.5)#6 | 7.6%(+72.4)#75 |
| 76. | Darbyville | 75.0% | 7.4%(+67.6)#2 | 7.6%(+67.4)#76 |
| 77. | Lyman | 72.7% | 4.2%(+68.5)#4 | 7.6%(+65.1)#77 |
| 78. | Yankee Hill | 72.7% | 9.9%(+62.8)#7 | 7.6%(+65.1)#78 |
| 79. | Villa Hugo I | 71.6% | 5.1%(+66.5)#1 | 7.6%(+63.9)#79 |
| 80. | Cordova | 71.1% | 7.7%(+63.4)#2 | 7.6%(+63.4)#80 |
| 81. | Crawfordsville | 70.7% | 7.0%(+63.7)#3 | 7.6%(+63.1)#81 |
| 82. | Dodgeville | 70.0% | 10.0%(+60.0)#4 | 7.6%(+62.4)#82 |
| 83. | Moody Afb | 69.7% | 7.1%(+62.6)#1 | 7.6%(+62.0)#83 |
| 84. | Martins Creek | 68.8% | 6.7%(+62.0)#5 | 7.6%(+61.1)#84 |
| 85. | Stratton | 68.4% | 7.4%(+61.0)#3 | 7.6%(+60.8)#85 |
| 86. | Bastian | 68.2% | 7.9%(+60.2)#1 | 7.6%(+60.5)#86 |
| 87. | Parklawn | 66.7% | 9.9%(+56.7)#8 | 7.6%(+59.0)#87 |
| 88. | Helmsburg | 66.7% | 6.6%(+60.0)#7 | 7.6%(+59.0)#88 |
| 89. | Canadian Shores | 66.7% | 5.4%(+61.2)#4 | 7.6%(+59.0)#89 |
| 90. | Henderson | 66.7% | 5.6%(+61.0)#1 | 7.6%(+59.0)#90 |
| 91. | Groverton | 66.7% | 6.6%(+60.0)#8 | 7.6%(+59.0)#91 |
| 92. | Los Berros | 66.7% | 9.9%(+56.7)#9 | 7.6%(+59.0)#92 |
| 93. | Waka | 66.7% | 9.5%(+57.1)#7 | 7.6%(+59.0)#93 |
| 94. | Adeline | 66.7% | 7.1%(+59.6)#1 | 7.6%(+59.0)#94 |
| 95. | Sasakwa | 66.7% | 5.4%(+61.2)#5 | 7.6%(+59.0)#95 |
| 96. | Dovray | 66.7% | 6.3%(+60.4)#3 | 7.6%(+59.0)#96 |
| 97. | S N P J Borough | 66.7% | 6.7%(+59.9)#6 | 7.6%(+59.0)#97 |
| 98. | Alton | 65.9% | 8.6%(+57.3)#1 | 7.6%(+58.2)#98 |
| 99. | Whitehaven | 65.8% | 7.7%(+58.1)#3 | 7.6%(+58.1)#99 |
| 100. | Day | 65.2% | 7.7%(+57.5)#1 | 7.6%(+57.6)#100 |
Common Questions
What are the Top 10 Cities with the Highest Percentage of Population with a Degree in Engineering in the United States?
Top 10 Cities with the Highest Percentage of Population with a Degree in Engineering in the United States are:
#1
100.0%
#2
100.0%
#3
100.0%
#4
100.0%
#5
100.0%
#6
100.0%
#7
100.0%
#8
100.0%
#9
100.0%
#10
100.0%
What city has the Highest Percentage of Population with a Degree in Engineering in the United States?
Livingston Wheeler has the Highest Percentage of Population with a Degree in Engineering in the United States with 100.0%.
What is the Percentage of Population with a Degree in Engineering in the United States?
Percentage of Population with a Degree in Engineering in the United States is 7.6%.