Cities with the Highest Percentage of Population with a Degree in Engineering in Indiana
RELATED REPORTS & OPTIONS
Engineering
Indiana
Compare Cities
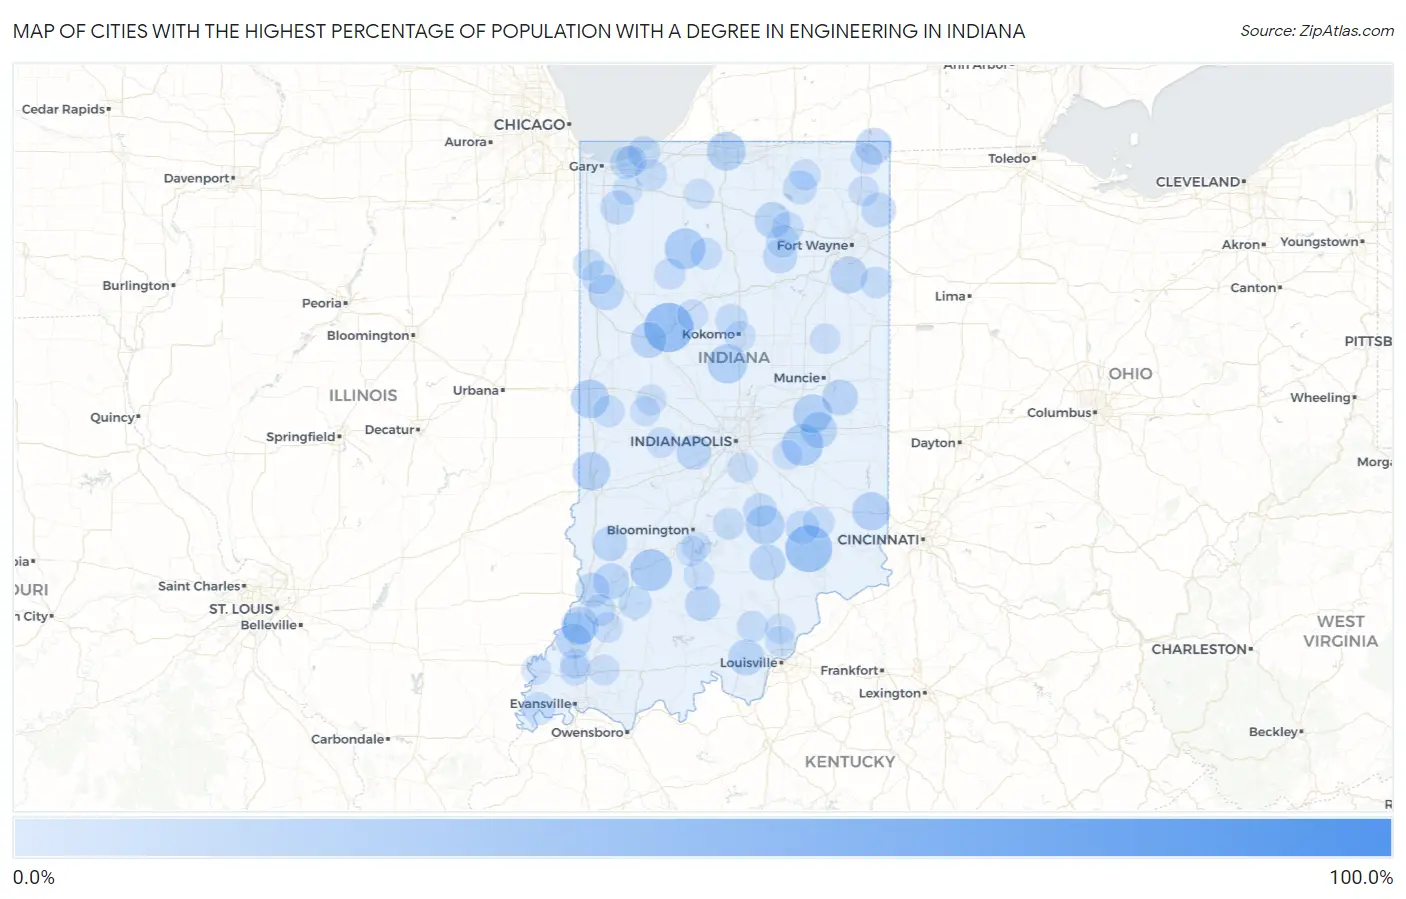
Map of Cities with the Highest Percentage of Population with a Degree in Engineering in Indiana
0.0%
100.0%
Cities with the Highest Percentage of Population with a Degree in Engineering in Indiana
| City | % Graduates | vs State | vs National | |
| 1. | Adams Lake | 100.0% | 6.6%(+93.4)#1 | 7.6%(+92.4)#16 |
| 2. | Brimfield | 100.0% | 6.6%(+93.4)#2 | 7.6%(+92.4)#17 |
| 3. | Liberty Mills | 100.0% | 6.6%(+93.4)#3 | 7.6%(+92.4)#18 |
| 4. | Billtown | 100.0% | 6.6%(+93.4)#4 | 7.6%(+92.4)#27 |
| 5. | New Lisbon | 100.0% | 6.6%(+93.4)#5 | 7.6%(+92.4)#49 |
| 6. | Solsberry | 84.4% | 6.6%(+77.8)#6 | 7.6%(+76.8)#67 |
| 7. | Helmsburg | 66.7% | 6.6%(+60.0)#7 | 7.6%(+59.0)#88 |
| 8. | Groverton | 66.7% | 6.6%(+60.0)#8 | 7.6%(+59.0)#91 |
| 9. | Putnamville | 63.9% | 6.6%(+57.3)#9 | 7.6%(+56.3)#104 |
| 10. | Pleasant Mills | 54.8% | 6.6%(+48.1)#10 | 7.6%(+47.1)#143 |
| 11. | Americus | 43.9% | 6.6%(+37.3)#11 | 7.6%(+36.3)#223 |
| 12. | Butlerville | 39.6% | 6.6%(+33.0)#12 | 7.6%(+31.9)#277 |
| 13. | Lake Of The Woods | 37.8% | 6.6%(+31.2)#13 | 7.6%(+30.2)#291 |
| 14. | St. Anthony | 33.3% | 6.6%(+26.7)#14 | 7.6%(+25.7)#362 |
| 15. | Carthage | 30.0% | 6.6%(+23.4)#15 | 7.6%(+22.4)#441 |
| 16. | Crane | 30.0% | 6.6%(+23.4)#16 | 7.6%(+22.4)#444 |
| 17. | Hessen Cassel | 28.9% | 6.6%(+22.3)#17 | 7.6%(+21.3)#474 |
| 18. | Schaefer Lake | 28.9% | 6.6%(+22.3)#18 | 7.6%(+21.3)#475 |
| 19. | Winamac | 28.5% | 6.6%(+21.8)#19 | 7.6%(+20.8)#502 |
| 20. | Nineveh | 28.3% | 6.6%(+21.7)#20 | 7.6%(+20.7)#513 |
| 21. | Kempton | 25.8% | 6.6%(+19.2)#21 | 7.6%(+18.2)#608 |
| 22. | Columbus | 25.2% | 6.6%(+18.6)#22 | 7.6%(+17.6)#630 |
| 23. | Notre Dame | 25.0% | 6.6%(+18.4)#23 | 7.6%(+17.4)#638 |
| 24. | Cadiz | 25.0% | 6.6%(+18.4)#24 | 7.6%(+17.4)#659 |
| 25. | Perrysville | 24.3% | 6.6%(+17.7)#25 | 7.6%(+16.7)#703 |
| 26. | St Leon | 24.0% | 6.6%(+17.3)#26 | 7.6%(+16.3)#723 |
| 27. | Tecumseh | 23.3% | 6.6%(+16.6)#27 | 7.6%(+15.6)#764 |
| 28. | Ossian | 21.6% | 6.6%(+14.9)#28 | 7.6%(+13.9)#880 |
| 29. | Decker | 21.4% | 6.6%(+14.8)#29 | 7.6%(+13.8)#898 |
| 30. | Fremont | 21.1% | 6.6%(+14.5)#30 | 7.6%(+13.5)#929 |
| 31. | Harrison Lake | 20.9% | 6.6%(+14.3)#31 | 7.6%(+13.2)#961 |
| 32. | Spiceland | 20.3% | 6.6%(+13.6)#32 | 7.6%(+12.6)#1,012 |
| 33. | Edwardsport | 20.0% | 6.6%(+13.4)#33 | 7.6%(+12.4)#1,042 |
| 34. | Crandall | 20.0% | 6.6%(+13.4)#34 | 7.6%(+12.4)#1,049 |
| 35. | Blountsville | 20.0% | 6.6%(+13.4)#35 | 7.6%(+12.4)#1,063 |
| 36. | Warsaw | 19.7% | 6.6%(+13.1)#36 | 7.6%(+12.1)#1,093 |
| 37. | Seymour | 19.6% | 6.6%(+13.0)#37 | 7.6%(+12.0)#1,100 |
| 38. | West Lafayette | 19.3% | 6.6%(+12.7)#38 | 7.6%(+11.7)#1,127 |
| 39. | Goodland | 18.9% | 6.6%(+12.3)#39 | 7.6%(+11.2)#1,175 |
| 40. | Orleans | 18.4% | 6.6%(+11.8)#40 | 7.6%(+10.7)#1,227 |
| 41. | Jimmerson Lake | 18.0% | 6.6%(+11.4)#41 | 7.6%(+10.4)#1,296 |
| 42. | Patoka | 17.8% | 6.6%(+11.2)#42 | 7.6%(+10.1)#1,314 |
| 43. | Clayton | 17.8% | 6.6%(+11.1)#43 | 7.6%(+10.1)#1,321 |
| 44. | Dugger | 17.7% | 6.6%(+11.1)#44 | 7.6%(+10.1)#1,323 |
| 45. | Mineral Springs | 17.7% | 6.6%(+11.1)#45 | 7.6%(+10.0)#1,329 |
| 46. | St Joe | 17.6% | 6.6%(+11.0)#46 | 7.6%(+10.00)#1,333 |
| 47. | Bruceville | 17.5% | 6.6%(+10.9)#47 | 7.6%(+9.85)#1,354 |
| 48. | Spencerville | 17.1% | 6.6%(+10.5)#48 | 7.6%(+9.50)#1,419 |
| 49. | North Manchester | 16.9% | 6.6%(+10.2)#49 | 7.6%(+9.21)#1,468 |
| 50. | Hebron | 16.5% | 6.6%(+9.91)#50 | 7.6%(+8.88)#1,557 |
| 51. | Westport | 16.1% | 6.6%(+9.51)#51 | 7.6%(+8.48)#1,627 |
| 52. | Ligonier | 16.1% | 6.6%(+9.48)#52 | 7.6%(+8.45)#1,636 |
| 53. | Hazleton | 15.8% | 6.6%(+9.17)#53 | 7.6%(+8.14)#1,706 |
| 54. | Taylorsville | 15.7% | 6.6%(+9.05)#54 | 7.6%(+8.02)#1,741 |
| 55. | Brook | 15.3% | 6.6%(+8.66)#55 | 7.6%(+7.63)#1,811 |
| 56. | Burns Harbor | 14.6% | 6.6%(+7.97)#56 | 7.6%(+6.94)#1,959 |
| 57. | Montgomery | 14.4% | 6.6%(+7.80)#57 | 7.6%(+6.78)#1,993 |
| 58. | Bennetts Switch | 14.3% | 6.6%(+7.66)#58 | 7.6%(+6.64)#2,036 |
| 59. | Grandview Lake | 14.3% | 6.6%(+7.66)#59 | 7.6%(+6.64)#2,041 |
| 60. | Sidney | 14.3% | 6.6%(+7.66)#60 | 7.6%(+6.64)#2,065 |
| 61. | Mount Vernon | 14.1% | 6.6%(+7.44)#61 | 7.6%(+6.41)#2,125 |
| 62. | Beverly Shores | 14.1% | 6.6%(+7.44)#62 | 7.6%(+6.41)#2,126 |
| 63. | Galveston | 13.6% | 6.6%(+6.96)#63 | 7.6%(+5.93)#2,277 |
| 64. | Millhousen | 13.0% | 6.6%(+6.42)#64 | 7.6%(+5.40)#2,480 |
| 65. | Kewanna | 12.7% | 6.6%(+6.08)#65 | 7.6%(+5.05)#2,603 |
| 66. | Pierceton | 12.7% | 6.6%(+6.04)#66 | 7.6%(+5.01)#2,617 |
| 67. | Decatur | 12.6% | 6.6%(+5.98)#67 | 7.6%(+4.95)#2,636 |
| 68. | Monroe City | 12.5% | 6.6%(+5.88)#68 | 7.6%(+4.85)#2,667 |
| 69. | Kingman | 12.5% | 6.6%(+5.88)#69 | 7.6%(+4.85)#2,674 |
| 70. | Westville | 12.4% | 6.6%(+5.74)#70 | 7.6%(+4.72)#2,748 |
| 71. | Nashville | 12.2% | 6.6%(+5.61)#71 | 7.6%(+4.59)#2,802 |
| 72. | Porter | 12.0% | 6.6%(+5.39)#72 | 7.6%(+4.36)#2,881 |
| 73. | Buffalo | 11.8% | 6.6%(+5.22)#73 | 7.6%(+4.19)#2,965 |
| 74. | Morocco | 11.8% | 6.6%(+5.14)#74 | 7.6%(+4.12)#2,997 |
| 75. | New Pekin | 11.7% | 6.6%(+5.08)#75 | 7.6%(+4.05)#3,029 |
| 76. | Topeka | 11.6% | 6.6%(+5.01)#76 | 7.6%(+3.98)#3,062 |
| 77. | Kokomo | 11.4% | 6.6%(+4.73)#77 | 7.6%(+3.71)#3,195 |
| 78. | Camden | 11.3% | 6.6%(+4.70)#78 | 7.6%(+3.67)#3,213 |
| 79. | Angola | 11.3% | 6.6%(+4.67)#79 | 7.6%(+3.65)#3,223 |
| 80. | Lynnville | 11.1% | 6.6%(+4.49)#80 | 7.6%(+3.46)#3,324 |
| 81. | Haubstadt | 10.9% | 6.6%(+4.31)#81 | 7.6%(+3.28)#3,443 |
| 82. | Petersburg | 10.8% | 6.6%(+4.16)#82 | 7.6%(+3.13)#3,531 |
| 83. | Crawfordsville | 10.6% | 6.6%(+3.98)#83 | 7.6%(+2.96)#3,644 |
| 84. | Bainbridge | 10.5% | 6.6%(+3.90)#84 | 7.6%(+2.88)#3,699 |
| 85. | Floyds Knobs | 10.5% | 6.6%(+3.87)#85 | 7.6%(+2.85)#3,728 |
| 86. | Waterloo | 10.5% | 6.6%(+3.85)#86 | 7.6%(+2.82)#3,737 |
| 87. | Hartford City | 10.4% | 6.6%(+3.83)#87 | 7.6%(+2.80)#3,752 |
| 88. | Greenwood | 10.3% | 6.6%(+3.70)#88 | 7.6%(+2.67)#3,852 |
| 89. | Bedford | 10.3% | 6.6%(+3.69)#89 | 7.6%(+2.66)#3,864 |
| 90. | Rockford | 10.2% | 6.6%(+3.62)#90 | 7.6%(+2.59)#3,908 |
| 91. | Memphis | 9.8% | 6.6%(+3.21)#91 | 7.6%(+2.19)#4,225 |
| 92. | Lake Holiday | 9.8% | 6.6%(+3.21)#92 | 7.6%(+2.18)#4,230 |
| 93. | Sellersburg | 9.8% | 6.6%(+3.20)#93 | 7.6%(+2.18)#4,233 |
| 94. | Koontz Lake | 9.8% | 6.6%(+3.17)#94 | 7.6%(+2.14)#4,259 |
| 95. | Harrodsburg | 9.7% | 6.6%(+3.08)#95 | 7.6%(+2.05)#4,311 |
| 96. | Aberdeen | 9.7% | 6.6%(+3.04)#96 | 7.6%(+2.01)#4,342 |
| 97. | Smithville Sanders | 9.6% | 6.6%(+2.94)#97 | 7.6%(+1.91)#4,419 |
| 98. | Griffin | 9.5% | 6.6%(+2.90)#98 | 7.6%(+1.88)#4,459 |
| 99. | Fort Branch | 9.5% | 6.6%(+2.89)#99 | 7.6%(+1.87)#4,466 |
| 100. | Morristown | 9.4% | 6.6%(+2.75)#100 | 7.6%(+1.73)#4,567 |
Common Questions
What are the Top 10 Cities with the Highest Percentage of Population with a Degree in Engineering in Indiana?
Top 10 Cities with the Highest Percentage of Population with a Degree in Engineering in Indiana are:
#1
43.9%
#2
39.6%
#3
30.0%
#4
30.0%
#5
28.5%
#6
25.8%
#7
25.2%
#8
25.0%
#9
25.0%
#10
24.3%
What city has the Highest Percentage of Population with a Degree in Engineering in Indiana?
Americus has the Highest Percentage of Population with a Degree in Engineering in Indiana with 43.9%.
What is the Percentage of Population with a Degree in Engineering in the State of Indiana?
Percentage of Population with a Degree in Engineering in Indiana is 6.6%.
What is the Percentage of Population with a Degree in Engineering in the United States?
Percentage of Population with a Degree in Engineering in the United States is 7.6%.