Cities with the Highest Percentage of Population with a Degree in Engineering in Michigan
RELATED REPORTS & OPTIONS
Engineering
Michigan
Compare Cities
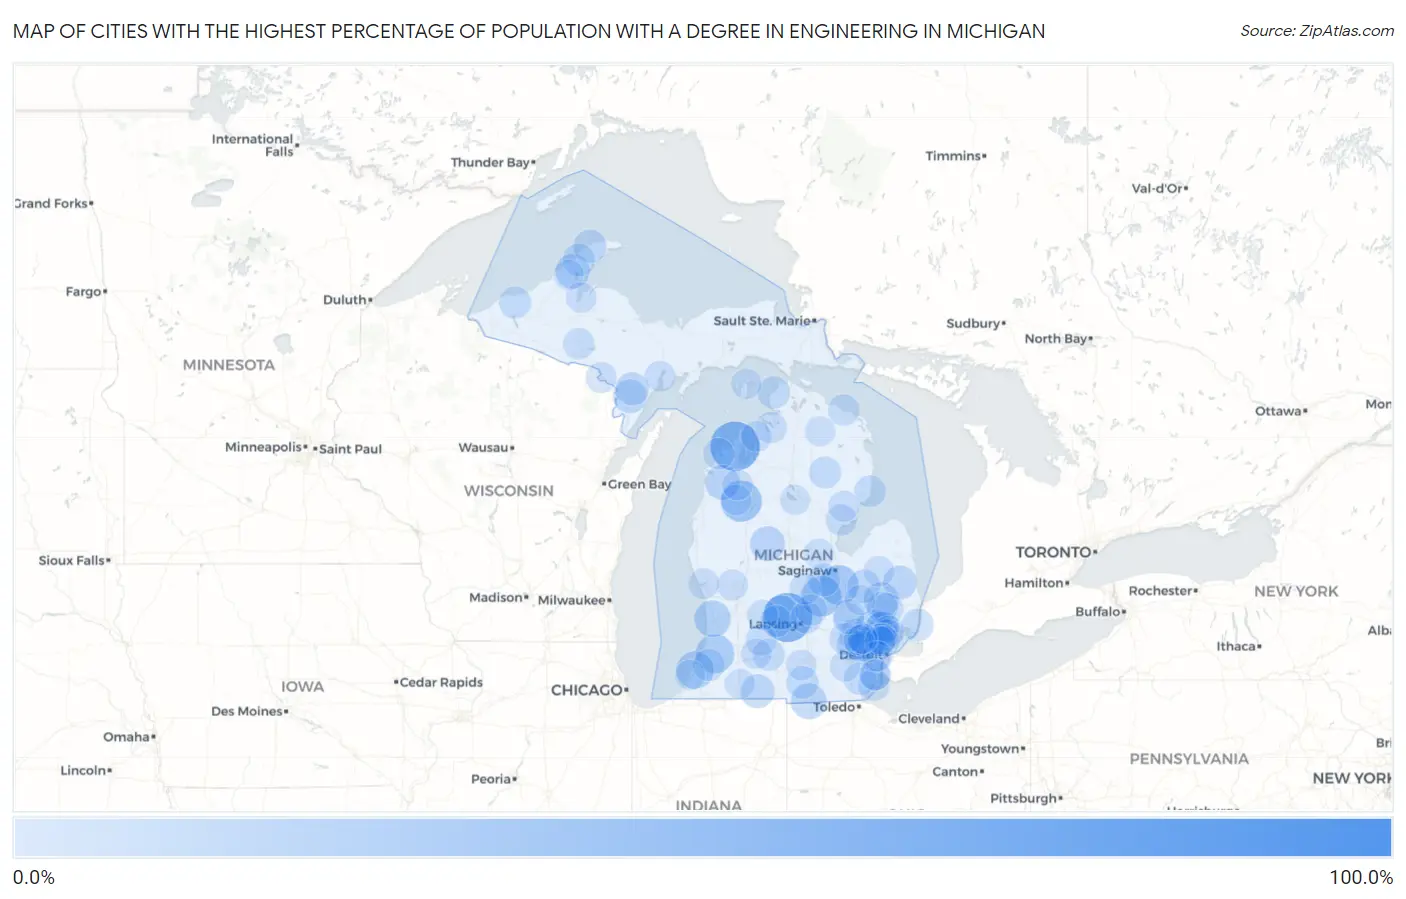
Map of Cities with the Highest Percentage of Population with a Degree in Engineering in Michigan
0.0%
100.0%
Cities with the Highest Percentage of Population with a Degree in Engineering in Michigan
| City | % Graduates | vs State | vs National | |
| 1. | Bergland | 100.0% | 10.0%(+90.0)#1 | 7.6%(+92.4)#37 |
| 2. | Naubinway | 100.0% | 10.0%(+90.0)#2 | 7.6%(+92.4)#45 |
| 3. | Cambria | 81.0% | 10.0%(+70.9)#3 | 7.6%(+73.3)#73 |
| 4. | Dodgeville | 70.0% | 10.0%(+60.0)#4 | 7.6%(+62.4)#82 |
| 5. | Lake Leelanau | 60.9% | 10.0%(+50.8)#5 | 7.6%(+53.2)#115 |
| 6. | Eagle | 60.0% | 10.0%(+50.0)#6 | 7.6%(+52.4)#124 |
| 7. | Boon | 40.0% | 10.0%(+30.0)#7 | 7.6%(+32.4)#273 |
| 8. | Henderson | 37.8% | 10.0%(+27.8)#8 | 7.6%(+30.2)#293 |
| 9. | Burt | 36.5% | 10.0%(+26.5)#9 | 7.6%(+28.8)#313 |
| 10. | Breedsville | 33.3% | 10.0%(+23.3)#10 | 7.6%(+25.7)#357 |
| 11. | Benton Heights | 30.8% | 10.0%(+20.8)#11 | 7.6%(+23.1)#418 |
| 12. | Auburn Hills | 29.3% | 10.0%(+19.3)#12 | 7.6%(+21.6)#465 |
| 13. | Beechwood | 28.4% | 10.0%(+18.4)#13 | 7.6%(+20.8)#504 |
| 14. | Waldron | 26.3% | 10.0%(+16.3)#14 | 7.6%(+18.7)#583 |
| 15. | Attica | 25.2% | 10.0%(+15.2)#15 | 7.6%(+17.6)#629 |
| 16. | Barryton | 24.3% | 10.0%(+14.3)#16 | 7.6%(+16.7)#702 |
| 17. | Thompsonville | 24.2% | 10.0%(+14.2)#17 | 7.6%(+16.6)#706 |
| 18. | Houghton | 23.2% | 10.0%(+13.2)#18 | 7.6%(+15.6)#767 |
| 19. | Portland | 22.6% | 10.0%(+12.6)#19 | 7.6%(+14.9)#797 |
| 20. | Troy | 22.3% | 10.0%(+12.3)#20 | 7.6%(+14.7)#820 |
| 21. | Burr Oak | 22.2% | 10.0%(+12.2)#21 | 7.6%(+14.6)#825 |
| 22. | Novi | 22.2% | 10.0%(+12.2)#22 | 7.6%(+14.6)#848 |
| 23. | Farmington | 21.8% | 10.0%(+11.8)#23 | 7.6%(+14.1)#863 |
| 24. | Peck | 21.7% | 10.0%(+11.7)#24 | 7.6%(+14.1)#867 |
| 25. | Carney | 21.4% | 10.0%(+11.4)#25 | 7.6%(+13.8)#897 |
| 26. | Rochester Hills | 20.8% | 10.0%(+10.7)#26 | 7.6%(+13.1)#973 |
| 27. | Hermansville | 20.0% | 10.0%(+9.98)#27 | 7.6%(+12.4)#1,034 |
| 28. | Powers | 20.0% | 10.0%(+9.98)#28 | 7.6%(+12.4)#1,040 |
| 29. | Otter Lake | 20.0% | 10.0%(+9.98)#29 | 7.6%(+12.4)#1,041 |
| 30. | Eagle River | 20.0% | 10.0%(+9.98)#30 | 7.6%(+12.4)#1,067 |
| 31. | Rochester | 19.7% | 10.0%(+9.65)#31 | 7.6%(+12.0)#1,097 |
| 32. | Farmington Hills | 19.1% | 10.0%(+9.04)#32 | 7.6%(+11.4)#1,152 |
| 33. | St Charles | 18.9% | 10.0%(+8.89)#33 | 7.6%(+11.3)#1,172 |
| 34. | Calumet | 18.8% | 10.0%(+8.78)#34 | 7.6%(+11.1)#1,187 |
| 35. | Skanee | 18.8% | 10.0%(+8.73)#35 | 7.6%(+11.1)#1,197 |
| 36. | Milford | 18.4% | 10.0%(+8.41)#36 | 7.6%(+10.8)#1,221 |
| 37. | Marine City | 18.4% | 10.0%(+8.35)#37 | 7.6%(+10.7)#1,229 |
| 38. | North Adams | 18.2% | 10.0%(+8.16)#38 | 7.6%(+10.5)#1,257 |
| 39. | Cross Village | 18.2% | 10.0%(+8.16)#39 | 7.6%(+10.5)#1,276 |
| 40. | Maybee | 17.9% | 10.0%(+7.87)#40 | 7.6%(+10.2)#1,303 |
| 41. | White Pine | 17.5% | 10.0%(+7.48)#41 | 7.6%(+9.85)#1,355 |
| 42. | Mears | 17.4% | 10.0%(+7.37)#42 | 7.6%(+9.74)#1,379 |
| 43. | Mio | 17.3% | 10.0%(+7.33)#43 | 7.6%(+9.70)#1,390 |
| 44. | Hartford | 17.0% | 10.0%(+6.98)#44 | 7.6%(+9.35)#1,444 |
| 45. | Stony Point | 16.9% | 10.0%(+6.92)#45 | 7.6%(+9.29)#1,456 |
| 46. | Brownlee Park | 16.9% | 10.0%(+6.90)#46 | 7.6%(+9.28)#1,462 |
| 47. | Oscoda | 16.8% | 10.0%(+6.78)#47 | 7.6%(+9.15)#1,477 |
| 48. | Sunfield | 16.7% | 10.0%(+6.65)#48 | 7.6%(+9.02)#1,503 |
| 49. | South Rockwood | 16.5% | 10.0%(+6.49)#49 | 7.6%(+8.86)#1,561 |
| 50. | Lake Fenton | 16.5% | 10.0%(+6.44)#50 | 7.6%(+8.82)#1,573 |
| 51. | Bath | 16.5% | 10.0%(+6.43)#51 | 7.6%(+8.80)#1,574 |
| 52. | Wolverine Lake | 16.4% | 10.0%(+6.39)#52 | 7.6%(+8.77)#1,579 |
| 53. | Almont | 16.1% | 10.0%(+6.08)#53 | 7.6%(+8.46)#1,634 |
| 54. | Dryden | 16.1% | 10.0%(+6.08)#54 | 7.6%(+8.45)#1,637 |
| 55. | South Lyon | 16.0% | 10.0%(+5.97)#55 | 7.6%(+8.34)#1,659 |
| 56. | Lake Victoria | 16.0% | 10.0%(+5.97)#56 | 7.6%(+8.34)#1,660 |
| 57. | Rogers City | 15.9% | 10.0%(+5.88)#57 | 7.6%(+8.26)#1,679 |
| 58. | Glen Arbor | 15.9% | 10.0%(+5.85)#58 | 7.6%(+8.23)#1,683 |
| 59. | Brighton | 15.8% | 10.0%(+5.79)#59 | 7.6%(+8.16)#1,697 |
| 60. | Advance | 15.8% | 10.0%(+5.77)#60 | 7.6%(+8.14)#1,703 |
| 61. | Amasa | 15.8% | 10.0%(+5.77)#61 | 7.6%(+8.14)#1,704 |
| 62. | Sterling Heights | 15.7% | 10.0%(+5.72)#62 | 7.6%(+8.09)#1,720 |
| 63. | Ashley | 15.5% | 10.0%(+5.50)#63 | 7.6%(+7.87)#1,769 |
| 64. | Dowling | 15.4% | 10.0%(+5.36)#64 | 7.6%(+7.74)#1,792 |
| 65. | Omer | 15.4% | 10.0%(+5.36)#65 | 7.6%(+7.74)#1,795 |
| 66. | Dearborn Heights | 15.1% | 10.0%(+5.07)#66 | 7.6%(+7.44)#1,853 |
| 67. | Kent City | 14.9% | 10.0%(+4.87)#67 | 7.6%(+7.25)#1,896 |
| 68. | Northville | 14.9% | 10.0%(+4.86)#68 | 7.6%(+7.23)#1,899 |
| 69. | Utica | 14.8% | 10.0%(+4.75)#69 | 7.6%(+7.12)#1,920 |
| 70. | Clawson | 14.7% | 10.0%(+4.70)#70 | 7.6%(+7.07)#1,927 |
| 71. | Whittemore | 14.7% | 10.0%(+4.69)#71 | 7.6%(+7.06)#1,934 |
| 72. | Fenton | 14.5% | 10.0%(+4.52)#72 | 7.6%(+6.90)#1,972 |
| 73. | Saline | 14.4% | 10.0%(+4.38)#73 | 7.6%(+6.75)#1,997 |
| 74. | Iron Mountain | 14.4% | 10.0%(+4.33)#74 | 7.6%(+6.70)#2,010 |
| 75. | Chassell | 14.3% | 10.0%(+4.27)#75 | 7.6%(+6.64)#2,025 |
| 76. | Zeba | 14.3% | 10.0%(+4.27)#76 | 7.6%(+6.64)#2,038 |
| 77. | Clarksville | 14.3% | 10.0%(+4.27)#77 | 7.6%(+6.64)#2,039 |
| 78. | Kingston | 14.3% | 10.0%(+4.27)#78 | 7.6%(+6.64)#2,040 |
| 79. | Harrietta | 14.3% | 10.0%(+4.27)#79 | 7.6%(+6.64)#2,048 |
| 80. | Gladstone | 14.2% | 10.0%(+4.23)#80 | 7.6%(+6.60)#2,078 |
| 81. | North Muskegon | 14.2% | 10.0%(+4.15)#81 | 7.6%(+6.52)#2,098 |
| 82. | Eastport | 14.1% | 10.0%(+4.11)#82 | 7.6%(+6.48)#2,108 |
| 83. | Augusta | 14.0% | 10.0%(+3.96)#83 | 7.6%(+6.33)#2,154 |
| 84. | Spring Arbor | 13.9% | 10.0%(+3.83)#84 | 7.6%(+6.20)#2,200 |
| 85. | Buckley | 13.8% | 10.0%(+3.77)#85 | 7.6%(+6.15)#2,213 |
| 86. | Madison Heights | 13.6% | 10.0%(+3.61)#86 | 7.6%(+5.98)#2,265 |
| 87. | Rockwood | 13.5% | 10.0%(+3.51)#87 | 7.6%(+5.88)#2,296 |
| 88. | South Range | 13.3% | 10.0%(+3.31)#88 | 7.6%(+5.69)#2,364 |
| 89. | St James | 13.3% | 10.0%(+3.31)#89 | 7.6%(+5.69)#2,371 |
| 90. | Lakeport | 13.3% | 10.0%(+3.24)#90 | 7.6%(+5.61)#2,393 |
| 91. | Midland | 13.2% | 10.0%(+3.18)#91 | 7.6%(+5.56)#2,413 |
| 92. | Canada Creek Ranch | 13.1% | 10.0%(+3.07)#92 | 7.6%(+5.45)#2,446 |
| 93. | Dearborn | 13.0% | 10.0%(+3.01)#93 | 7.6%(+5.38)#2,486 |
| 94. | Shoreham | 13.0% | 10.0%(+2.98)#94 | 7.6%(+5.35)#2,497 |
| 95. | Wixom | 13.0% | 10.0%(+2.97)#95 | 7.6%(+5.34)#2,498 |
| 96. | Prudenville | 13.0% | 10.0%(+2.96)#96 | 7.6%(+5.33)#2,504 |
| 97. | Royal Oak | 12.9% | 10.0%(+2.92)#97 | 7.6%(+5.29)#2,520 |
| 98. | Walled Lake | 12.9% | 10.0%(+2.92)#98 | 7.6%(+5.29)#2,522 |
| 99. | Three Rivers | 12.8% | 10.0%(+2.79)#99 | 7.6%(+5.16)#2,563 |
| 100. | Davison | 12.8% | 10.0%(+2.76)#100 | 7.6%(+5.13)#2,570 |
Common Questions
What are the Top 10 Cities with the Highest Percentage of Population with a Degree in Engineering in Michigan?
Top 10 Cities with the Highest Percentage of Population with a Degree in Engineering in Michigan are:
#1
60.9%
#2
60.0%
#3
40.0%
#4
37.8%
#5
36.5%
#6
33.3%
#7
30.8%
#8
29.3%
#9
28.4%
#10
26.3%
What city has the Highest Percentage of Population with a Degree in Engineering in Michigan?
Lake Leelanau has the Highest Percentage of Population with a Degree in Engineering in Michigan with 60.9%.
What is the Percentage of Population with a Degree in Engineering in the State of Michigan?
Percentage of Population with a Degree in Engineering in Michigan is 10.0%.
What is the Percentage of Population with a Degree in Engineering in the United States?
Percentage of Population with a Degree in Engineering in the United States is 7.6%.