Cities with the Highest Percentage of Population with a Degree in Engineering in West Virginia
RELATED REPORTS & OPTIONS
Engineering
West Virginia
Compare Cities
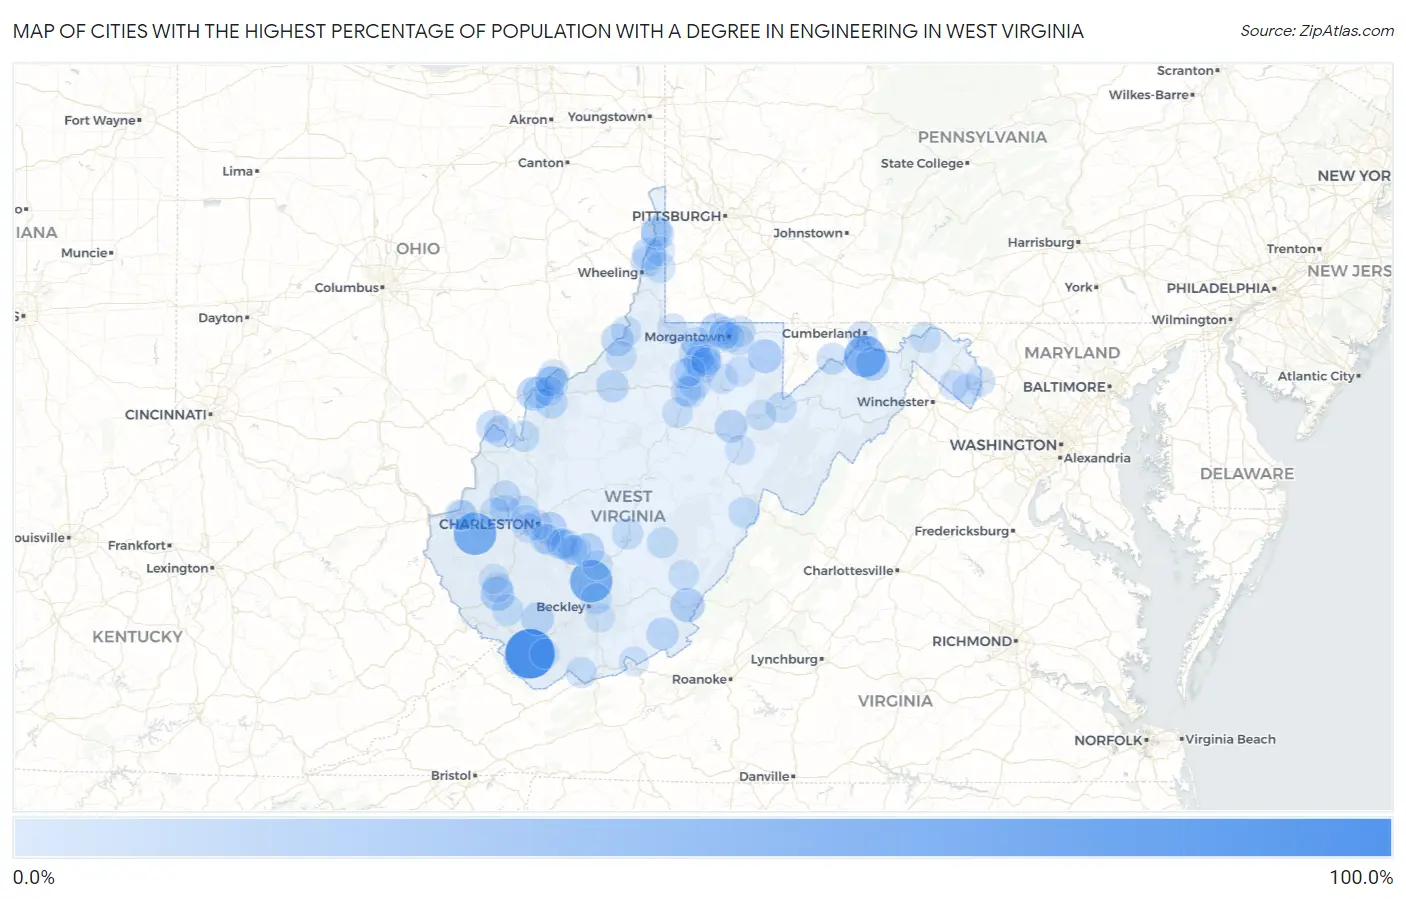
Map of Cities with the Highest Percentage of Population with a Degree in Engineering in West Virginia
0.0%
100.0%
Cities with the Highest Percentage of Population with a Degree in Engineering in West Virginia
| City | % Graduates | vs State | vs National | |
| 1. | Reynoldsville | 100.0% | 5.0%(+95.0)#1 | 7.6%(+92.4)#14 |
| 2. | Roderfield | 100.0% | 5.0%(+95.0)#2 | 7.6%(+92.4)#32 |
| 3. | Colcord | 100.0% | 5.0%(+95.0)#3 | 7.6%(+92.4)#35 |
| 4. | West Hamlin | 64.0% | 5.0%(+59.0)#4 | 7.6%(+56.4)#102 |
| 5. | Scarbro | 64.0% | 5.0%(+59.0)#5 | 7.6%(+56.4)#103 |
| 6. | Fort Ashby | 59.2% | 5.0%(+54.2)#6 | 7.6%(+51.6)#128 |
| 7. | Sprague | 36.0% | 5.0%(+31.0)#7 | 7.6%(+28.4)#322 |
| 8. | White Sulphur Springs | 23.8% | 5.0%(+18.7)#8 | 7.6%(+16.1)#737 |
| 9. | West Logan | 22.2% | 5.0%(+17.2)#9 | 7.6%(+14.6)#829 |
| 10. | Albright | 22.2% | 5.0%(+17.2)#10 | 7.6%(+14.6)#830 |
| 11. | Springfield | 21.6% | 5.0%(+16.6)#11 | 7.6%(+13.9)#879 |
| 12. | Cassville | 21.4% | 5.0%(+16.4)#12 | 7.6%(+13.8)#907 |
| 13. | Gauley Bridge | 21.2% | 5.0%(+16.1)#13 | 7.6%(+13.5)#928 |
| 14. | Washington | 20.8% | 5.0%(+15.8)#14 | 7.6%(+13.2)#964 |
| 15. | Coal Fork | 20.2% | 5.0%(+15.1)#15 | 7.6%(+12.5)#1,018 |
| 16. | Barrackville | 18.7% | 5.0%(+13.7)#16 | 7.6%(+11.0)#1,203 |
| 17. | Oceana | 17.1% | 5.0%(+12.0)#17 | 7.6%(+9.43)#1,432 |
| 18. | Hooverson Heights | 16.8% | 5.0%(+11.8)#18 | 7.6%(+9.18)#1,472 |
| 19. | Windsor Heights | 16.7% | 5.0%(+11.6)#19 | 7.6%(+9.02)#1,504 |
| 20. | Belington | 16.4% | 5.0%(+11.4)#20 | 7.6%(+8.79)#1,577 |
| 21. | Paden City | 15.8% | 5.0%(+10.8)#21 | 7.6%(+8.18)#1,695 |
| 22. | Union | 14.8% | 5.0%(+9.75)#22 | 7.6%(+7.13)#1,919 |
| 23. | Pennsboro | 14.7% | 5.0%(+9.68)#23 | 7.6%(+7.06)#1,930 |
| 24. | Mineralwells | 14.7% | 5.0%(+9.67)#24 | 7.6%(+7.04)#1,938 |
| 25. | North Hills | 14.2% | 5.0%(+9.22)#25 | 7.6%(+6.60)#2,080 |
| 26. | Mason | 14.1% | 5.0%(+9.04)#26 | 7.6%(+6.41)#2,124 |
| 27. | Farmington | 12.8% | 5.0%(+7.80)#27 | 7.6%(+5.17)#2,555 |
| 28. | New Haven | 12.3% | 5.0%(+7.32)#28 | 7.6%(+4.69)#2,756 |
| 29. | West Dunbar | 12.1% | 5.0%(+7.10)#29 | 7.6%(+4.47)#2,843 |
| 30. | Bridgeport | 11.3% | 5.0%(+6.30)#30 | 7.6%(+3.68)#3,210 |
| 31. | Piedmont | 11.1% | 5.0%(+6.09)#31 | 7.6%(+3.46)#3,325 |
| 32. | Eleanor | 10.9% | 5.0%(+5.92)#32 | 7.6%(+3.30)#3,437 |
| 33. | Blennerhassett | 10.9% | 5.0%(+5.83)#33 | 7.6%(+3.21)#3,488 |
| 34. | Clifton | 10.8% | 5.0%(+5.75)#34 | 7.6%(+3.12)#3,540 |
| 35. | Man | 10.5% | 5.0%(+5.47)#35 | 7.6%(+2.84)#3,730 |
| 36. | Star City | 10.3% | 5.0%(+5.31)#36 | 7.6%(+2.68)#3,846 |
| 37. | White Hall | 10.2% | 5.0%(+5.17)#37 | 7.6%(+2.55)#3,940 |
| 38. | Fairview | 10.0% | 5.0%(+4.98)#38 | 7.6%(+2.35)#4,089 |
| 39. | Ravenswood | 9.6% | 5.0%(+4.61)#39 | 7.6%(+1.99)#4,358 |
| 40. | Cross Lanes | 9.4% | 5.0%(+4.33)#40 | 7.6%(+1.70)#4,590 |
| 41. | Summersville | 9.3% | 5.0%(+4.31)#41 | 7.6%(+1.68)#4,608 |
| 42. | Bath Berkeley Springs | 9.3% | 5.0%(+4.25)#42 | 7.6%(+1.62)#4,661 |
| 43. | Clearview | 9.2% | 5.0%(+4.18)#43 | 7.6%(+1.55)#4,720 |
| 44. | Follansbee | 9.1% | 5.0%(+4.07)#44 | 7.6%(+1.44)#4,790 |
| 45. | Green Bank | 9.1% | 5.0%(+4.07)#45 | 7.6%(+1.44)#4,826 |
| 46. | Ranson Corporation | 9.1% | 5.0%(+4.04)#46 | 7.6%(+1.41)#4,845 |
| 47. | Belle | 9.0% | 5.0%(+4.02)#47 | 7.6%(+1.40)#4,863 |
| 48. | Pea Ridge | 8.4% | 5.0%(+3.37)#48 | 7.6%(+0.742)#5,502 |
| 49. | Valley Grove | 8.3% | 5.0%(+3.31)#49 | 7.6%(+0.686)#5,565 |
| 50. | Thomas | 8.1% | 5.0%(+3.10)#50 | 7.6%(+0.477)#5,812 |
| 51. | Piney View | 8.0% | 5.0%(+3.01)#51 | 7.6%(+0.382)#5,930 |
| 52. | Bluewell | 8.0% | 5.0%(+2.96)#52 | 7.6%(+0.340)#5,988 |
| 53. | Richwood | 7.9% | 5.0%(+2.89)#53 | 7.6%(+0.264)#6,075 |
| 54. | Stonewood | 7.9% | 5.0%(+2.88)#54 | 7.6%(+0.254)#6,090 |
| 55. | Monongah | 7.9% | 5.0%(+2.87)#55 | 7.6%(+0.247)#6,099 |
| 56. | Lumberport | 7.5% | 5.0%(+2.48)#56 | 7.6%(-0.148)#6,592 |
| 57. | Cheat Lake | 7.5% | 5.0%(+2.46)#57 | 7.6%(-0.161)#6,616 |
| 58. | Teays Valley | 7.5% | 5.0%(+2.45)#58 | 7.6%(-0.174)#6,631 |
| 59. | Boaz | 7.5% | 5.0%(+2.44)#59 | 7.6%(-0.185)#6,642 |
| 60. | New Martinsville | 7.1% | 5.0%(+2.11)#60 | 7.6%(-0.515)#7,102 |
| 61. | Parsons | 7.1% | 5.0%(+2.07)#61 | 7.6%(-0.551)#7,150 |
| 62. | Jane Lew | 7.1% | 5.0%(+2.05)#62 | 7.6%(-0.577)#7,183 |
| 63. | Nutter Fort | 7.1% | 5.0%(+2.04)#63 | 7.6%(-0.589)#7,199 |
| 64. | Hurricane | 7.0% | 5.0%(+2.02)#64 | 7.6%(-0.605)#7,211 |
| 65. | Institute | 6.9% | 5.0%(+1.90)#65 | 7.6%(-0.724)#7,384 |
| 66. | Middlebourne | 6.7% | 5.0%(+1.70)#66 | 7.6%(-0.925)#7,662 |
| 67. | Falling Spring | 6.7% | 5.0%(+1.64)#67 | 7.6%(-0.981)#7,758 |
| 68. | East Bank | 6.5% | 5.0%(+1.43)#68 | 7.6%(-1.20)#8,058 |
| 69. | Carpendale | 6.4% | 5.0%(+1.39)#69 | 7.6%(-1.24)#8,133 |
| 70. | Glasgow | 6.4% | 5.0%(+1.39)#70 | 7.6%(-1.24)#8,136 |
| 71. | Pratt | 6.4% | 5.0%(+1.36)#71 | 7.6%(-1.26)#8,174 |
| 72. | Brookhaven | 6.2% | 5.0%(+1.22)#72 | 7.6%(-1.40)#8,422 |
| 73. | Charleston | 5.9% | 5.0%(+0.857)#73 | 7.6%(-1.77)#9,044 |
| 74. | Hundred | 5.8% | 5.0%(+0.746)#74 | 7.6%(-1.88)#9,204 |
| 75. | Dunbar | 5.7% | 5.0%(+0.707)#75 | 7.6%(-1.92)#9,265 |
| 76. | Westover | 5.7% | 5.0%(+0.641)#76 | 7.6%(-1.98)#9,394 |
| 77. | Middleway | 5.6% | 5.0%(+0.580)#77 | 7.6%(-2.04)#9,491 |
| 78. | Charles Town | 5.5% | 5.0%(+0.526)#78 | 7.6%(-2.10)#9,588 |
| 79. | Bolivar | 5.5% | 5.0%(+0.445)#79 | 7.6%(-2.18)#9,717 |
| 80. | South Charleston | 5.3% | 5.0%(+0.273)#80 | 7.6%(-2.35)#10,018 |
| 81. | Smithers | 5.1% | 5.0%(+0.105)#81 | 7.6%(-2.52)#10,296 |
| 82. | Mitchell Heights | 5.1% | 5.0%(+0.079)#82 | 7.6%(-2.55)#10,358 |
| 83. | Fairmont | 5.0% | 5.0%(-0.026)#83 | 7.6%(-2.65)#10,559 |
| 84. | Grafton | 4.8% | 5.0%(-0.178)#84 | 7.6%(-2.80)#10,818 |
| 85. | Pleasant Valley | 4.8% | 5.0%(-0.233)#85 | 7.6%(-2.86)#10,928 |
| 86. | Montgomery | 4.6% | 5.0%(-0.455)#86 | 7.6%(-3.08)#11,300 |
| 87. | Newburg | 4.5% | 5.0%(-0.478)#87 | 7.6%(-3.10)#11,358 |
| 88. | Parkersburg | 4.5% | 5.0%(-0.502)#88 | 7.6%(-3.13)#11,398 |
| 89. | Chapmanville | 4.5% | 5.0%(-0.529)#89 | 7.6%(-3.15)#11,435 |
| 90. | Morgantown | 4.5% | 5.0%(-0.568)#90 | 7.6%(-3.19)#11,509 |
| 91. | Vienna | 4.4% | 5.0%(-0.596)#91 | 7.6%(-3.22)#11,556 |
| 92. | Marmet | 4.3% | 5.0%(-0.697)#92 | 7.6%(-3.32)#11,739 |
| 93. | Bethany | 4.3% | 5.0%(-0.768)#93 | 7.6%(-3.39)#11,845 |
| 94. | Shinnston | 4.2% | 5.0%(-0.781)#94 | 7.6%(-3.41)#11,868 |
| 95. | Shady Spring | 4.1% | 5.0%(-0.904)#95 | 7.6%(-3.53)#12,106 |
| 96. | Barboursville | 4.1% | 5.0%(-0.906)#96 | 7.6%(-3.53)#12,110 |
| 97. | Welch | 4.1% | 5.0%(-0.969)#97 | 7.6%(-3.59)#12,211 |
| 98. | Fayetteville | 3.9% | 5.0%(-1.10)#98 | 7.6%(-3.72)#12,430 |
| 99. | Peterstown | 3.8% | 5.0%(-1.25)#99 | 7.6%(-3.87)#12,699 |
| 100. | Beverly | 3.7% | 5.0%(-1.32)#100 | 7.6%(-3.94)#12,833 |
Common Questions
What are the Top 10 Cities with the Highest Percentage of Population with a Degree in Engineering in West Virginia?
Top 10 Cities with the Highest Percentage of Population with a Degree in Engineering in West Virginia are:
#1
100.0%
#2
64.0%
#3
64.0%
#4
59.2%
#5
23.8%
#6
22.2%
#7
22.2%
#8
21.6%
#9
21.4%
#10
21.2%
What city has the Highest Percentage of Population with a Degree in Engineering in West Virginia?
Roderfield has the Highest Percentage of Population with a Degree in Engineering in West Virginia with 100.0%.
What is the Percentage of Population with a Degree in Engineering in the State of West Virginia?
Percentage of Population with a Degree in Engineering in West Virginia is 5.0%.
What is the Percentage of Population with a Degree in Engineering in the United States?
Percentage of Population with a Degree in Engineering in the United States is 7.6%.