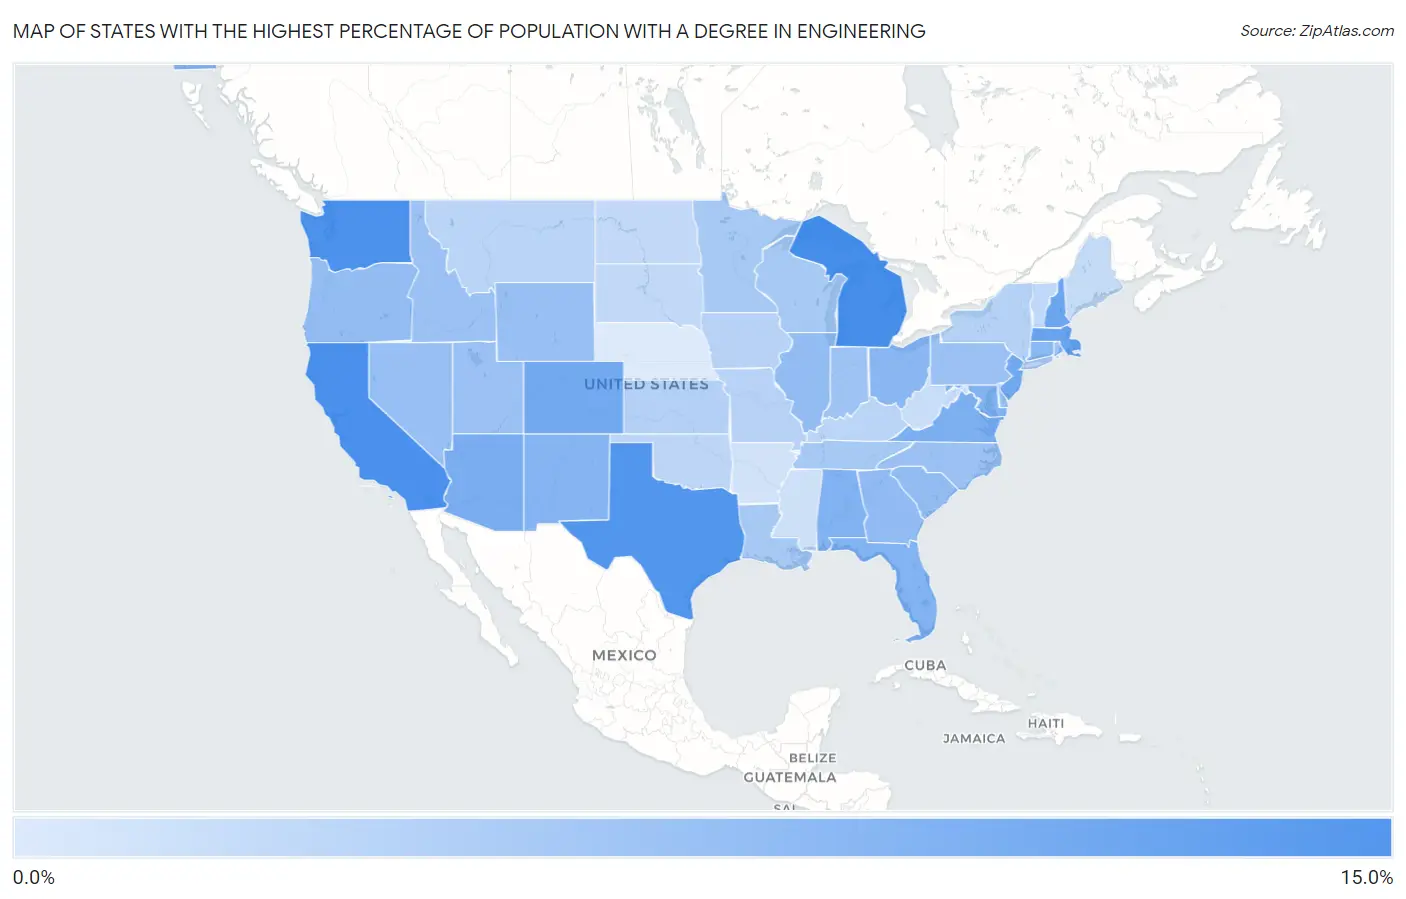
States with the Highest Percentage of Population with a Degree in Engineering
RELATED REPORTS & OPTIONS
Engineering
United States
Compare States
Map of States with the Highest Percentage of Population with a Degree in Engineering
0.0%
15.0%

States with the Highest Percentage of Population with a Degree in Engineering in the United States
| State | % Graduates | vs State Median | vs National | |
| 1. | Michigan | 10.0% | 6.8% (+3.27) | 7.6%(+2.37) |
| 2. | California | 9.9% | 6.8% (+3.17) | 7.6%(+2.28) |
| 3. | Washington | 9.8% | 6.8% (+3.08) | 7.6%(+2.19) |
| 4. | Texas | 9.5% | 6.8% (+2.79) | 7.6%(+1.89) |
| 5. | Massachusetts | 8.7% | 6.8% (+1.97) | 7.6%(+1.07) |
| 6. | New Hampshire | 8.6% | 6.8% (+1.82) | 7.6%(+0.928) |
| 7. | New Jersey | 8.3% | 6.8% (+1.54) | 7.6%(+0.649) |
| 8. | Colorado | 8.3% | 6.8% (+1.51) | 7.6%(+0.613) |
| 9. | Arizona | 8.0% | 6.8% (+1.22) | 7.6%(+0.328) |
| 10. | Virginia | 7.9% | 6.8% (+1.19) | 7.6%(+0.293) |
| 11. | Florida | 7.7% | 6.8% (+0.957) | 7.6%(+0.064) |
| 12. | Alabama | 7.7% | 6.8% (+0.946) | 7.6%(+0.053) |
| 13. | Maryland | 7.7% | 6.8% (+0.909) | 7.6%(+0.016) |
| 14. | New Mexico | 7.6% | 6.8% (+0.812) | 7.6%(-0.081) |
| 15. | Connecticut | 7.4% | 6.8% (+0.634) | 7.6%(-0.260) |
| 16. | Ohio | 7.4% | 6.8% (+0.620) | 7.6%(-0.273) |
| 17. | Alaska | 7.2% | 6.8% (+0.447) | 7.6%(-0.446) |
| 18. | Georgia | 7.1% | 6.8% (+0.333) | 7.6%(-0.561) |
| 19. | Illinois | 7.1% | 6.8% (+0.299) | 7.6%(-0.594) |
| 20. | Oregon | 7.0% | 6.8% (+0.269) | 7.6%(-0.625) |
| 21. | South Carolina | 7.0% | 6.8% (+0.257) | 7.6%(-0.636) |
| 22. | Nevada | 6.9% | 6.8% (+0.119) | 7.6%(-0.775) |
| 23. | Wyoming | 6.9% | 6.8% (+0.105) | 7.6%(-0.788) |
| 24. | Delaware | 6.8% | 6.8% (+0.067) | 7.6%(-0.826) |
| 25. | Utah | 6.8% | 6.8% (+0.016) | 7.6%(-0.878) |
| 26. | Pennsylvania | 6.7% | 6.8% (-0.016) | 7.6%(-0.909) |
| 27. | North Carolina | 6.7% | 6.8% (-0.067) | 7.6%(-0.960) |
| 28. | Idaho | 6.7% | 6.8% (-0.090) | 7.6%(-0.983) |
| 29. | Rhode Island | 6.6% | 6.8% (-0.120) | 7.6%(-1.01) |
| 30. | Indiana | 6.6% | 6.8% (-0.131) | 7.6%(-1.02) |
| 31. | Hawaii | 6.5% | 6.8% (-0.286) | 7.6%(-1.18) |
| 32. | Minnesota | 6.3% | 6.8% (-0.496) | 7.6%(-1.39) |
| 33. | Louisiana | 6.2% | 6.8% (-0.516) | 7.6%(-1.41) |
| 34. | Wisconsin | 6.2% | 6.8% (-0.568) | 7.6%(-1.46) |
| 35. | Tennessee | 6.2% | 6.8% (-0.573) | 7.6%(-1.47) |
| 36. | Kansas | 5.8% | 6.8% (-0.932) | 7.6%(-1.83) |
| 37. | New York | 5.6% | 6.8% (-1.11) | 7.6%(-2.00) |
| 38. | Missouri | 5.6% | 6.8% (-1.18) | 7.6%(-2.08) |
| 39. | Iowa | 5.6% | 6.8% (-1.19) | 7.6%(-2.09) |
| 40. | Kentucky | 5.5% | 6.8% (-1.23) | 7.6%(-2.12) |
| 41. | Montana | 5.5% | 6.8% (-1.28) | 7.6%(-2.17) |
| 42. | Oklahoma | 5.4% | 6.8% (-1.31) | 7.6%(-2.21) |
| 43. | Vermont | 5.3% | 6.8% (-1.46) | 7.6%(-2.35) |
| 44. | South Dakota | 5.3% | 6.8% (-1.50) | 7.6%(-2.39) |
| 45. | North Dakota | 5.2% | 6.8% (-1.51) | 7.6%(-2.40) |
| 46. | Maine | 5.1% | 6.8% (-1.65) | 7.6%(-2.54) |
| 47. | West Virginia | 5.0% | 6.8% (-1.73) | 7.6%(-2.62) |
| 48. | Mississippi | 4.7% | 6.8% (-2.04) | 7.6%(-2.93) |
| 49. | Arkansas | 4.7% | 6.8% (-2.08) | 7.6%(-2.97) |
| 50. | Nebraska | 4.2% | 6.8% (-2.55) | 7.6%(-3.45) |
1
Common Questions
What are the Top 10 States with the Highest Percentage of Population with a Degree in Engineering in the United States?
Top 10 States with the Highest Percentage of Population with a Degree in Engineering in the United States are:
#1
10.0%
#2
9.9%
#3
9.8%
#4
9.5%
#5
8.7%
#6
8.6%
#7
8.3%
#8
8.3%
#9
8.0%
#10
7.9%
What state has the Highest Percentage of Population with a Degree in Engineering in the United States?
Michigan has the Highest Percentage of Population with a Degree in Engineering in the United States with 10.0%.
What is the Percentage of Population with a Degree in Engineering in the United States?
Percentage of Population with a Degree in Engineering in the United States is 7.6%.