Cities with the Highest Percentage of Population with a Degree in Engineering in Puerto Rico
RELATED REPORTS & OPTIONS
Engineering
Puerto Rico
Compare Cities
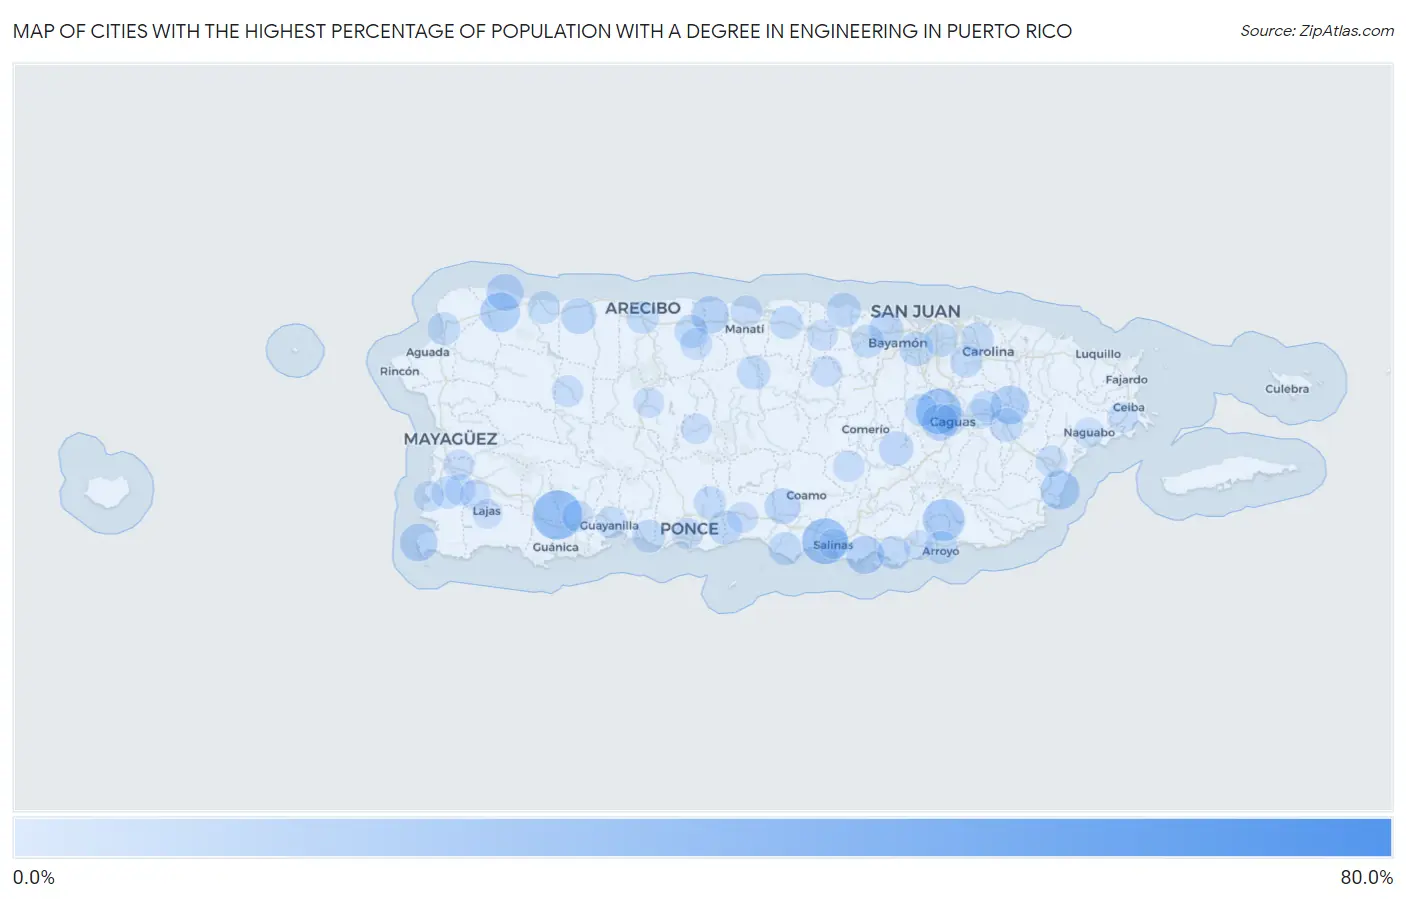
Map of Cities with the Highest Percentage of Population with a Degree in Engineering in Puerto Rico
0.0%
80.0%
Cities with the Highest Percentage of Population with a Degree in Engineering in Puerto Rico
| City | % Graduates | vs State | vs National | |
| 1. | Villa Hugo I | 71.6% | 5.1%(+66.5)#1 | 7.6%(+63.9)#79 |
| 2. | Rio Canas Abajo | 32.7% | 5.1%(+27.7)#2 | 7.6%(+25.1)#383 |
| 3. | Buena Vista Comunidad Humacao Municipio | 32.4% | 5.1%(+27.4)#3 | 7.6%(+24.8)#387 |
| 4. | Lluveras | 28.4% | 5.1%(+23.3)#4 | 7.6%(+20.7)#506 |
| 5. | Las Ochenta | 23.5% | 5.1%(+18.4)#5 | 7.6%(+15.8)#752 |
| 6. | Las Carolinas | 22.7% | 5.1%(+17.6)#6 | 7.6%(+15.0)#794 |
| 7. | Marueno | 22.1% | 5.1%(+17.1)#7 | 7.6%(+14.5)#850 |
| 8. | Pena Pobre | 21.4% | 5.1%(+16.3)#8 | 7.6%(+13.7)#909 |
| 9. | Canovanillas | 18.2% | 5.1%(+13.1)#9 | 7.6%(+10.5)#1,264 |
| 10. | Yaurel | 17.8% | 5.1%(+12.7)#10 | 7.6%(+10.1)#1,312 |
| 11. | Mariano Colon | 17.4% | 5.1%(+12.4)#11 | 7.6%(+9.78)#1,364 |
| 12. | Boqueron Comunidad Cabo Rojo Municipio | 15.5% | 5.1%(+10.4)#12 | 7.6%(+7.83)#1,774 |
| 13. | Mora | 15.1% | 5.1%(+10.0)#13 | 7.6%(+7.45)#1,851 |
| 14. | Rio Lajas | 15.1% | 5.1%(+10.0)#14 | 7.6%(+7.44)#1,857 |
| 15. | Bayamon | 15.0% | 5.1%(+9.96)#15 | 7.6%(+7.37)#1,868 |
| 16. | Palmas Del Mar | 14.0% | 5.1%(+8.95)#16 | 7.6%(+6.36)#2,141 |
| 17. | Lomas | 13.4% | 5.1%(+8.32)#17 | 7.6%(+5.72)#2,348 |
| 18. | Central Aguirre | 12.7% | 5.1%(+7.67)#18 | 7.6%(+5.08)#2,586 |
| 19. | El Combate | 11.9% | 5.1%(+6.88)#19 | 7.6%(+4.29)#2,915 |
| 20. | Garrochales | 11.9% | 5.1%(+6.82)#20 | 7.6%(+4.23)#2,949 |
| 21. | Isabela | 11.6% | 5.1%(+6.58)#21 | 7.6%(+3.99)#3,056 |
| 22. | Los Prados | 10.5% | 5.1%(+5.45)#22 | 7.6%(+2.86)#3,718 |
| 23. | Las Gaviotas | 10.3% | 5.1%(+5.29)#23 | 7.6%(+2.70)#3,833 |
| 24. | Rincon | 10.2% | 5.1%(+5.10)#24 | 7.6%(+2.51)#3,963 |
| 25. | Hacienda San Jose | 10.0% | 5.1%(+4.96)#25 | 7.6%(+2.37)#4,050 |
| 26. | Los Llanos | 9.4% | 5.1%(+4.32)#26 | 7.6%(+1.73)#4,566 |
| 27. | Alianza | 9.2% | 5.1%(+4.16)#27 | 7.6%(+1.57)#4,705 |
| 28. | Hato Viejo | 8.7% | 5.1%(+3.62)#28 | 7.6%(+1.03)#5,241 |
| 29. | Rafael Gonzalez | 8.4% | 5.1%(+3.35)#29 | 7.6%(+0.764)#5,480 |
| 30. | Dorado | 8.1% | 5.1%(+3.06)#30 | 7.6%(+0.469)#5,816 |
| 31. | Cidra | 8.1% | 5.1%(+3.01)#31 | 7.6%(+0.415)#5,889 |
| 32. | Palomas Comunidad Yauco Municipio | 7.9% | 5.1%(+2.89)#32 | 7.6%(+0.299)#6,030 |
| 33. | Penuelas | 7.9% | 5.1%(+2.87)#33 | 7.6%(+0.280)#6,054 |
| 34. | Guanica | 7.9% | 5.1%(+2.87)#34 | 7.6%(+0.275)#6,060 |
| 35. | Guaynabo | 7.8% | 5.1%(+2.72)#35 | 7.6%(+0.129)#6,236 |
| 36. | Imbery | 7.7% | 5.1%(+2.60)#36 | 7.6%(+0.013)#6,408 |
| 37. | Capitanejo | 7.2% | 5.1%(+2.17)#37 | 7.6%(-0.424)#6,957 |
| 38. | Sabana Seca | 7.2% | 5.1%(+2.16)#38 | 7.6%(-0.430)#6,966 |
| 39. | Mayaguez | 7.1% | 5.1%(+2.02)#39 | 7.6%(-0.571)#7,171 |
| 40. | Juncos | 7.0% | 5.1%(+1.92)#40 | 7.6%(-0.669)#7,295 |
| 41. | Ciales | 6.8% | 5.1%(+1.75)#41 | 7.6%(-0.841)#7,543 |
| 42. | Canovanas | 6.3% | 5.1%(+1.24)#42 | 7.6%(-1.35)#8,307 |
| 43. | Pajaros | 6.3% | 5.1%(+1.23)#43 | 7.6%(-1.36)#8,314 |
| 44. | Catano | 6.2% | 5.1%(+1.19)#44 | 7.6%(-1.40)#8,379 |
| 45. | Arroyo | 6.2% | 5.1%(+1.18)#45 | 7.6%(-1.41)#8,434 |
| 46. | Sabana Hoyos | 6.2% | 5.1%(+1.16)#46 | 7.6%(-1.43)#8,469 |
| 47. | Manati | 6.2% | 5.1%(+1.11)#47 | 7.6%(-1.48)#8,556 |
| 48. | Santa Barbara | 6.1% | 5.1%(+1.08)#48 | 7.6%(-1.51)#8,600 |
| 49. | Vega Baja | 6.1% | 5.1%(+1.07)#49 | 7.6%(-1.52)#8,624 |
| 50. | San Juan | 6.1% | 5.1%(+1.01)#50 | 7.6%(-1.58)#8,725 |
| 51. | Jobos | 6.1% | 5.1%(+1.00)#51 | 7.6%(-1.59)#8,738 |
| 52. | Santa Isabel | 6.0% | 5.1%(+0.962)#52 | 7.6%(-1.63)#8,806 |
| 53. | Tallaboa | 5.9% | 5.1%(+0.853)#53 | 7.6%(-1.74)#8,971 |
| 54. | Del Carmen | 5.9% | 5.1%(+0.801)#54 | 7.6%(-1.79)#9,072 |
| 55. | Candelaria | 5.7% | 5.1%(+0.680)#55 | 7.6%(-1.91)#9,253 |
| 56. | Mansión Del Mar | 5.7% | 5.1%(+0.624)#56 | 7.6%(-1.97)#9,363 |
| 57. | Quebradillas | 5.5% | 5.1%(+0.423)#57 | 7.6%(-2.17)#9,696 |
| 58. | Aguadilla | 5.3% | 5.1%(+0.262)#58 | 7.6%(-2.33)#9,981 |
| 59. | Trujillo Alto | 5.2% | 5.1%(+0.179)#59 | 7.6%(-2.41)#10,124 |
| 60. | Carolina | 5.1% | 5.1%(+0.074)#60 | 7.6%(-2.52)#10,286 |
| 61. | San Antonio Comunidad Dorado Municipio | 5.1% | 5.1%(+0.012)#61 | 7.6%(-2.58)#10,420 |
| 62. | Arecibo | 5.0% | 5.1%(-0.021)#62 | 7.6%(-2.61)#10,474 |
| 63. | Cerrillos Hoyos | 4.9% | 5.1%(-0.154)#63 | 7.6%(-2.75)#10,712 |
| 64. | Bayamón | 4.8% | 5.1%(-0.207)#64 | 7.6%(-2.80)#10,812 |
| 65. | Cabo Rojo | 4.8% | 5.1%(-0.277)#65 | 7.6%(-2.87)#10,948 |
| 66. | Aguas Buenas | 4.8% | 5.1%(-0.279)#66 | 7.6%(-2.87)#10,950 |
| 67. | Comerio | 4.7% | 5.1%(-0.366)#67 | 7.6%(-2.96)#11,085 |
| 68. | La Alianza | 4.5% | 5.1%(-0.569)#68 | 7.6%(-3.16)#11,454 |
| 69. | Liborio Negron Torres | 4.4% | 5.1%(-0.622)#69 | 7.6%(-3.21)#11,543 |
| 70. | San Antonio Comunidad Quebradillas Municipio | 4.3% | 5.1%(-0.780)#70 | 7.6%(-3.37)#11,809 |
| 71. | Caguas | 4.1% | 5.1%(-1.00)#71 | 7.6%(-3.60)#12,216 |
| 72. | Humacao | 4.0% | 5.1%(-1.04)#72 | 7.6%(-3.63)#12,273 |
| 73. | Brenas | 4.0% | 5.1%(-1.07)#73 | 7.6%(-3.66)#12,325 |
| 74. | Lares | 4.0% | 5.1%(-1.10)#74 | 7.6%(-3.69)#12,390 |
| 75. | Tierras Nuevas Poniente | 3.8% | 5.1%(-1.28)#75 | 7.6%(-3.87)#12,694 |
| 76. | San German | 3.8% | 5.1%(-1.29)#76 | 7.6%(-3.88)#12,710 |
| 77. | Celada | 3.7% | 5.1%(-1.39)#77 | 7.6%(-3.98)#12,914 |
| 78. | Aibonito | 3.6% | 5.1%(-1.46)#78 | 7.6%(-4.05)#13,043 |
| 79. | Juana Diaz | 3.6% | 5.1%(-1.46)#79 | 7.6%(-4.05)#13,055 |
| 80. | Ponce | 3.6% | 5.1%(-1.50)#80 | 7.6%(-4.09)#13,132 |
| 81. | Guayanilla | 3.6% | 5.1%(-1.50)#81 | 7.6%(-4.09)#13,136 |
| 82. | Vega Alta | 3.5% | 5.1%(-1.56)#82 | 7.6%(-4.15)#13,231 |
| 83. | Yauco | 3.5% | 5.1%(-1.57)#83 | 7.6%(-4.16)#13,251 |
| 84. | Corozal | 3.4% | 5.1%(-1.63)#84 | 7.6%(-4.23)#13,347 |
| 85. | Monte Grande | 3.1% | 5.1%(-1.94)#85 | 7.6%(-4.53)#13,865 |
| 86. | Sabana Eneas | 3.1% | 5.1%(-2.00)#86 | 7.6%(-4.59)#13,967 |
| 87. | Piedra Aguza | 3.0% | 5.1%(-2.04)#87 | 7.6%(-4.63)#14,046 |
| 88. | Aguas Claras | 2.7% | 5.1%(-2.32)#88 | 7.6%(-4.91)#14,508 |
| 89. | Jayuya | 2.7% | 5.1%(-2.33)#89 | 7.6%(-4.92)#14,524 |
| 90. | Hormigueros | 2.7% | 5.1%(-2.34)#90 | 7.6%(-4.93)#14,540 |
| 91. | Caño Martin Peña | 2.7% | 5.1%(-2.34)#91 | 7.6%(-4.93)#14,552 |
| 92. | Puerto Real | 2.6% | 5.1%(-2.47)#92 | 7.6%(-5.07)#14,760 |
| 93. | Caban | 2.6% | 5.1%(-2.49)#93 | 7.6%(-5.08)#14,775 |
| 94. | Utuado | 2.5% | 5.1%(-2.52)#94 | 7.6%(-5.11)#14,842 |
| 95. | San Sebastian | 2.5% | 5.1%(-2.60)#95 | 7.6%(-5.19)#14,956 |
| 96. | Salinas | 2.3% | 5.1%(-2.80)#96 | 7.6%(-5.39)#15,271 |
| 97. | Gurabo | 2.3% | 5.1%(-2.80)#97 | 7.6%(-5.39)#15,272 |
| 98. | Naguabo | 1.9% | 5.1%(-3.19)#98 | 7.6%(-5.78)#15,891 |
| 99. | Guayama | 1.8% | 5.1%(-3.21)#99 | 7.6%(-5.80)#15,930 |
| 100. | Lajas | 1.8% | 5.1%(-3.27)#100 | 7.6%(-5.86)#16,028 |
Common Questions
What are the Top 10 Cities with the Highest Percentage of Population with a Degree in Engineering in Puerto Rico?
Top 10 Cities with the Highest Percentage of Population with a Degree in Engineering in Puerto Rico are:
#1
28.4%
#2
23.5%
#3
22.7%
#4
17.8%
#5
15.1%
#6
14.0%
#7
13.4%
#8
12.7%
#9
11.9%
#10
11.9%
What city has the Highest Percentage of Population with a Degree in Engineering in Puerto Rico?
Lluveras has the Highest Percentage of Population with a Degree in Engineering in Puerto Rico with 28.4%.
What is the Percentage of Population with a Degree in Engineering in the State of Puerto Rico?
Percentage of Population with a Degree in Engineering in Puerto Rico is 5.1%.
What is the Percentage of Population with a Degree in Engineering in the United States?
Percentage of Population with a Degree in Engineering in the United States is 7.6%.